Monotonicity describes whether a metric’s value moves in a single direction over time (only increases) or can both increase and decrease. Understanding monotonicity is essential for choosing the right instrument, aggregation, and downstream calculations (for example, computing rates or deltas).
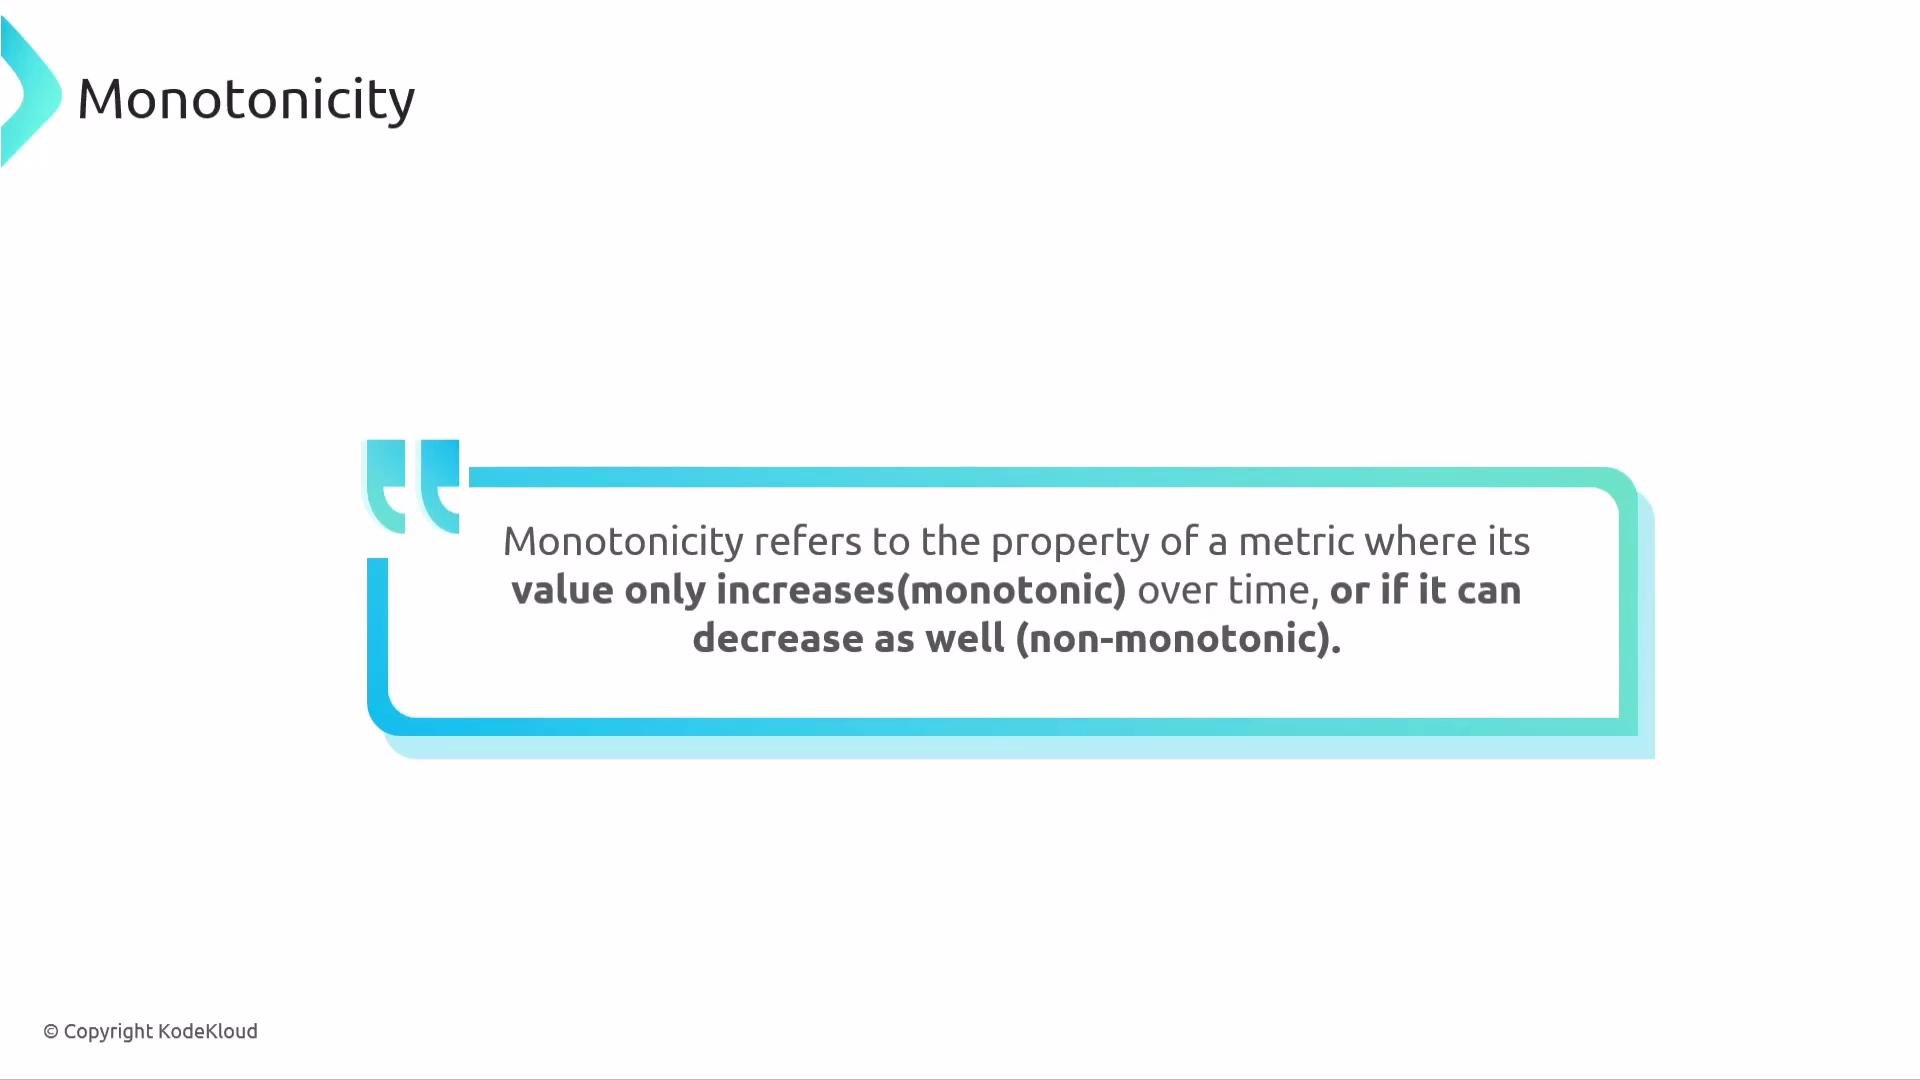
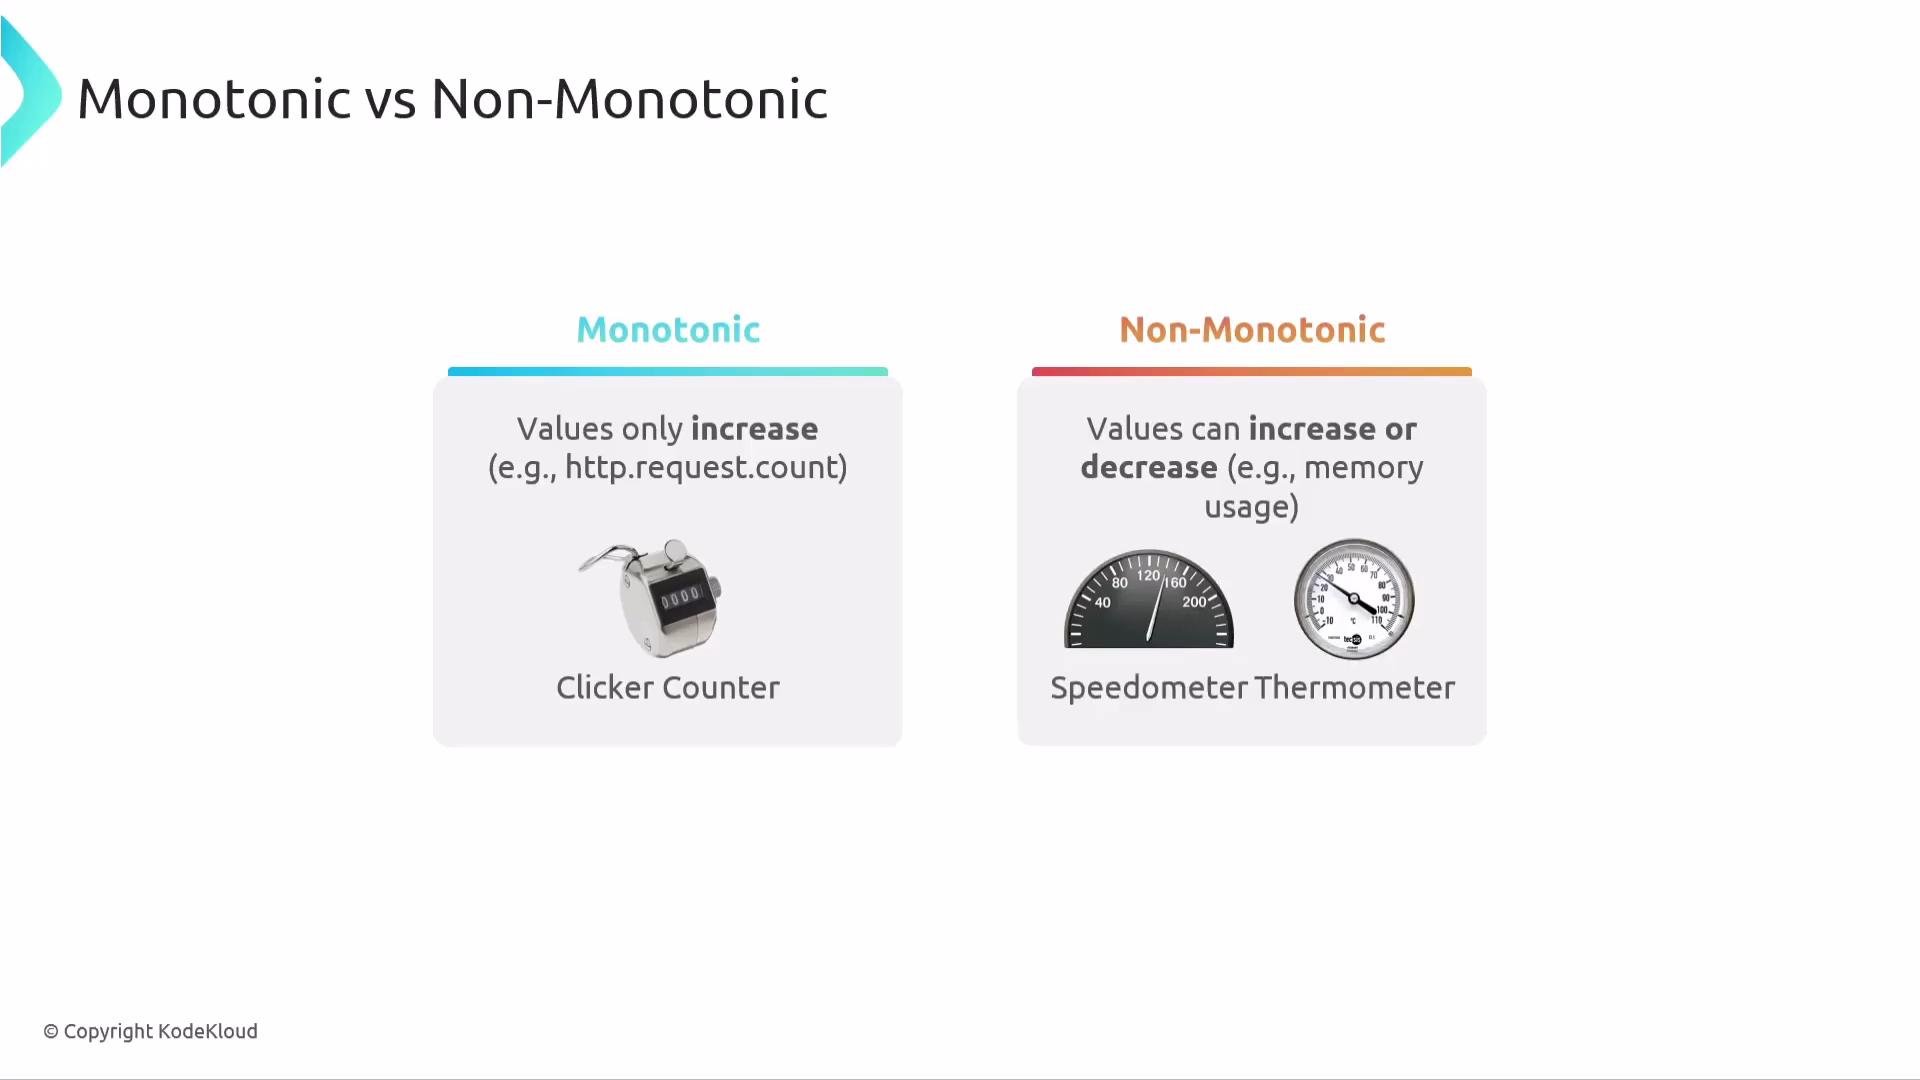
The image explains the concept of monotonicity, describing it as a property where a metric's value either only increases (monotonic) or can both increase and decrease (non-monotonic).
Key distinctions:
  • Monotonic metric: Value only increases (e.g., cumulative counters).
  • Non-monotonic metric: Value can increase and decrease (e.g., gauges).
Common analogies:
  • Monotonic: an electricity meter or an HTTP request counter — readings only go up.
  • Non-monotonic: a speedometer or thermometer — readings go up and down.
A typical monotonic example is a counter that tracks the total number of HTTP requests handled by a service. Gauges are used for values that fluctuate, such as current CPU or memory usage.
The image compares monotonic and non-monotonic values, using a clicker counter to represent monotonic values that only increase, and a speedometer and thermometer to illustrate non-monotonic values that can both increase and decrease.
Operational metrics such as CPU usage, memory usage, and queue length are normally non-monotonic: they rise and fall as load changes. Monotonicity directly influences the choice of instrument type and aggregation method:
  • Use a Counter for monotonically increasing measurements and aggregate as Sum (often used to compute deltas or rates).
  • Use a Gauge or ObservableGauge for measurements that can go up and down and aggregate as LastValue (to represent the current state).
Summary table: instrument, aggregation, and example use cases.
InstrumentTypical aggregationTypical use case
CounterSumTotal number of requests, retries, bytes sent
Gauge / ObservableGaugeLastValueCurrent CPU usage, memory usage, queue length
HistogramDistribution / BucketsLatency distributions, payload sizes
The image is an educational slide explaining why monotonicity matters, highlighting the importance of choosing the right instrument (Counter/Gauge) and ensuring correct metric aggregation, accompanied by a graphic of a laptop loading.
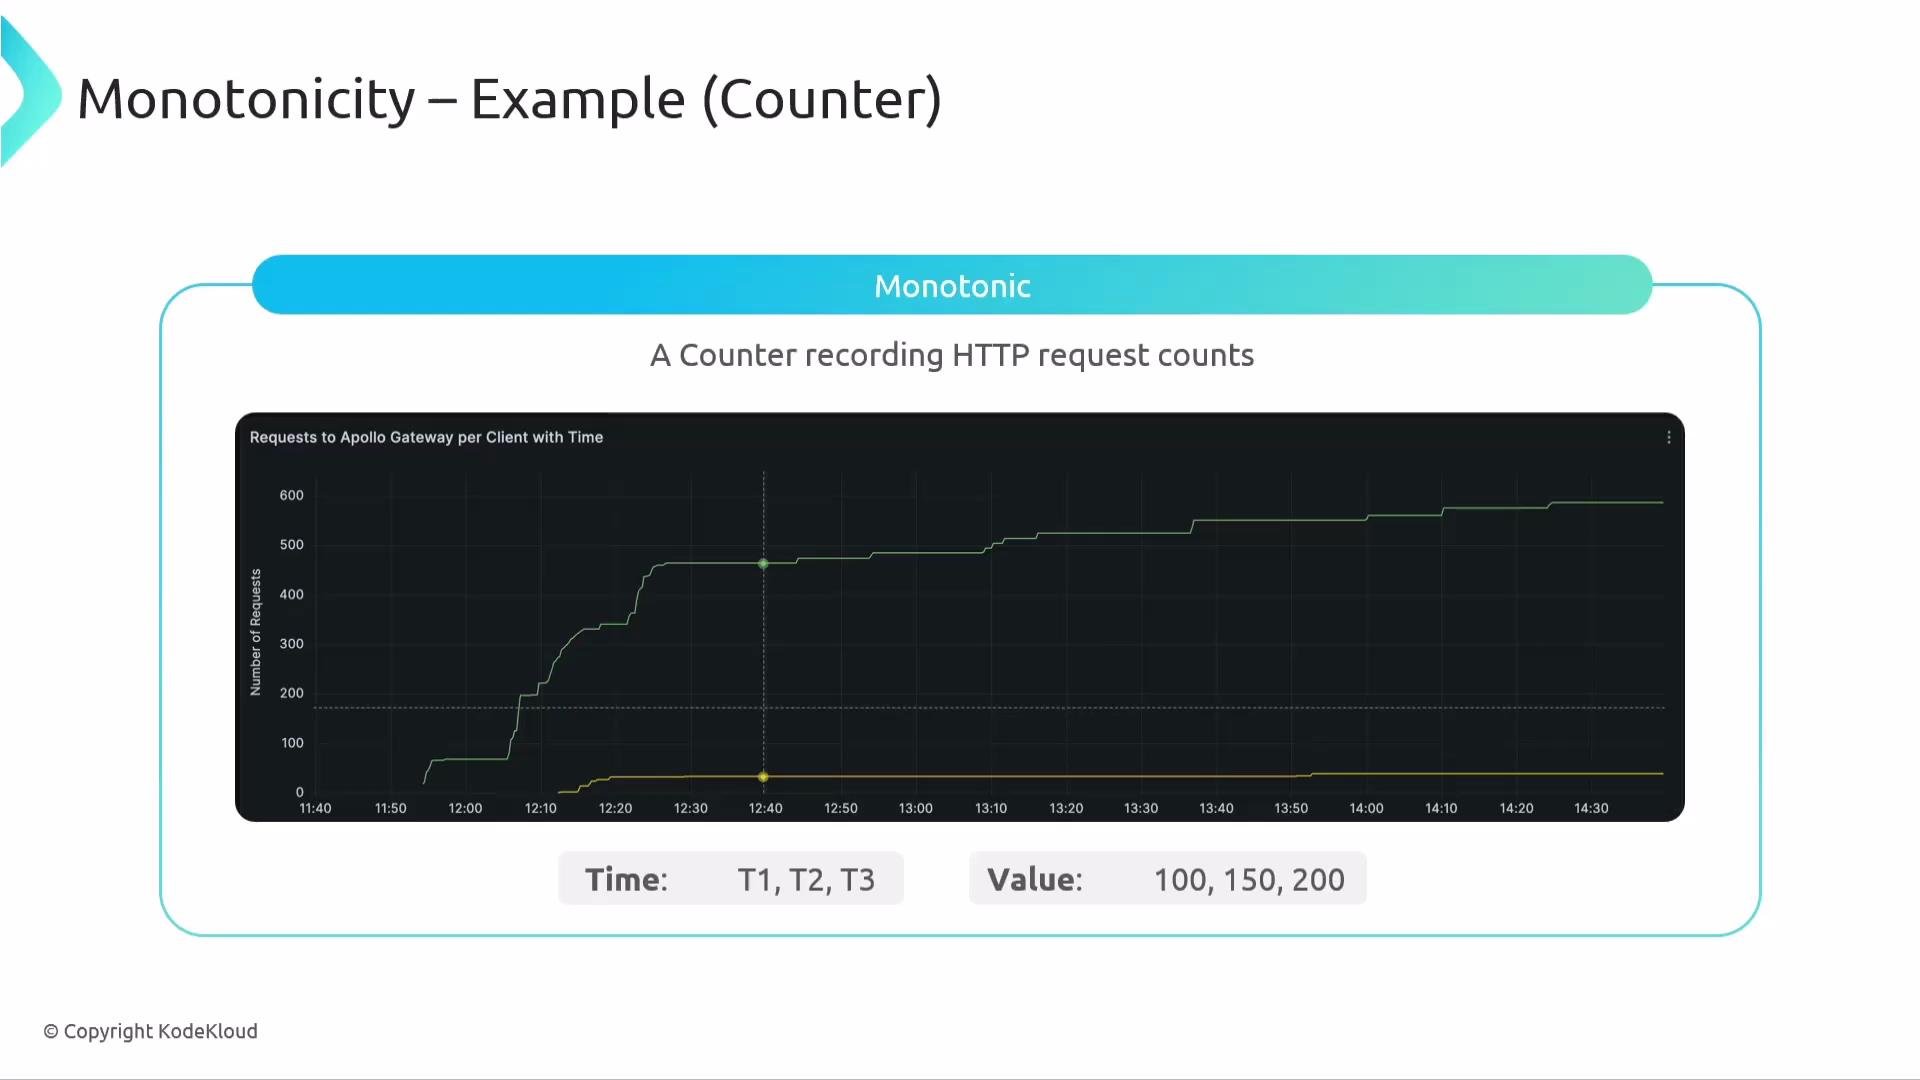
Illustration: a monotonic HTTP request counter never decreases. The slope varies (fast during traffic spikes, flat when idle), but the value always moves forward. This property makes Counters ideal for computing rates (requests per second) by taking deltas over time.
The image is a graph showing the monotonic increase in HTTP request counts over time for an Apollo Gateway, with specific points marked at times T1, T2, and T3. The axis represents the number of requests, displaying a step-like pattern as it increases.
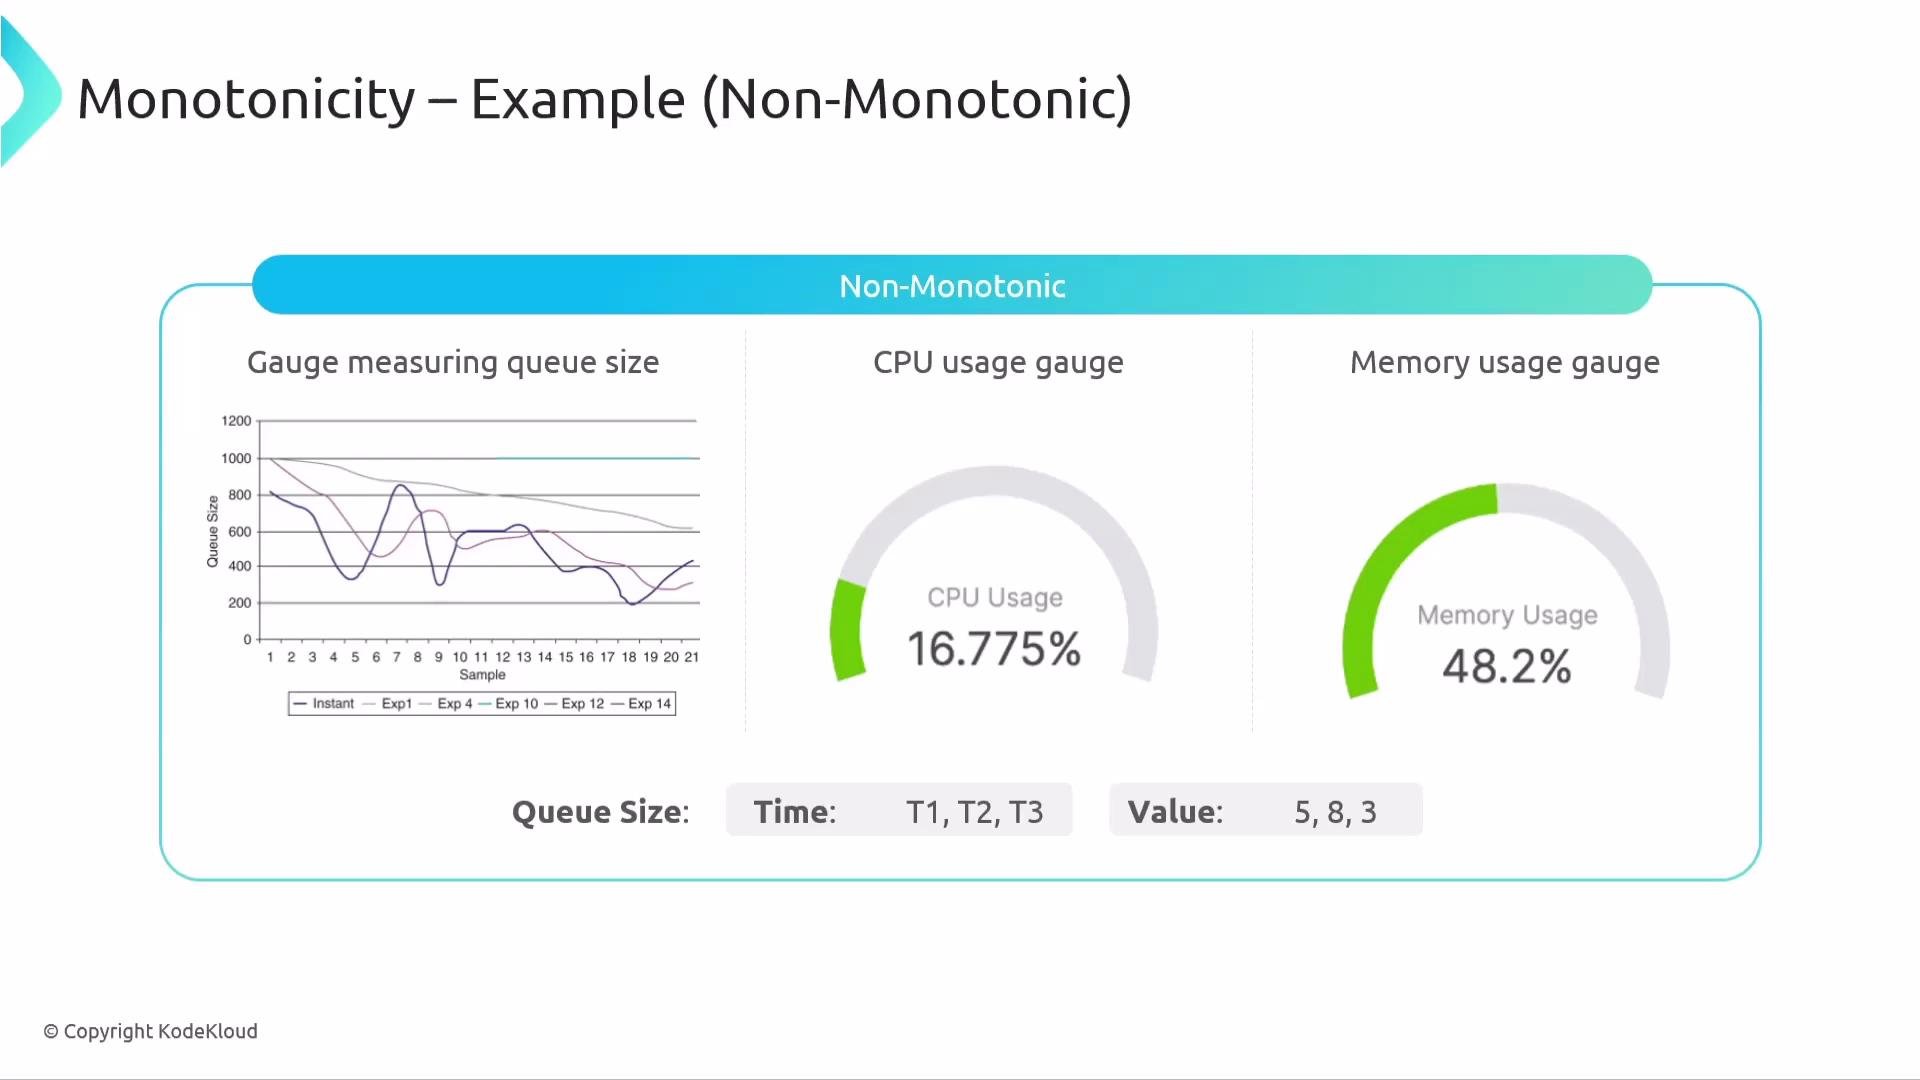
Contrast with non-monotonic metrics: queue size, CPU, and memory usage can increase and decrease. These fluctuations require different handling and aggregations because deltas or rate computations on these values do not make sense.
The image displays a non-monotonic example with a graph showing queue size changes over time and gauges for CPU and memory usage, indicating 16.775% CPU usage and 48.2% memory usage.
Practical examples (pseudocode):
  • Monotonic Counter (OpenTelemetry-like pseudocode)
  • Non-monotonic Gauge (OpenTelemetry-like pseudocode)
In short:
  • If the measurement only ever increases, treat it as monotonic: use Counter and aggregate as Sum.
  • If it can go up and down, treat it as non-monotonic: use Gauge/ObservableGauge and aggregate as LastValue.
Choosing the correct instrument and aggregation for monotonic vs. non-monotonic metrics ensures accurate downstream calculations (for example, computing rates, deltas, or current-state snapshots). This improves alerting, dashboards, and capacity planning.
Do not model decreasing values with a Counter. Treating non-monotonic data as monotonic leads to incorrect sums, rates, and alerts. If you need to represent decreases, use a Gauge or an appropriate observable instrument.
Links and references:

Watch Video