

Monitoring (the “what”)
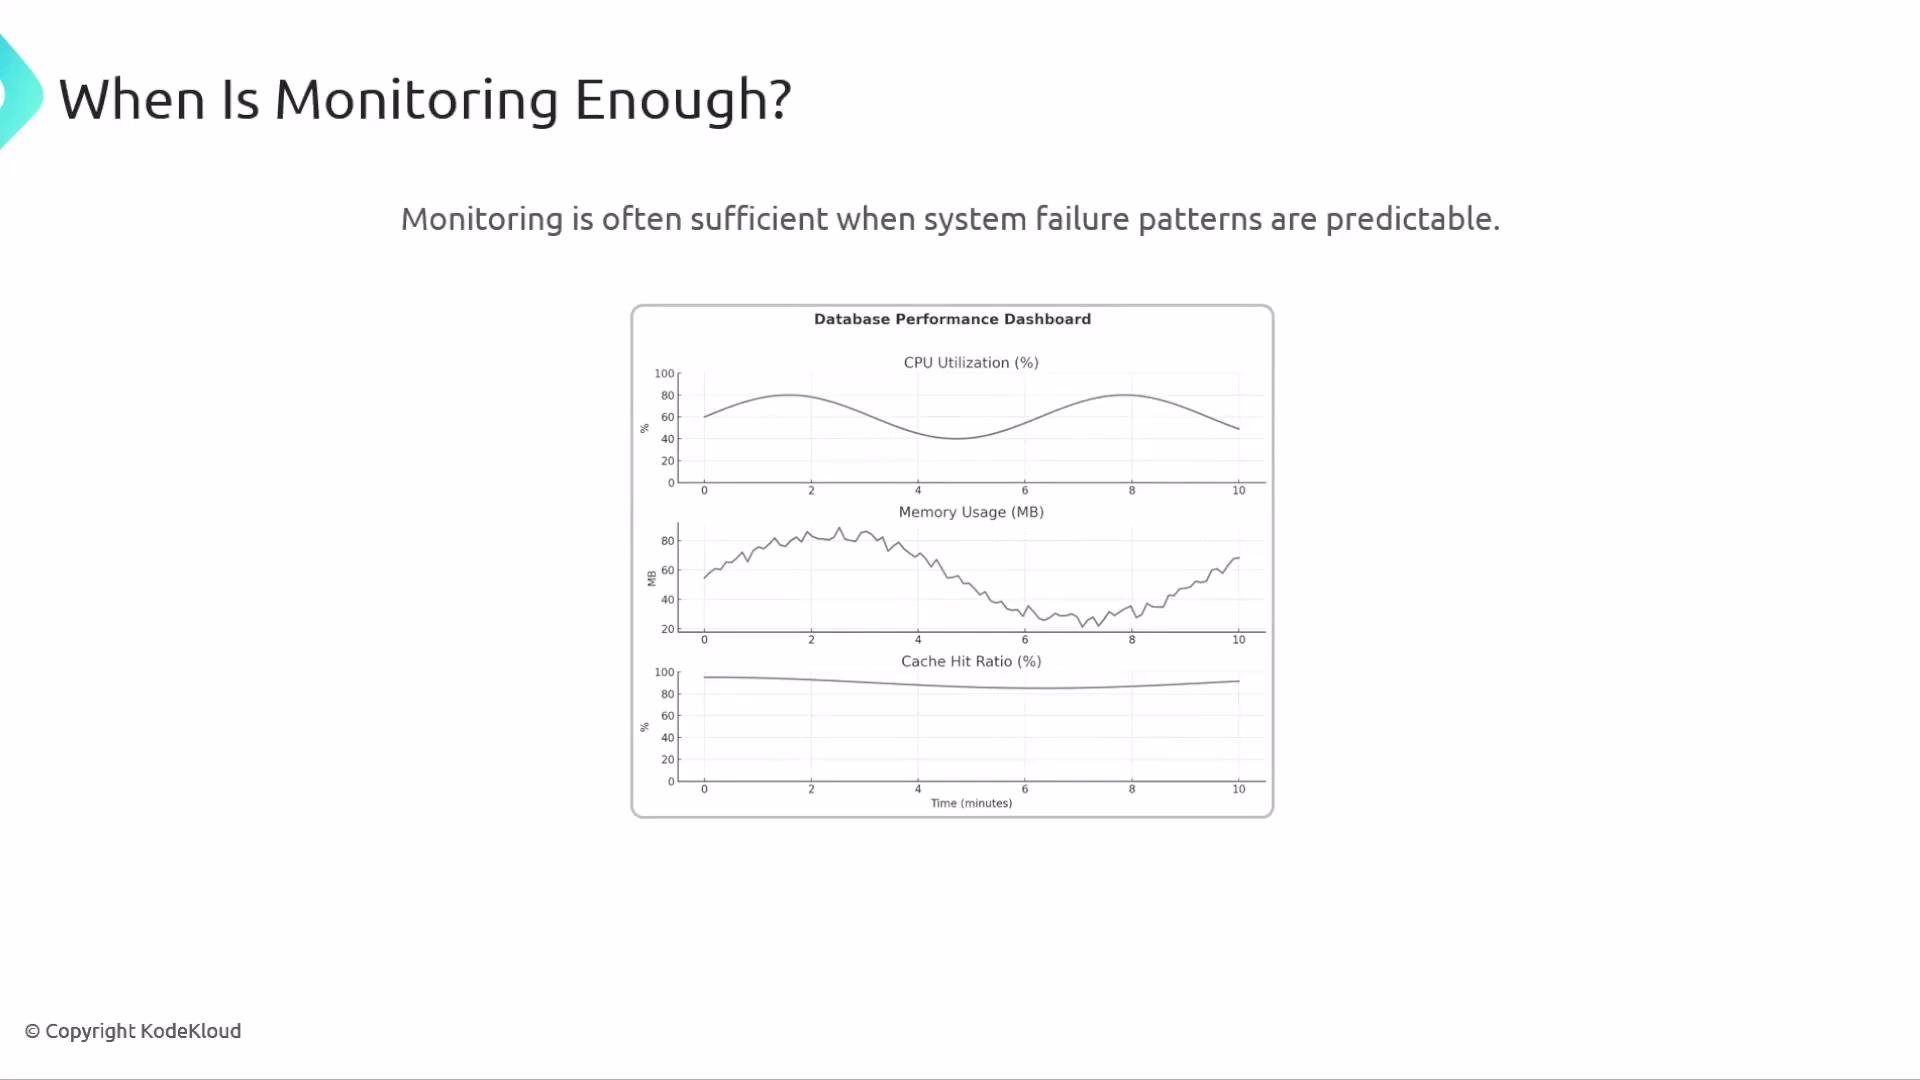
Monitoring begins with collecting and analyzing data to measure progress toward objectives and to support operational decisions.- Focus: detect and alert on known symptoms using predefined metrics and thresholds.
- Common metrics: CPU usage, memory usage, disk latency, response times, error rates.
- Typical workflow: instrument, record metrics, set alerts, respond with runbooks.
- Best fit: predictable failure modes where symptoms and remediation steps are already known.
- Role of logs: logs complement metrics but in many monitoring setups they remain siloed and less flexible for ad-hoc investigation.
Observability (the “why”)
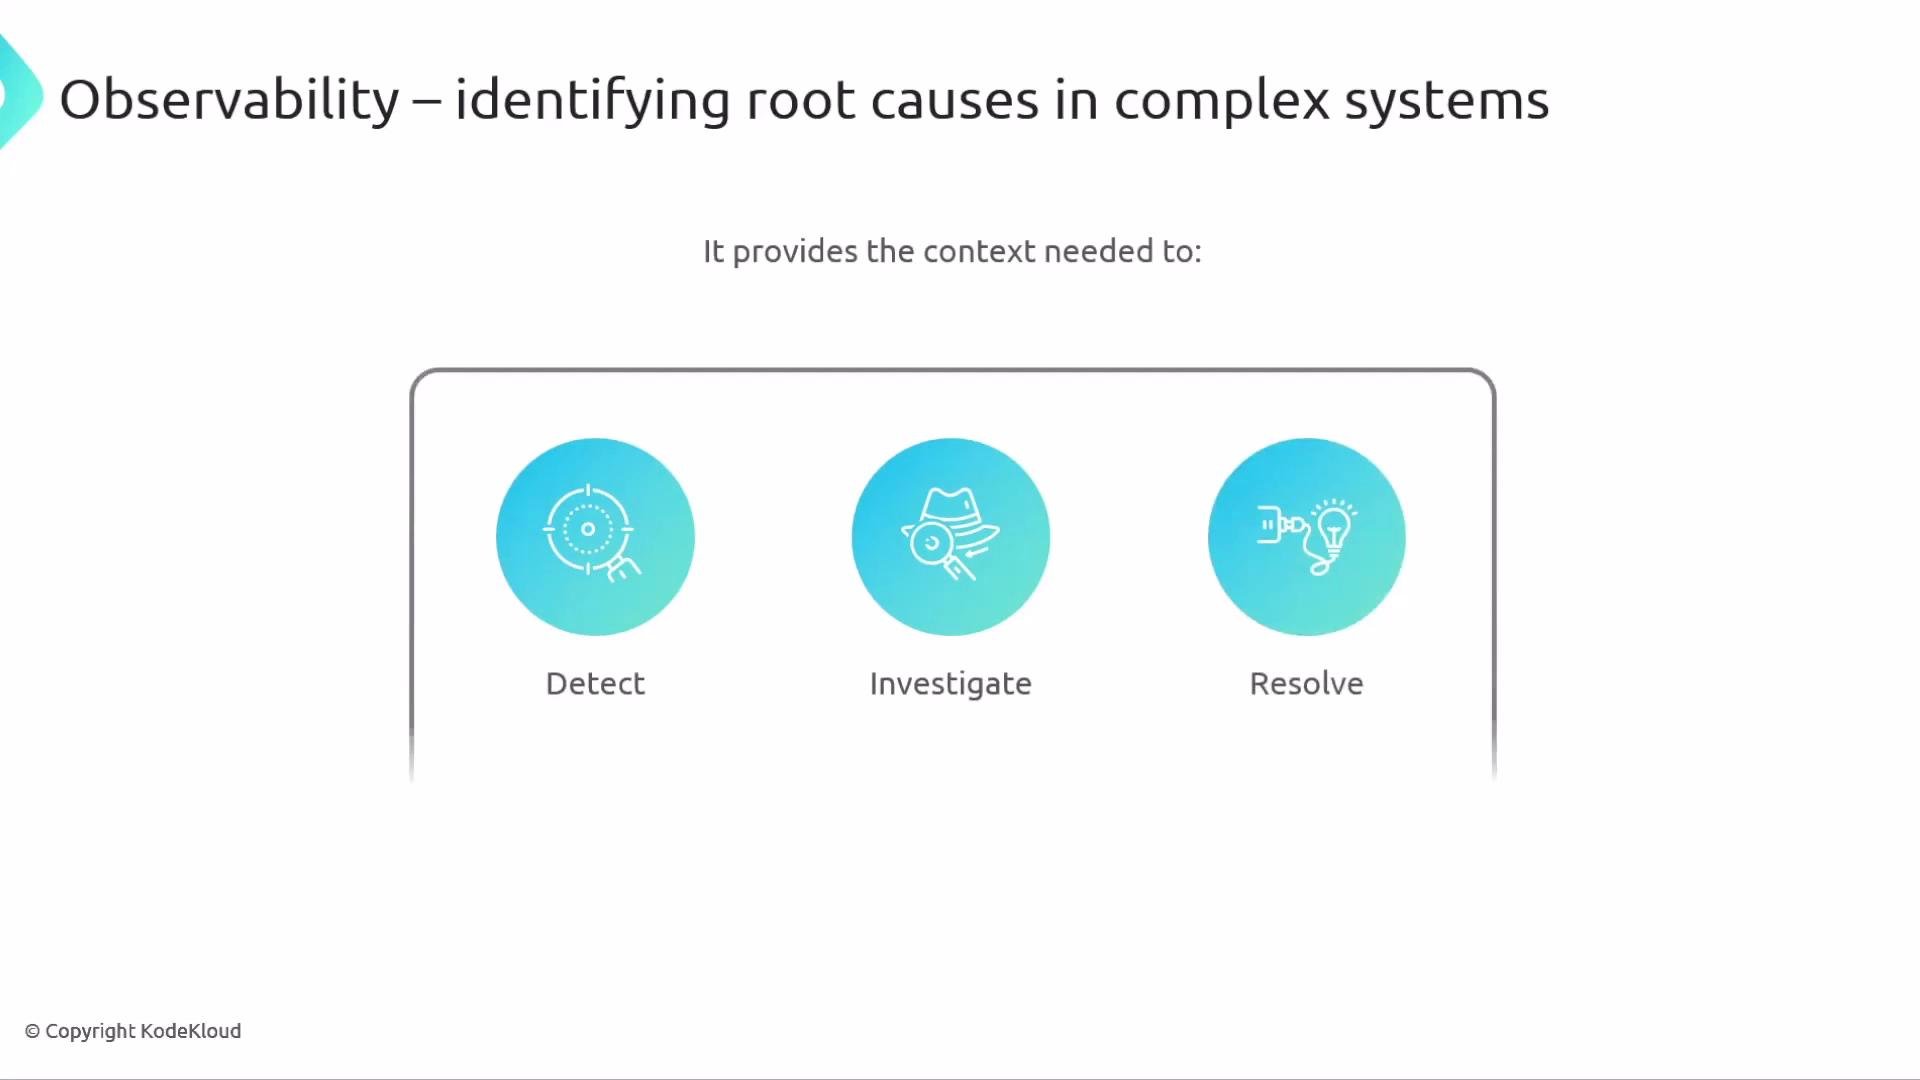
Observability enables you to infer internal system state by correlating telemetry signals so teams can investigate and reason about unexpected behavior.- Focus: provide context and flexible instrumentation to support ad-hoc queries and root-cause analysis.
- Telemetry signals: metrics, logs, distributed traces, profiling data, and contextual baggage.
- Enables asking new questions during incidents without predefining every possible failure mode.
- Best fit: complex, distributed systems where failures are often emergent and not predictable.
- Outcome: faster, more accurate diagnosis of unknown issues and improved system understanding.
Monitoring vs Observability — Side-by-side
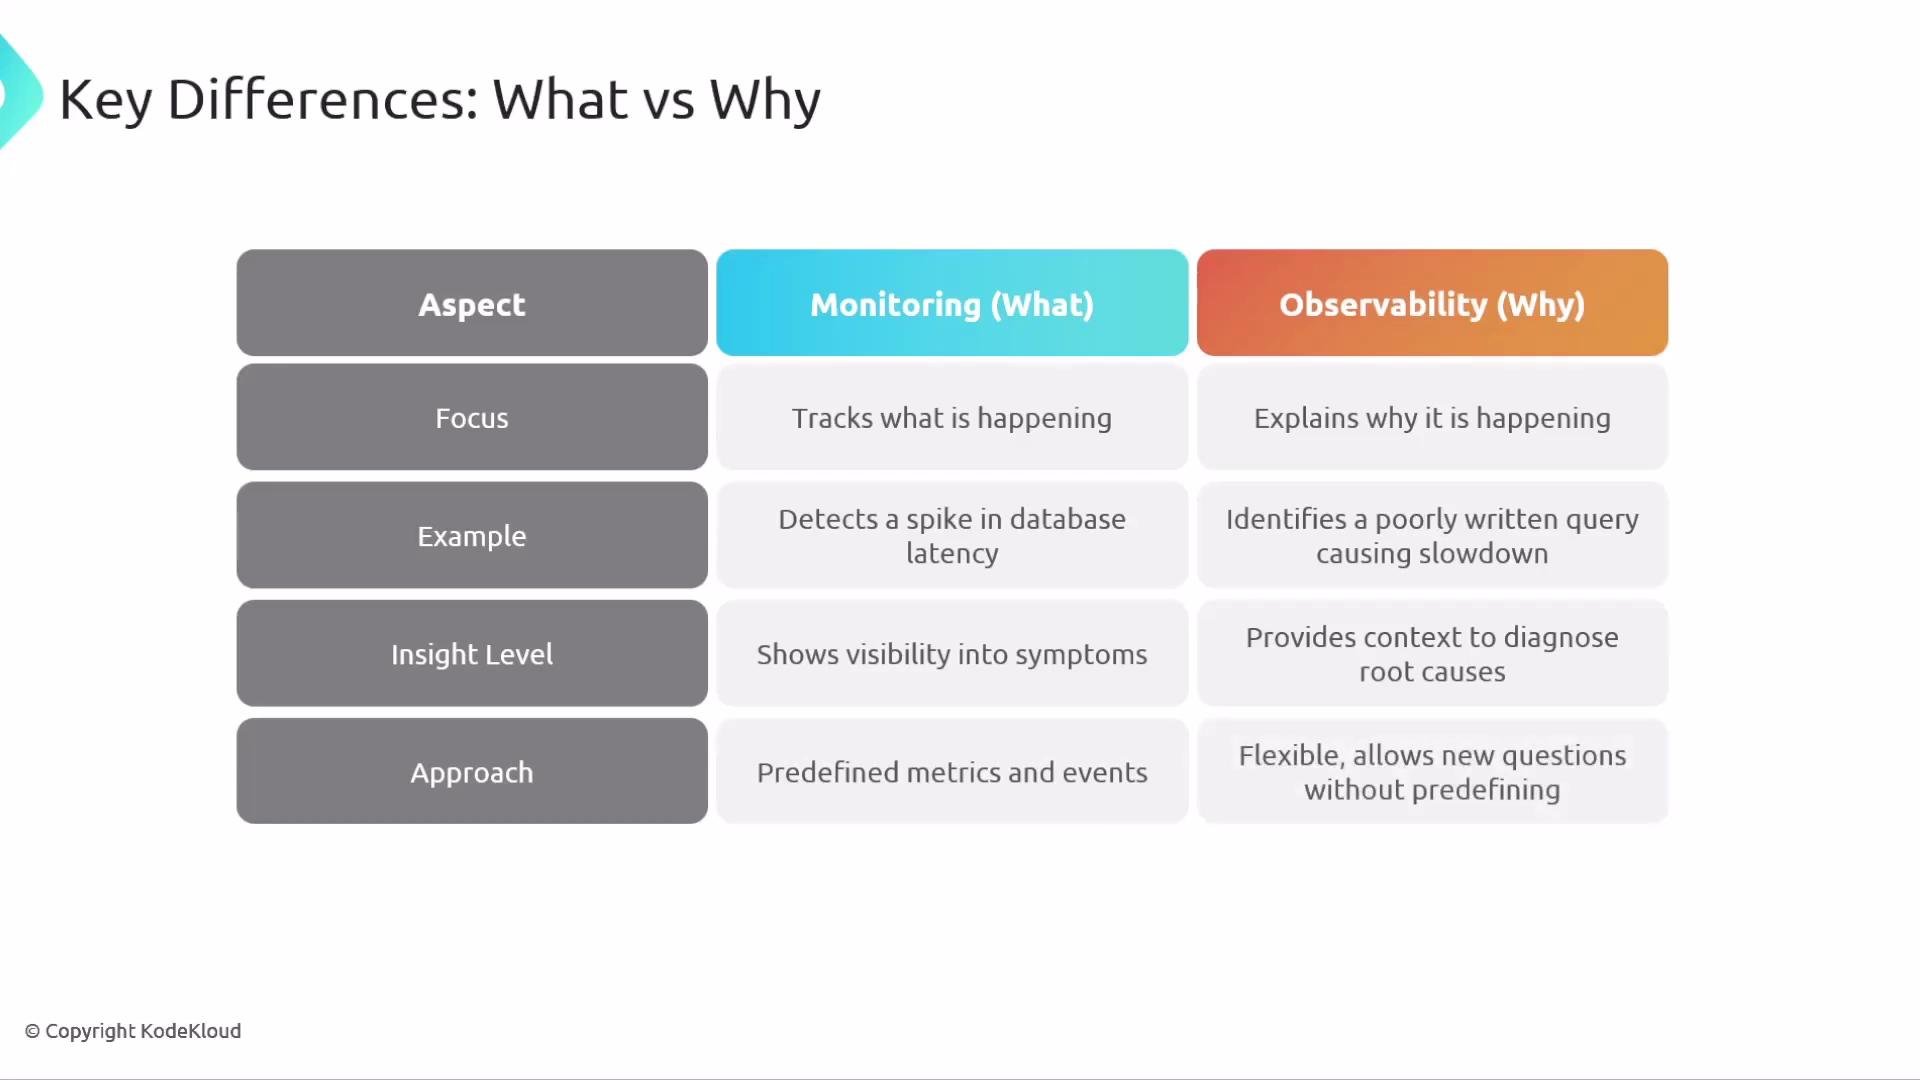
- Monitoring: tracks what is happening (symptoms). Uses predefined metrics and alerts to notify you of known issues.
- Observability: explains why something is happening (root cause). Provides contextual telemetry required to investigate unknown issues and to form new hypotheses.
- Monitoring alerts you that latency is high (the symptom).
- Observability lets you drill into traces, logs, and profiles to find that a deployed schema change or an inefficient query introduced the slowdown (the cause).
Monitoring and observability are complementary: monitoring gives rapid detection via metrics and alerts, while observability provides the richer telemetry and context needed to investigate and diagnose unknown or complex failures.
Practical guidance
- Combine both: use monitoring for SLAs, SLOs, and alerting; use observability to reduce mean time to resolution (MTTR) when incidents are novel or complex.
- Instrument intentionally: capture high-cardinality context only where it aids debugging (e.g., request IDs, user IDs, endpoint names).
- Correlate signals: ensure traces, logs, and metrics share common identifiers to enable seamless investigation.
- Balance cost and retention: observability data can be voluminous — set retention and sampling policies that match your business needs.
Conclusion
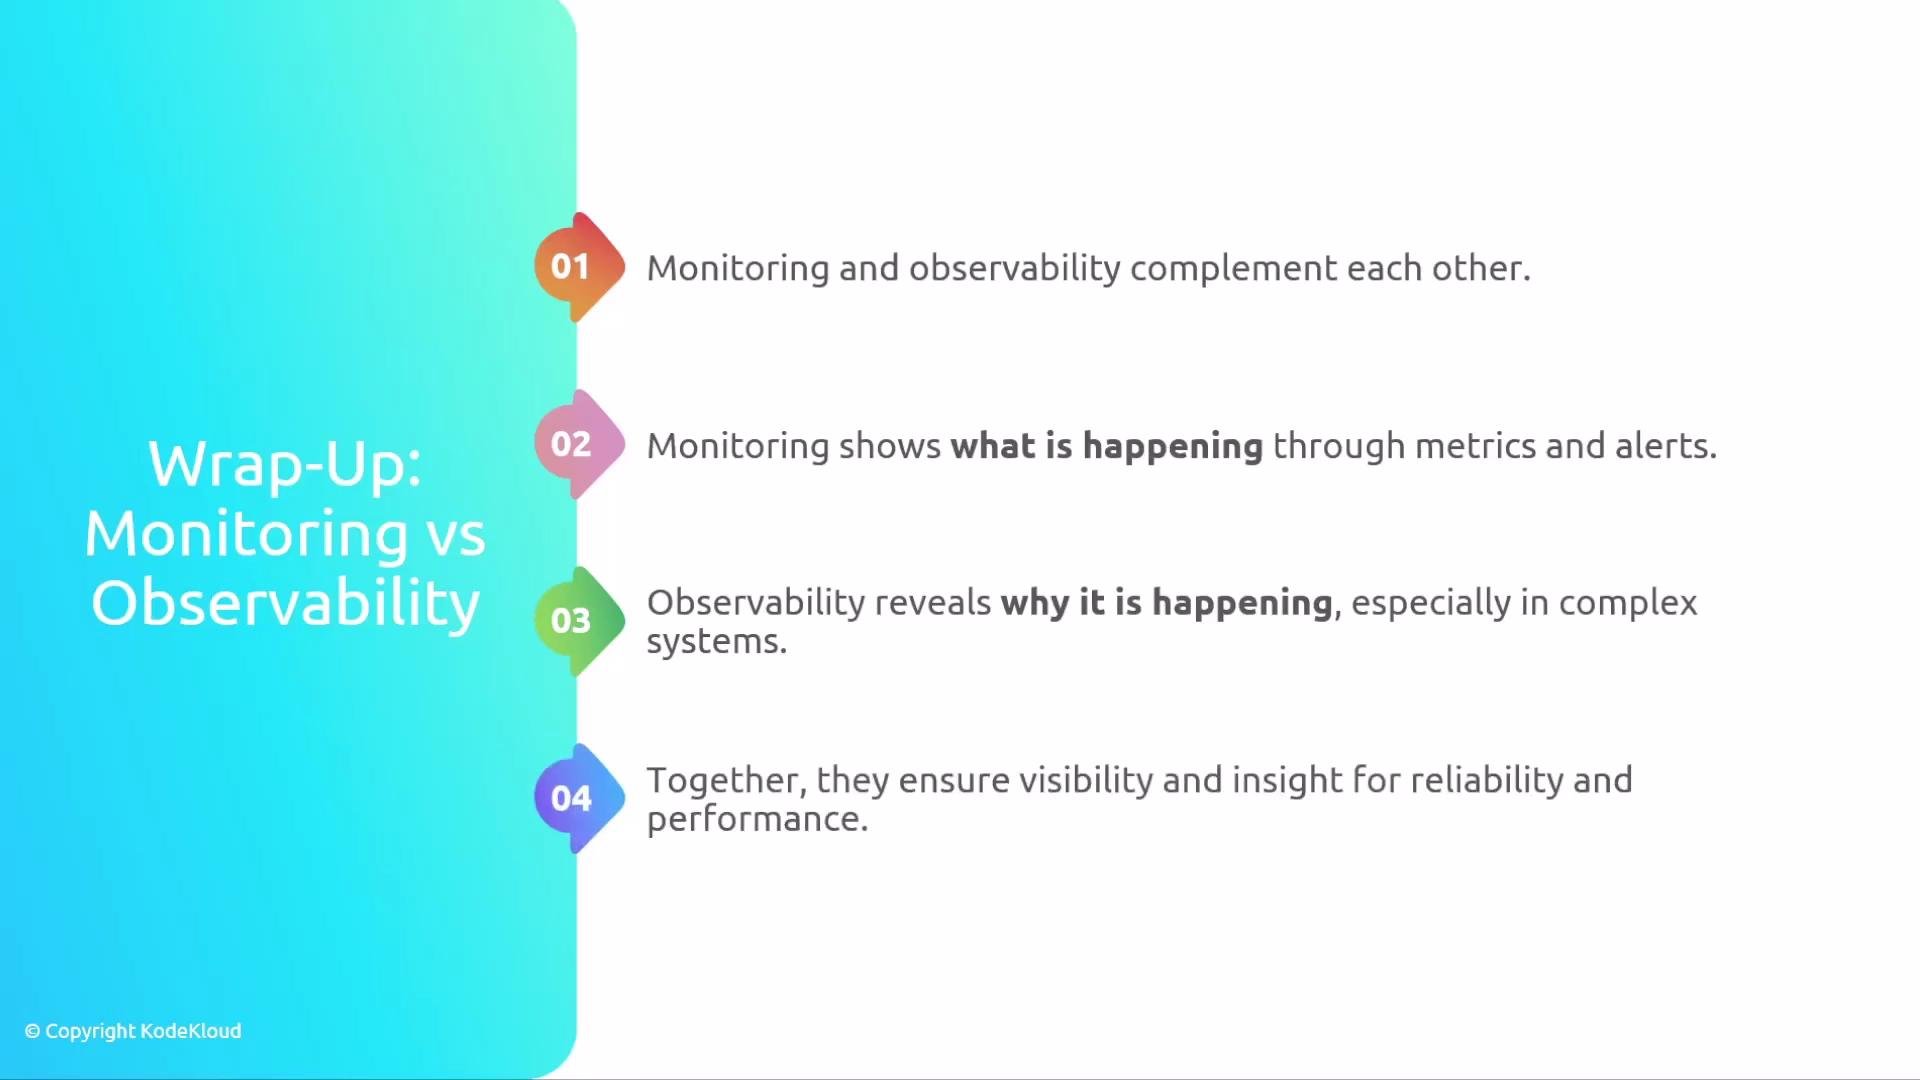
- Monitoring provides visibility into system health and known symptoms.
- Observability gives teams the flexible tooling and contextual telemetry to investigate and diagnose root causes.
- Together, monitoring and observability deliver the visibility and investigative power required for reliable, performant systems — especially in modern distributed architectures.
Links and References
- OpenTelemetry — vendor-neutral collection of observability tools.
- Prometheus — Monitoring system — popular metrics-based monitoring.
- Distributed Tracing — Concepts — overview of tracing for distributed systems.
- Site Reliability Engineering (SRE) concepts — for SLAs, SLOs, and error budgets.