In this lesson we explain how Service-Level Indicators (SLIs) and Service-Level Objectives (SLOs) work together, and how OpenTelemetry (OTel) supplies the telemetry signals that feed SLI measurement and SLO evaluation. What you’ll learn:
  • What SLIs and SLOs measure and why they matter
  • Common SLI types and sample formulas
  • How to convert raw telemetry into useful SLIs with OpenTelemetry
  • Where SLO evaluation should occur in your observability stack
SLIs (Service-Level Indicators) are the primary, user-centric measurements that reflect service performance from the end-user perspective.
The image features the text "Understanding SLIs (Service-Level Indicators)" on a white background with a gradient blue geometric shape. It is credited to KodeKloud.
Common SLI categories and what they represent:
SLI categoryWhat it measuresTypical user-focused question
AvailabilityWhether the service is up and responding”Is the site reachable?”
LatencyHow quickly requests finish”How long do actions take?”
ErrorsFrequency of failed requests”How often do users get errors?”
ThroughputVolume of handled requests”How much traffic do we serve?”
SaturationResource utilization and headroom”How close are resources to limits?”
Metrics are useful raw signals, but to form meaningful SLIs you often convert counts and histograms into rates or proportions (percentages) that reflect user experience.
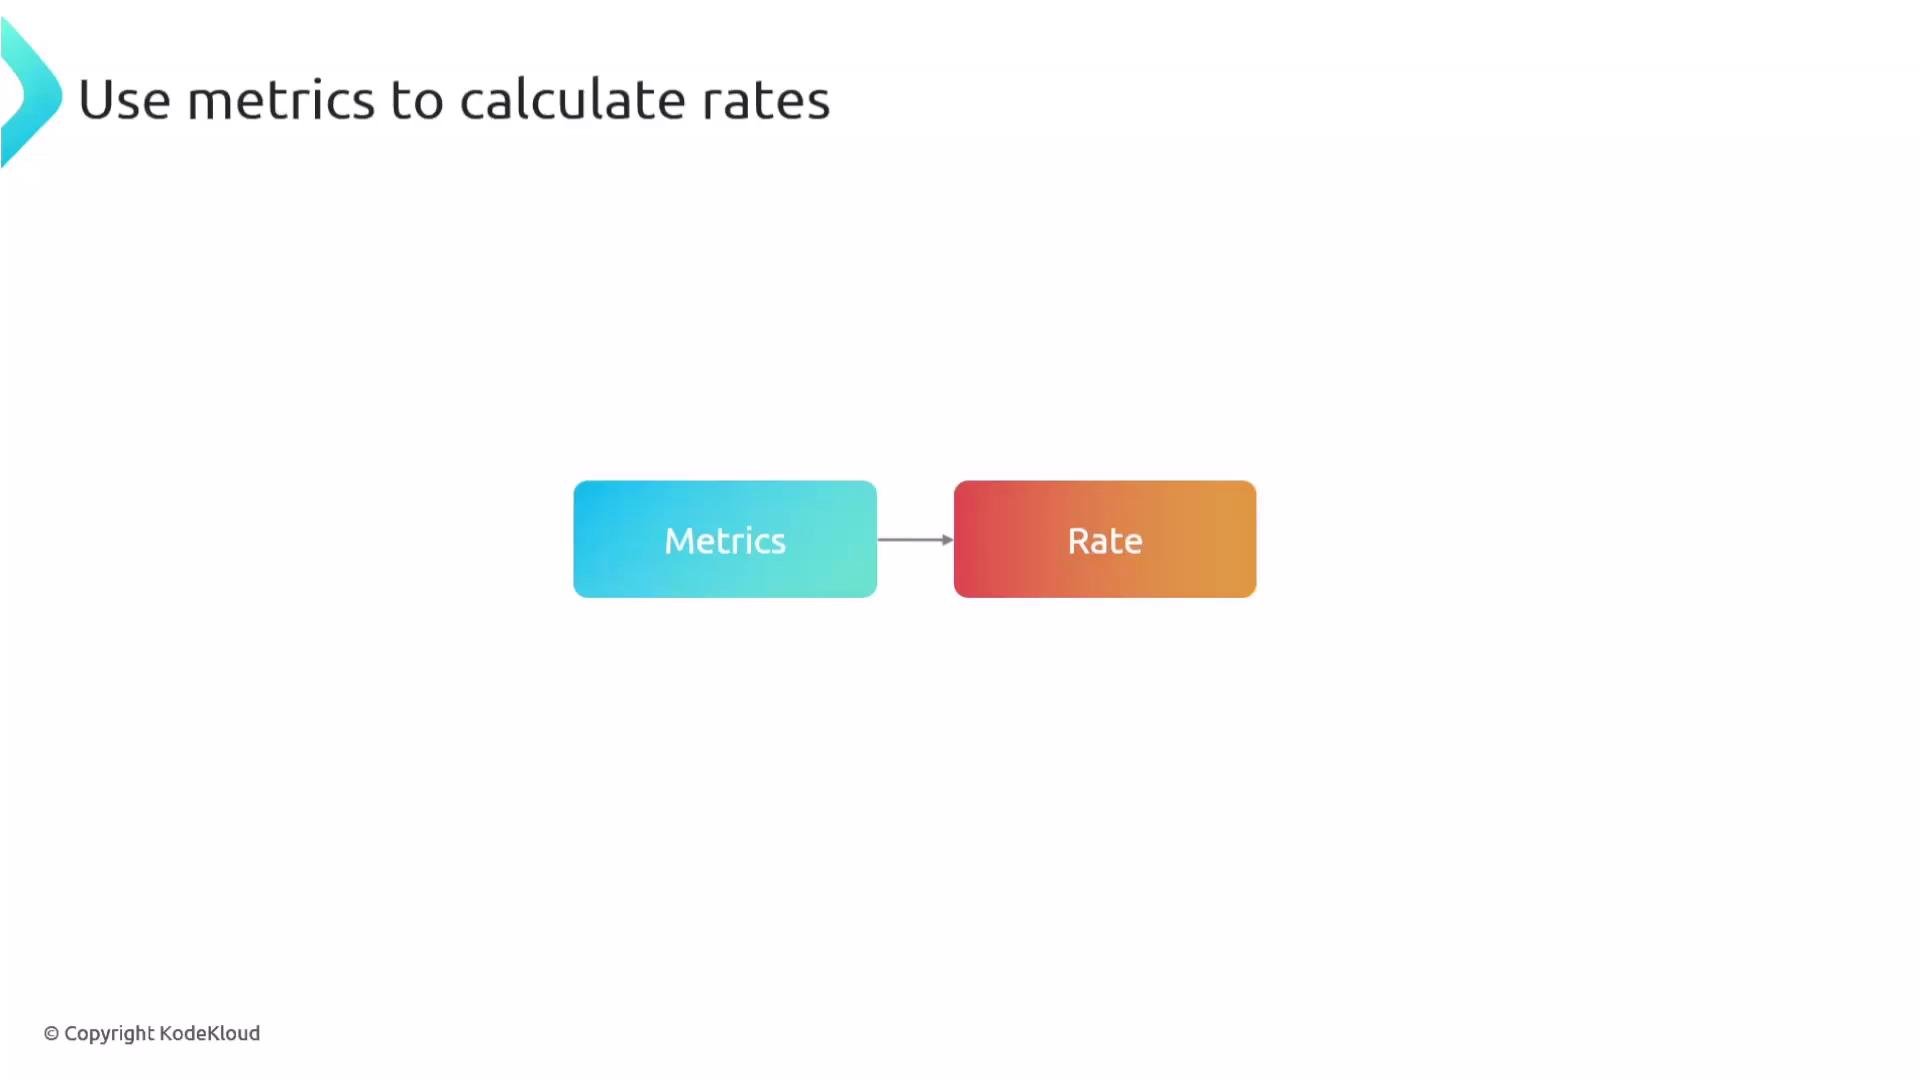
The image shows a simple diagram with two connected boxes labeled "Metrics" and "Rate," illustrating the concept of using metrics to calculate rates.
Quick formulas for common SLIs
  • Success rate SLI:
    • Definition: Percentage of valid requests that are considered successful.
    • Formula: (good events / valid events) × 100
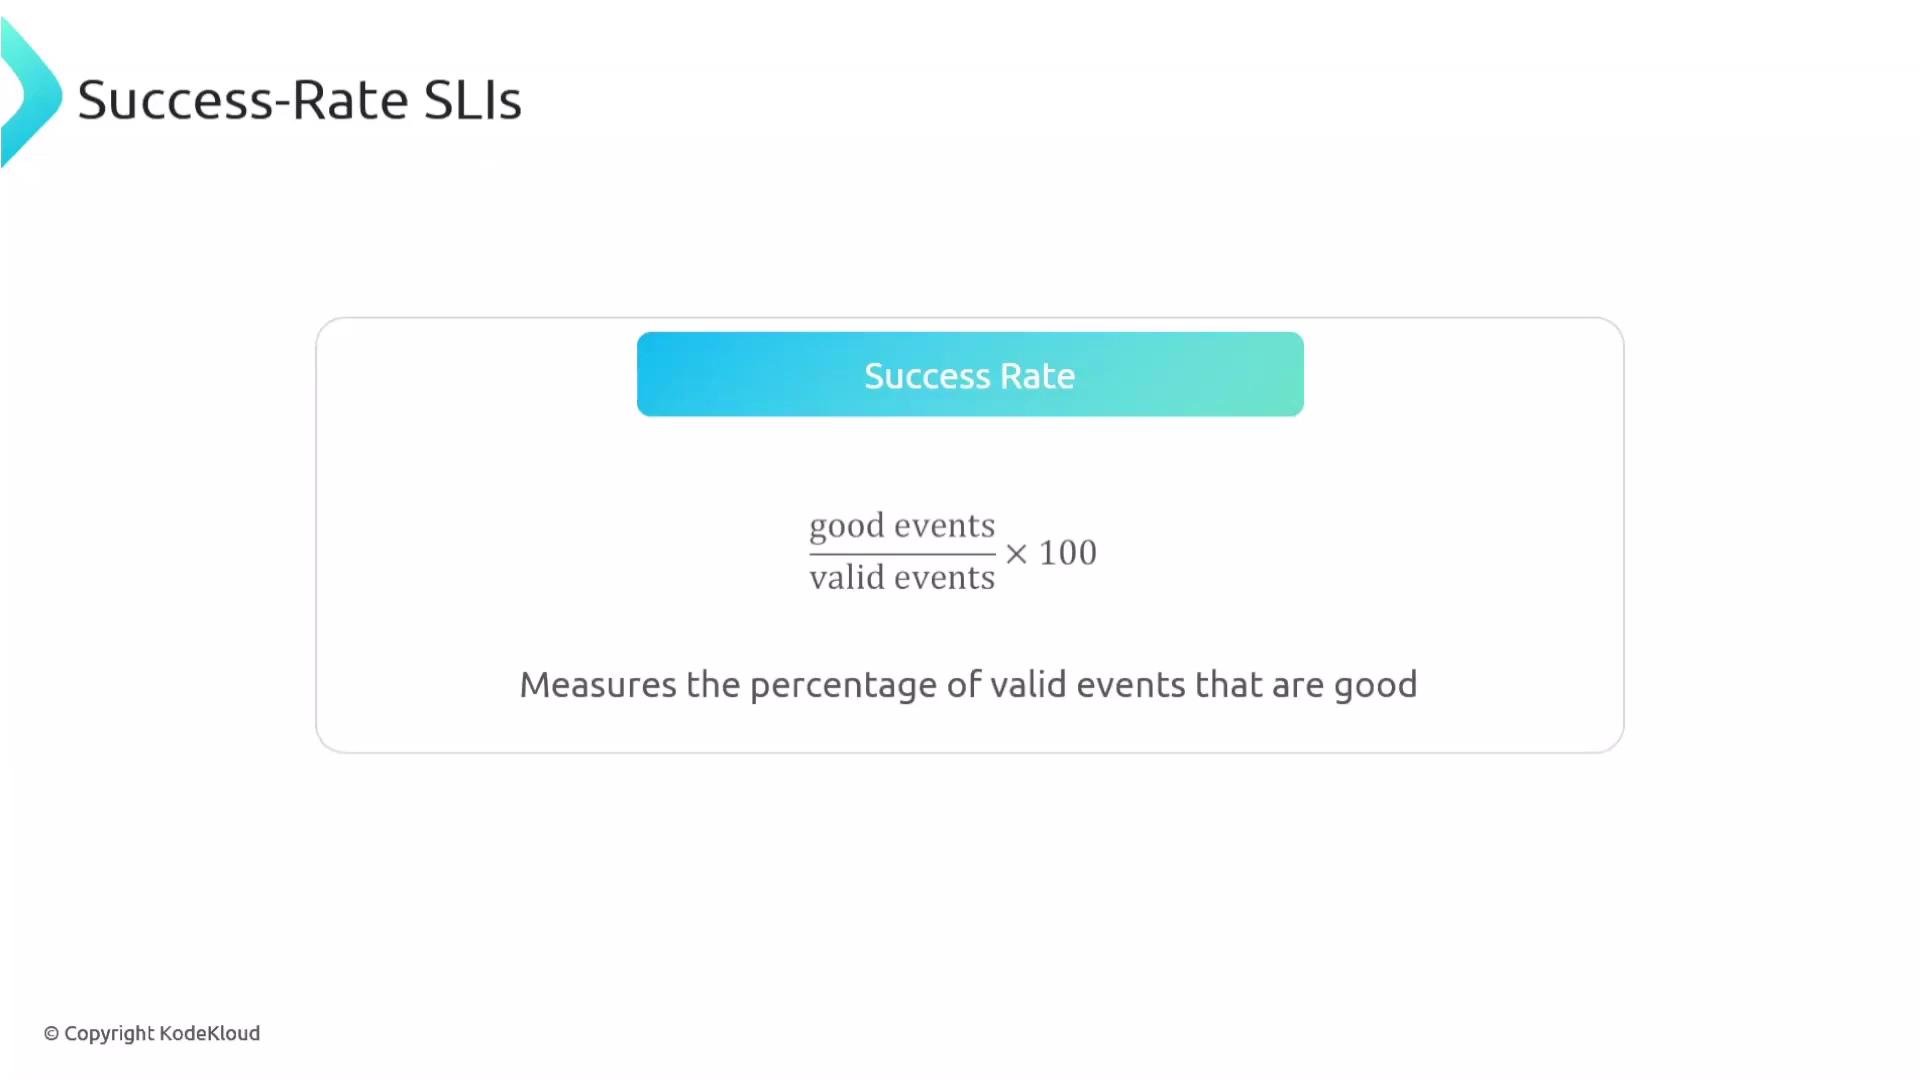
The image explains a formula for calculating "Success Rate SLIs," which is the percentage of valid events that are good, defined as (good events / valid events) x 100.
  • Latency compliance SLI:
    • Definition: Fraction of requests finishing below a chosen latency threshold.
    • Formula: (requests below latency threshold / total requests) × 100
When converting a fraction to a percentage, multiply by × 100. If you see diagrams showing × 1000 in this context, that is incorrect for percentage conversion.
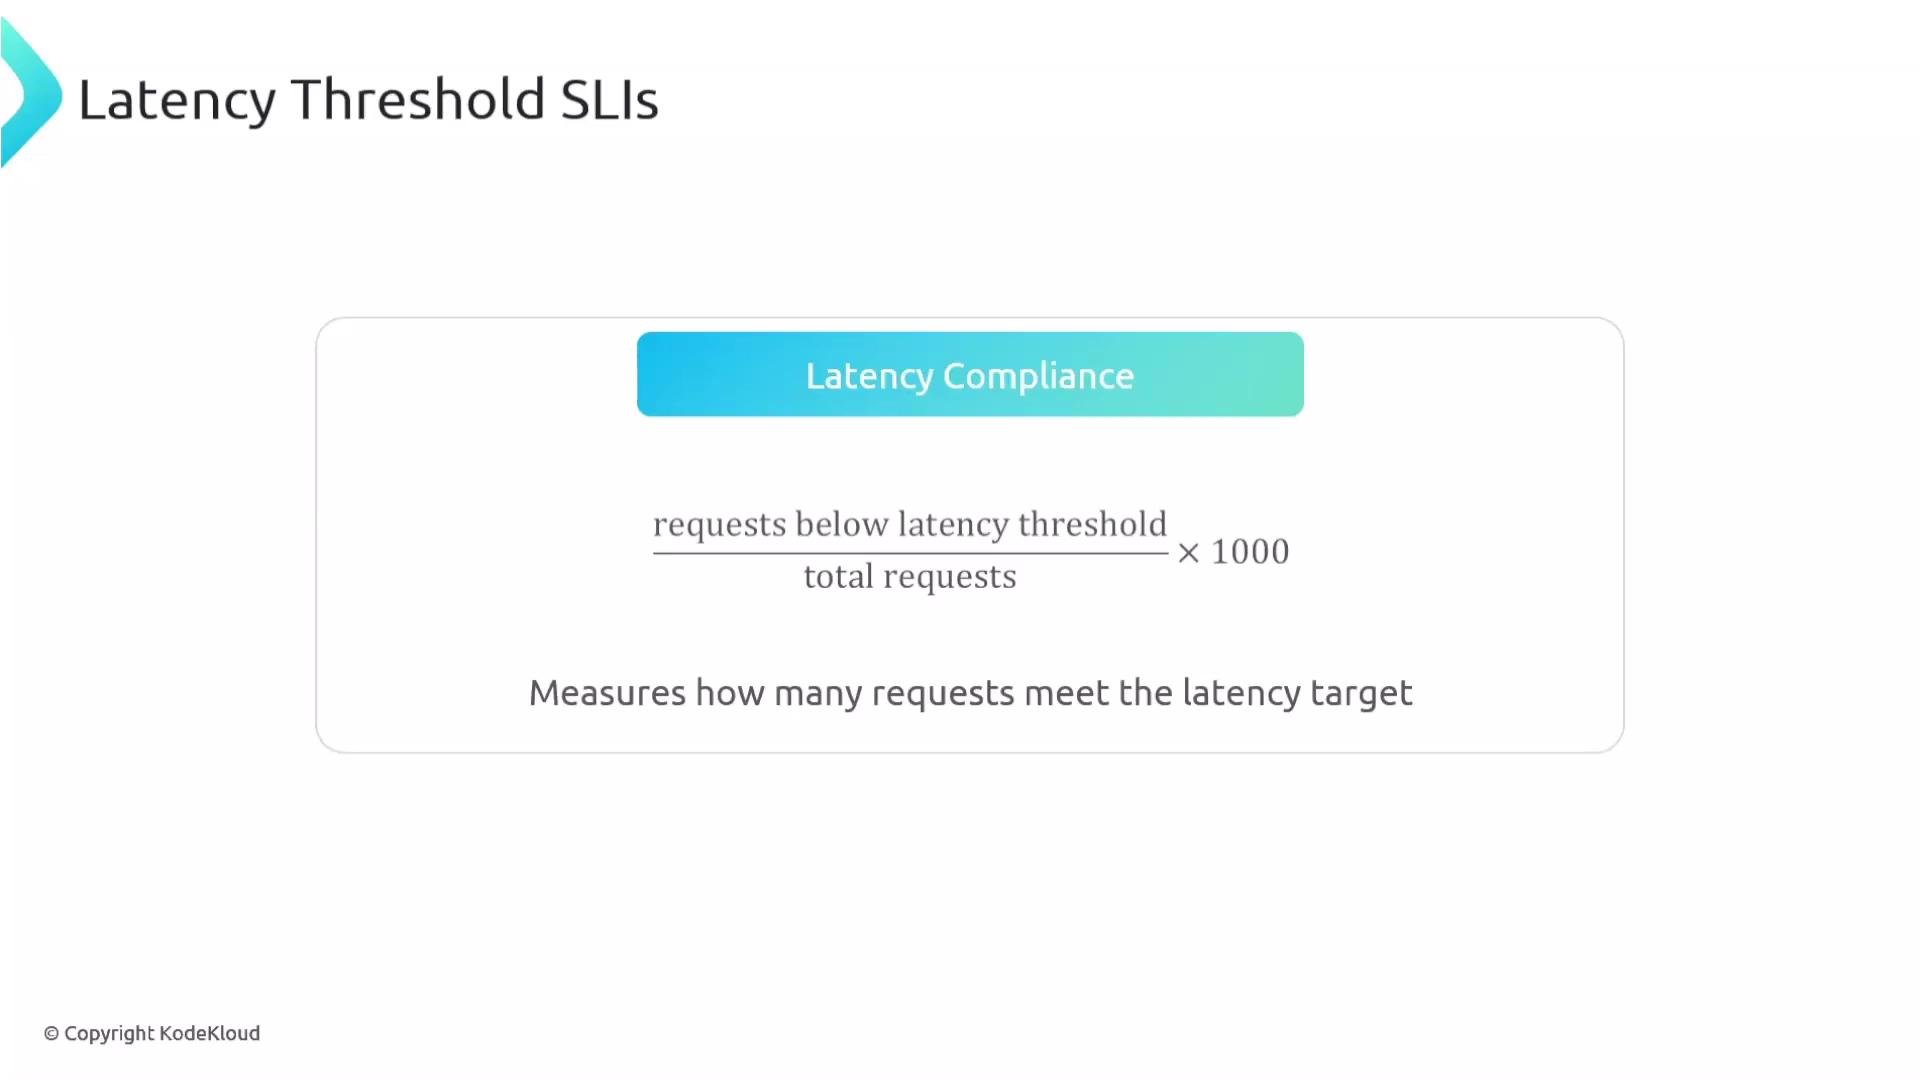
The image shows a formula for "Latency Compliance," which measures the percentage of requests meeting a specified latency target. It calculates the proportion of requests below a latency threshold out of total requests, multiplied by 1000.
  • Error rate SLI:
    • Definition: How often requests fail.
    • Formula: (failed requests / total requests) × 100
From SLIs to SLOs: a practical workflow
  1. Start with a user-centric goal — describe what a good user experience looks like.
  2. Select an SLI that quantifies that goal (for example, latency < 200 ms).
  3. Define an SLO: how often will the SLI meet that criterion over a window? (e.g., 99% of requests under 200 ms, measured over 30 days).
  4. Configure alerting for SLI trends and breaches so teams can act before SLA obligations are violated.
Example: suppose your SLO is “99% of requests under 200 ms over 30 days.” If the current median response time rises to 1 second, an alert should prompt investigation and corrective actions: add capacity, roll back a release, or pause new deployments until reliability is restored. User-centric SLIs are preferred
  • Typical user-facing examples:
    • Page load P95 < 250 ms
    • Success rate > 99.5%
  • Infrastructure metrics (e.g., CPU usage) are useful for diagnostics but do not always correlate directly with perceived user experience. SLIs should focus on outcomes users care about.
OpenTelemetry and SLIs OpenTelemetry captures the telemetry necessary to compute SLIs:
  • Metrics: counters, gauges, histograms (e.g., request counts, latency histograms).
  • Traces: span durations and status codes (useful for latency and success-rate calculations).
  • Logs: can be parsed and converted into metrics for SLI computation.
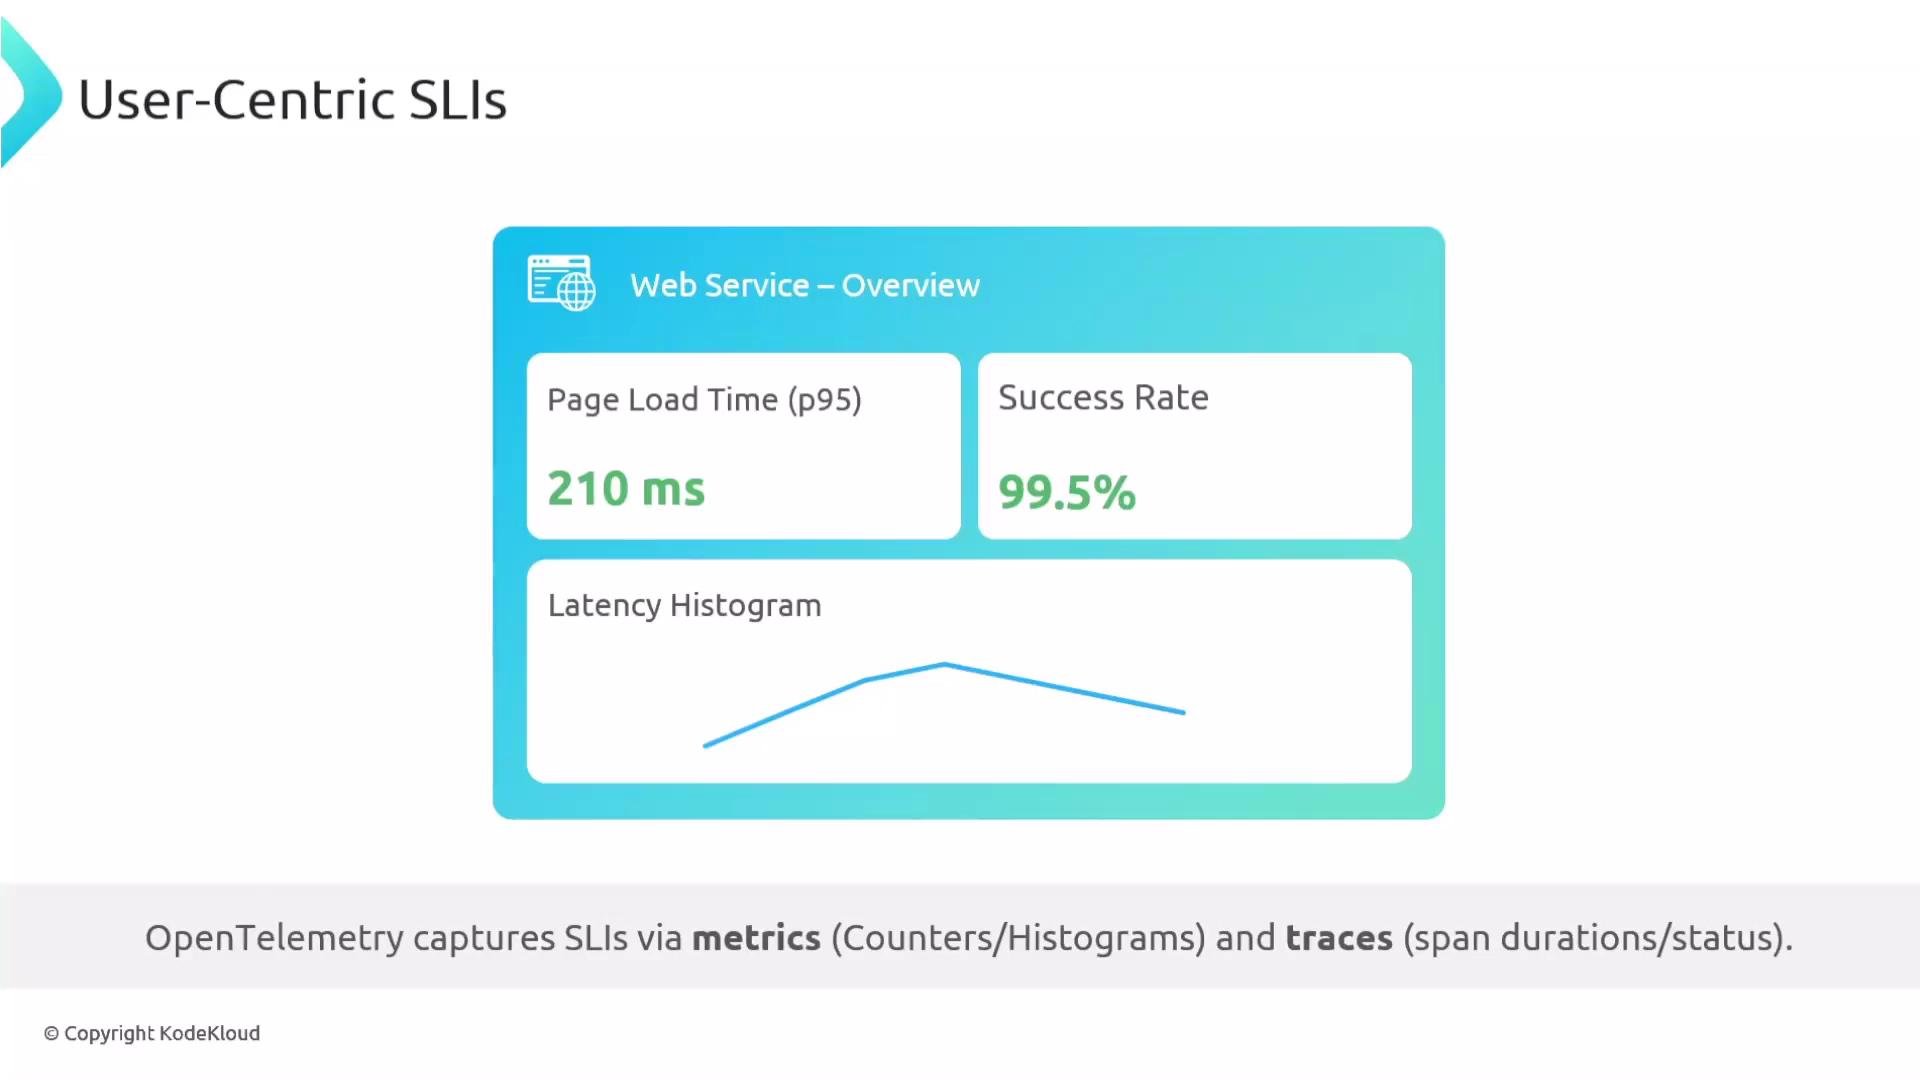
The image shows a user-centric SLI dashboard for a web service, displaying page load time at 210 ms and a success rate of 99.5%, along with a latency histogram. The text below mentions OpenTelemetry capturing SLIs via metrics and traces.
Practical notes:
  • You can convert error counts observed in logs into metrics for SLI reporting.
  • Use traces to derive precise latency (span duration) and success/failure indicators.
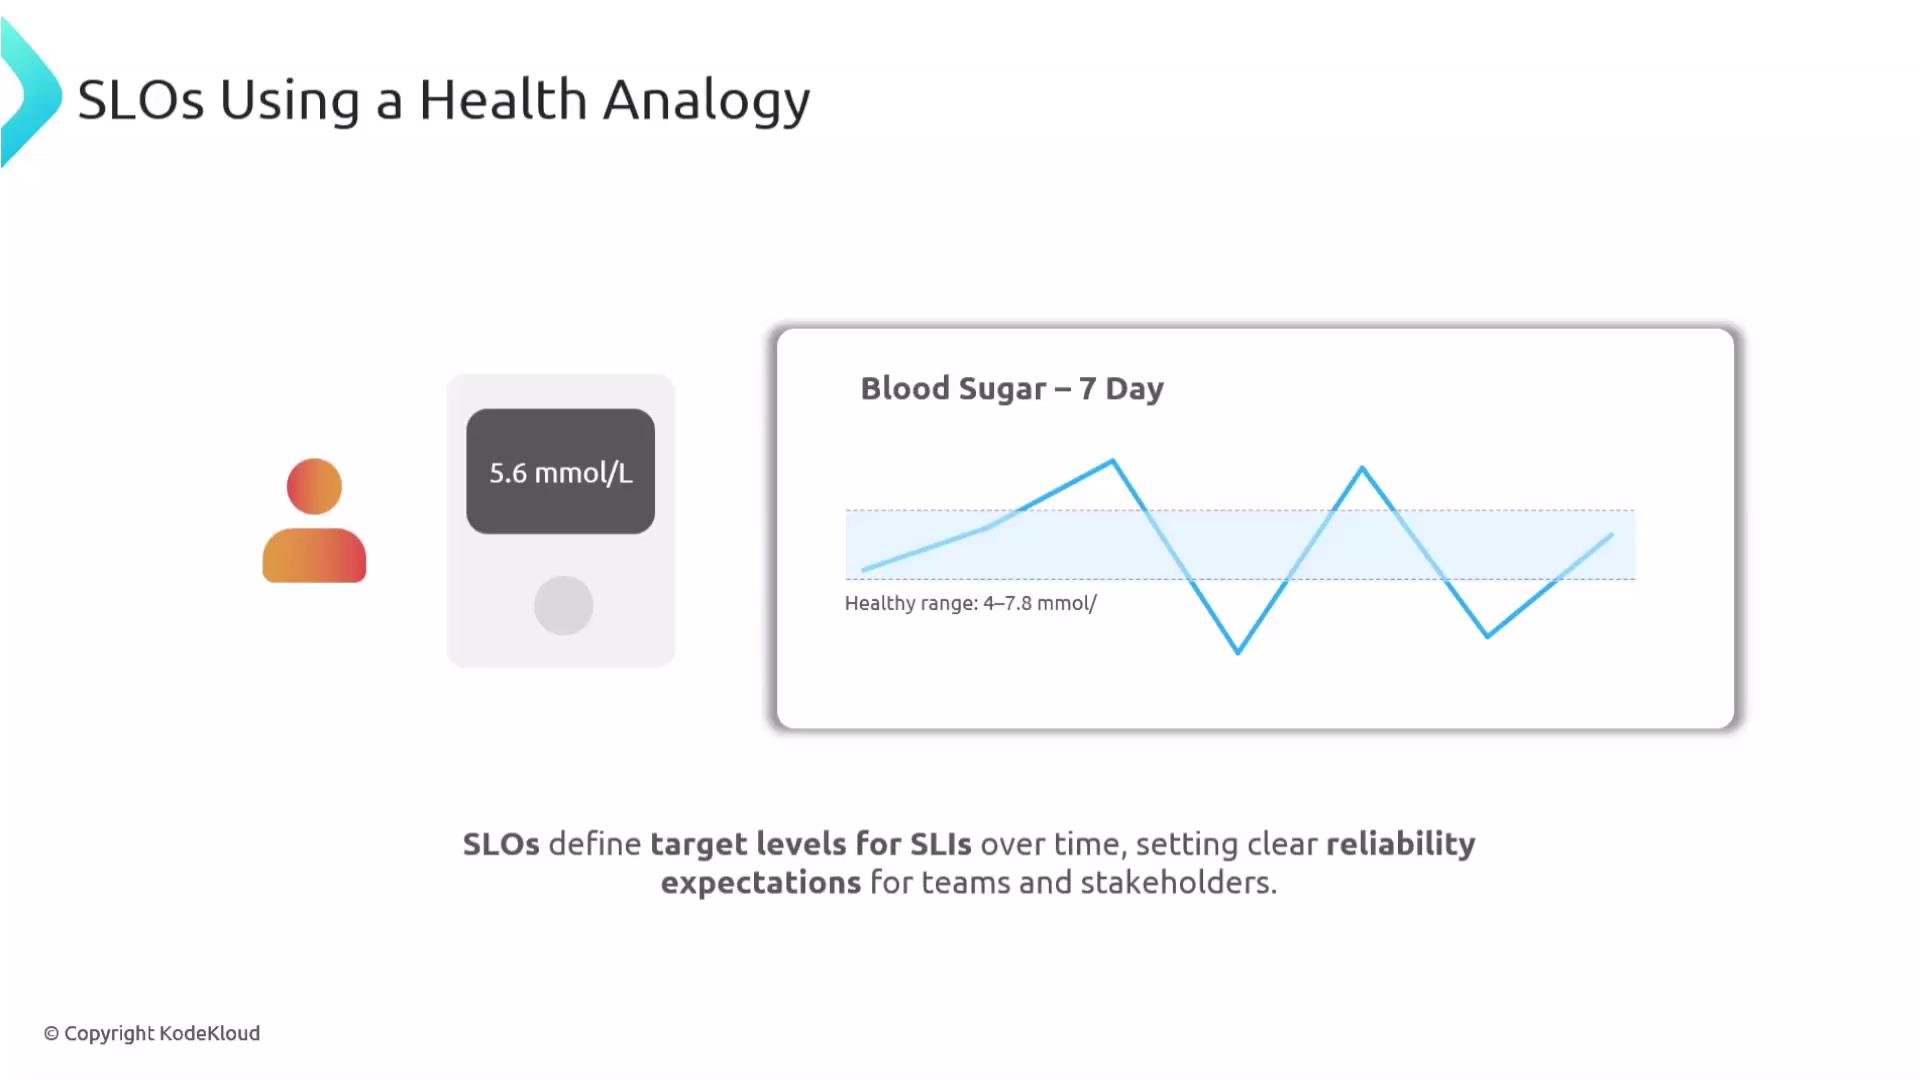
SLO analogy: tracking health metrics Think of SLIs like blood sugar readings and SLOs like the target range you want readings to stay within over time. Individual readings may spike, but the goal is to keep the majority within range over the defined window.
The image uses a health analogy to explain Service Level Objectives (SLOs), illustrating blood sugar levels over a 7-day period within a healthy range of 4–7.8 mmol/L and highlighting a specific reading of 5.6 mmol/L.
Example: latency over time
  • Track latency measurements against an SLO threshold (for example, 200 ms).
  • SLOs commonly allow occasional spikes as long as the overall compliance percentage meets the target (e.g., 99% over 30 days).
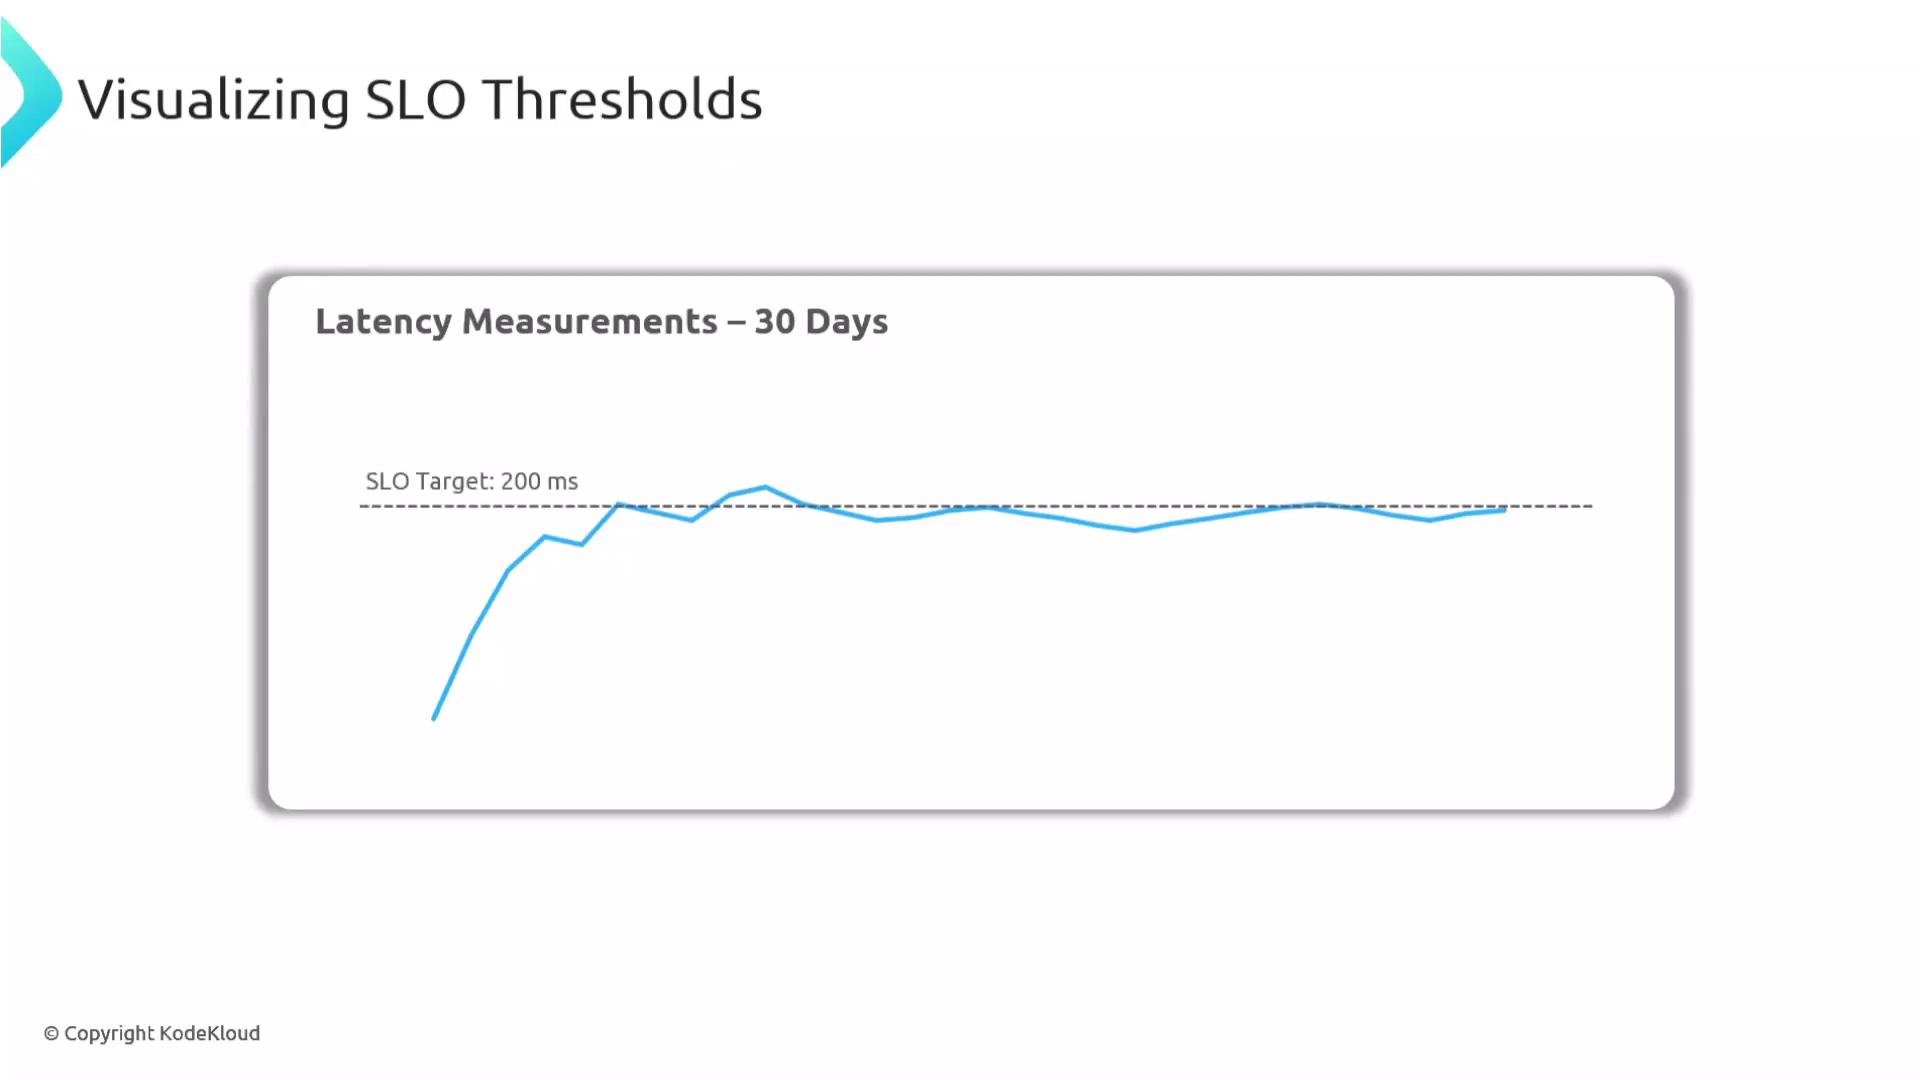
The image shows a line graph titled "Latency Measurements – 30 Days" with a blue line representing latency changes compared to an SLO target of 200 ms.
How OpenTelemetry fits into the SLI/SLO workflow
  • Applications instrumented with OpenTelemetry SDKs generate telemetry (metrics, traces, logs).
  • The OpenTelemetry Collector can receive, preprocess, aggregate, and transform telemetry; it can also convert traces or logs into metrics when appropriate.
  • Data is exported (OTLP or other exporters) to your backend monitoring/SLO platform where SLO evaluation, aggregation over windows, visualization, and alerting occur.
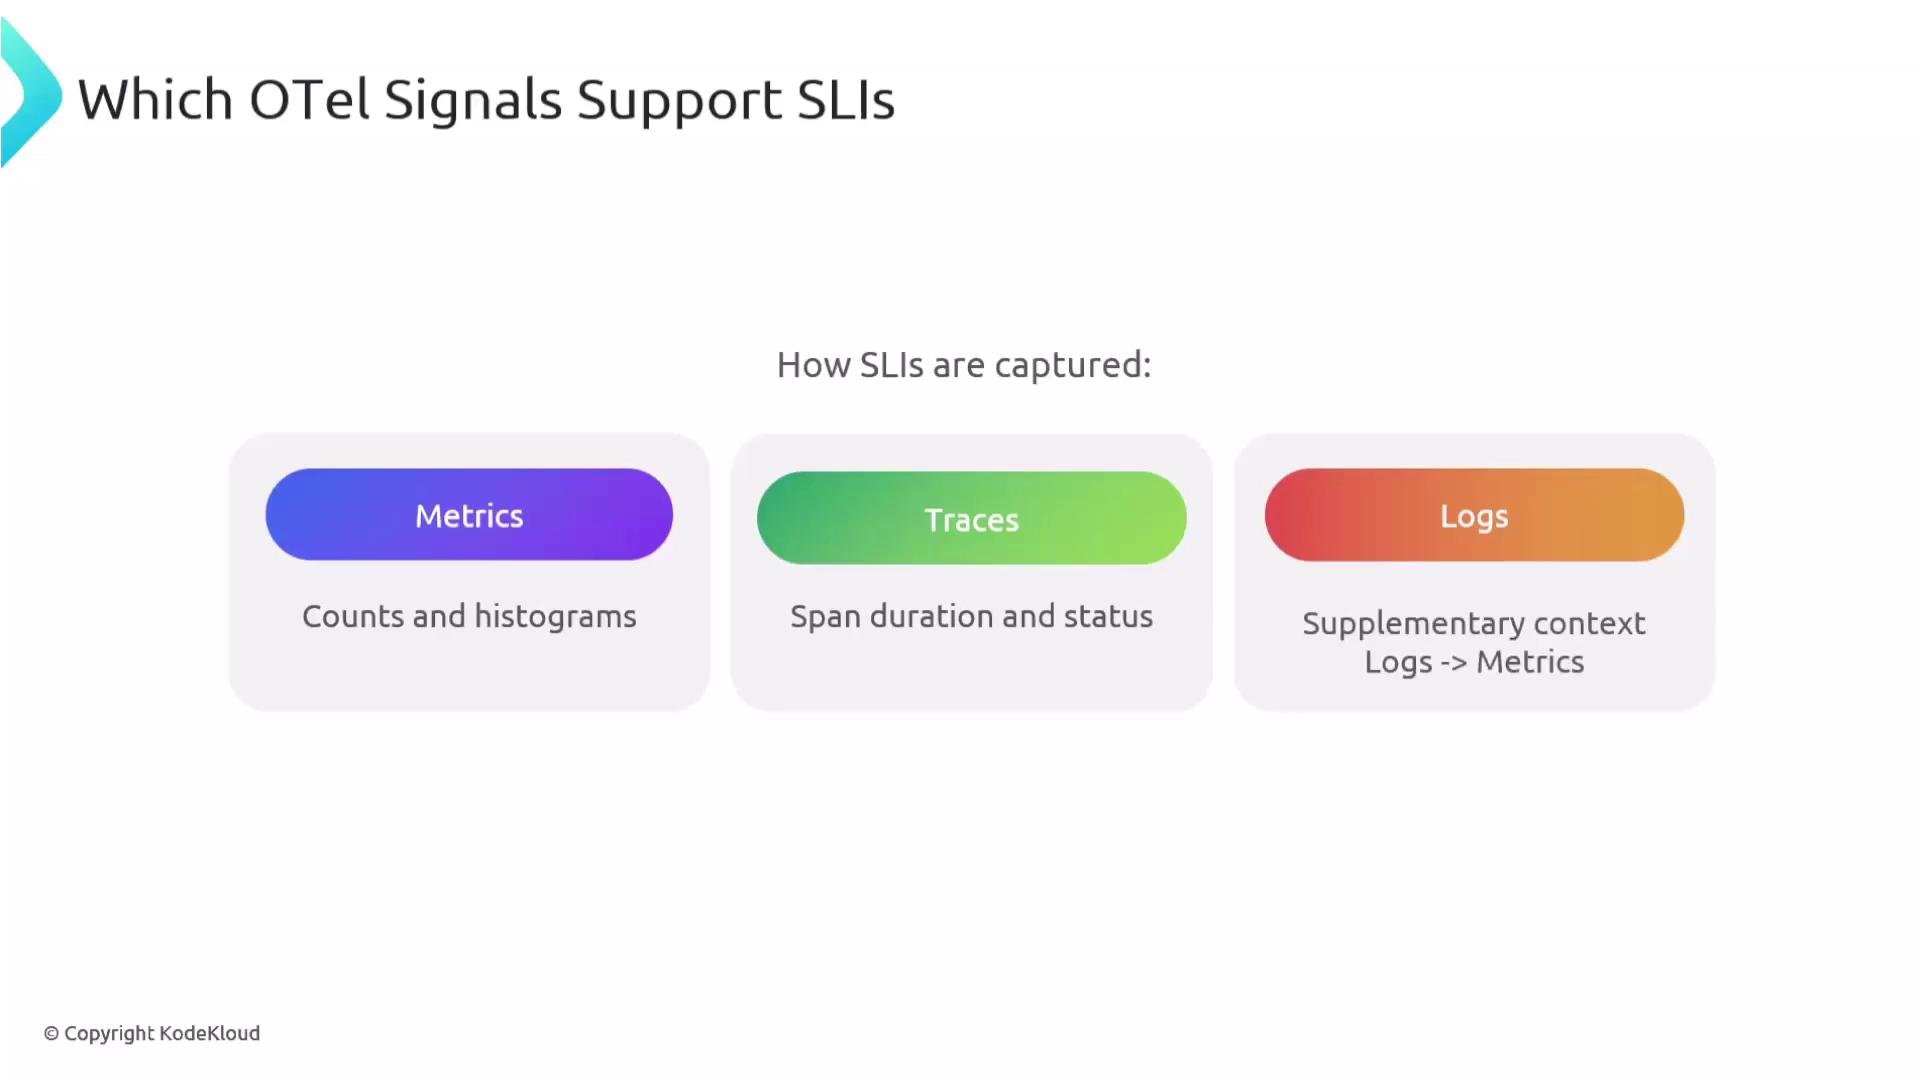
The image shows how OTel signals—metrics, traces, and logs—support SLIs by capturing counts and histograms, span duration and status, and providing supplementary context, respectively.
OpenTelemetry provides standardization and transport for telemetry signals but does not itself enforce or evaluate SLOs. The Collector is useful for routing and preprocessing, but SLO computation and alerting typically happen in your backend or SLO platform.
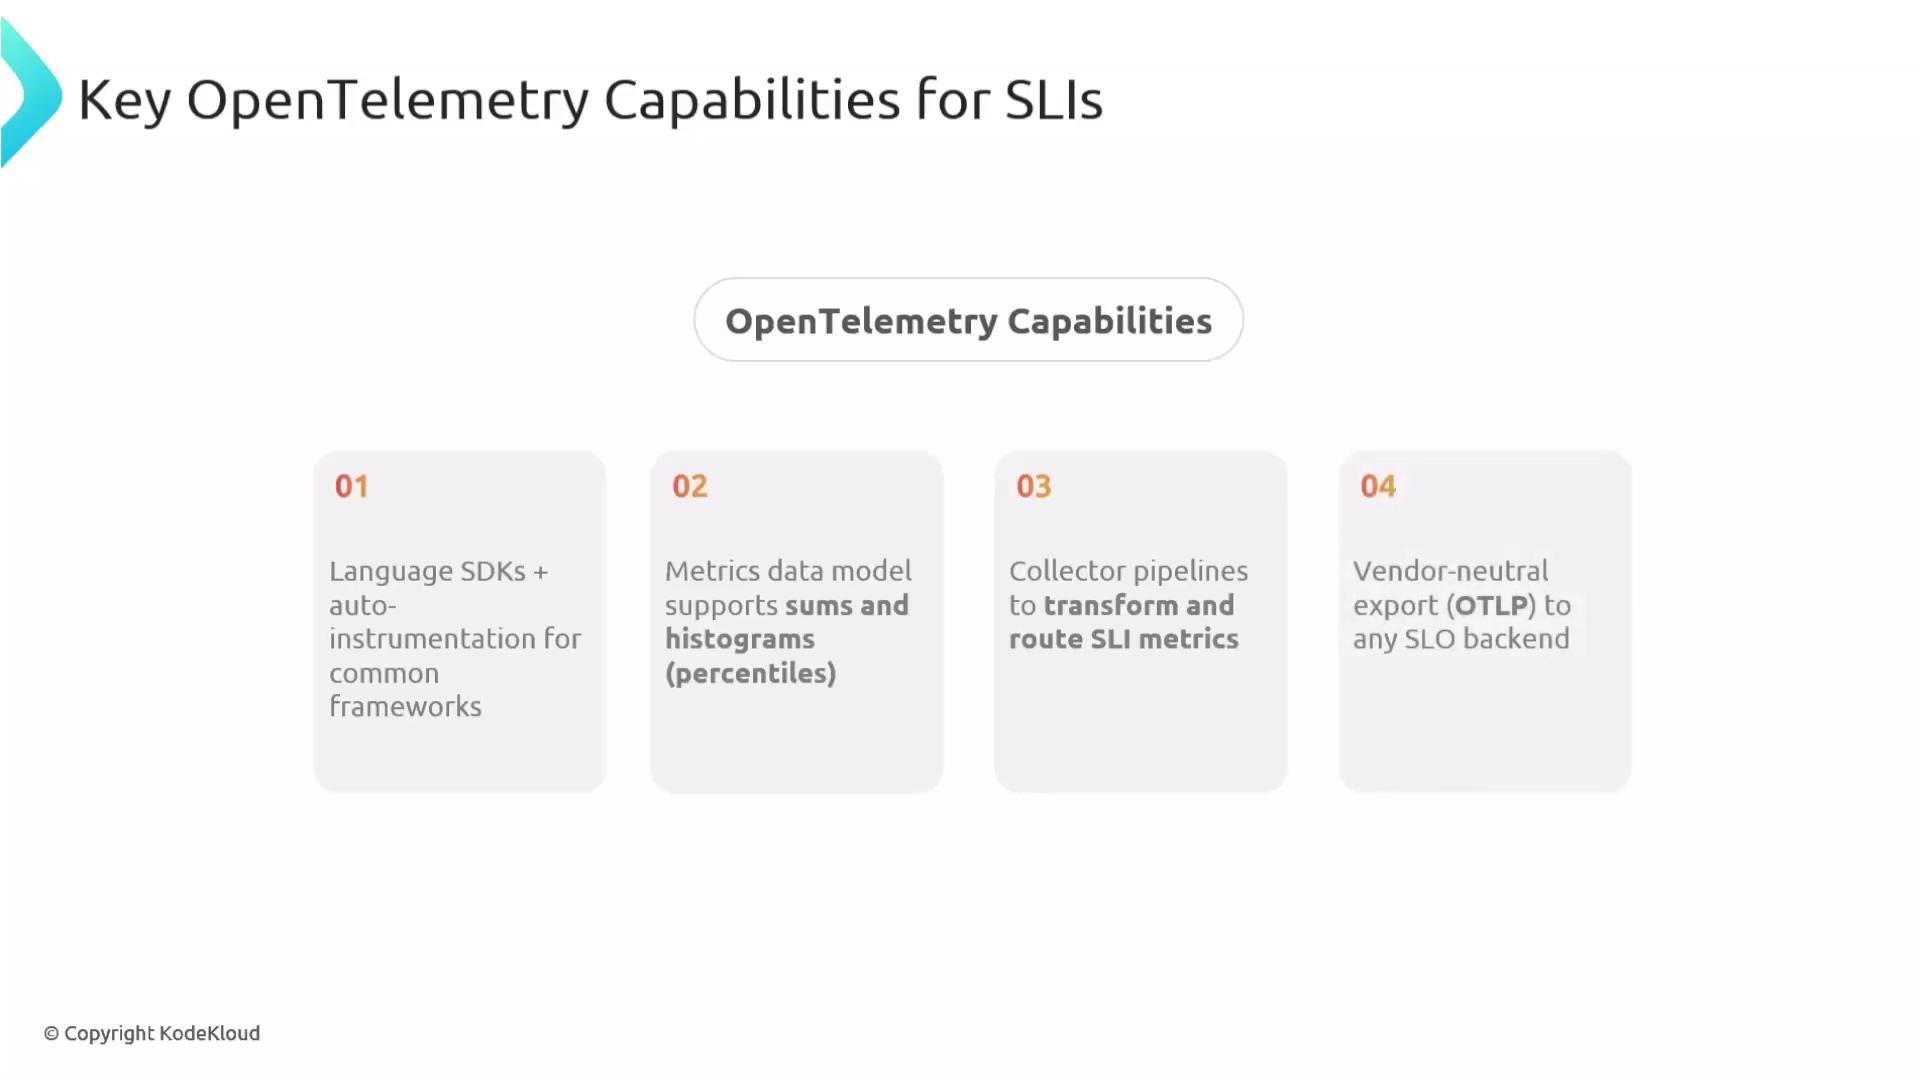
The image lists key OpenTelemetry capabilities for SLIs, including language SDKs, metrics data models, collector pipelines, and vendor-neutral exports.
Division of responsibilities
ComponentResponsibility
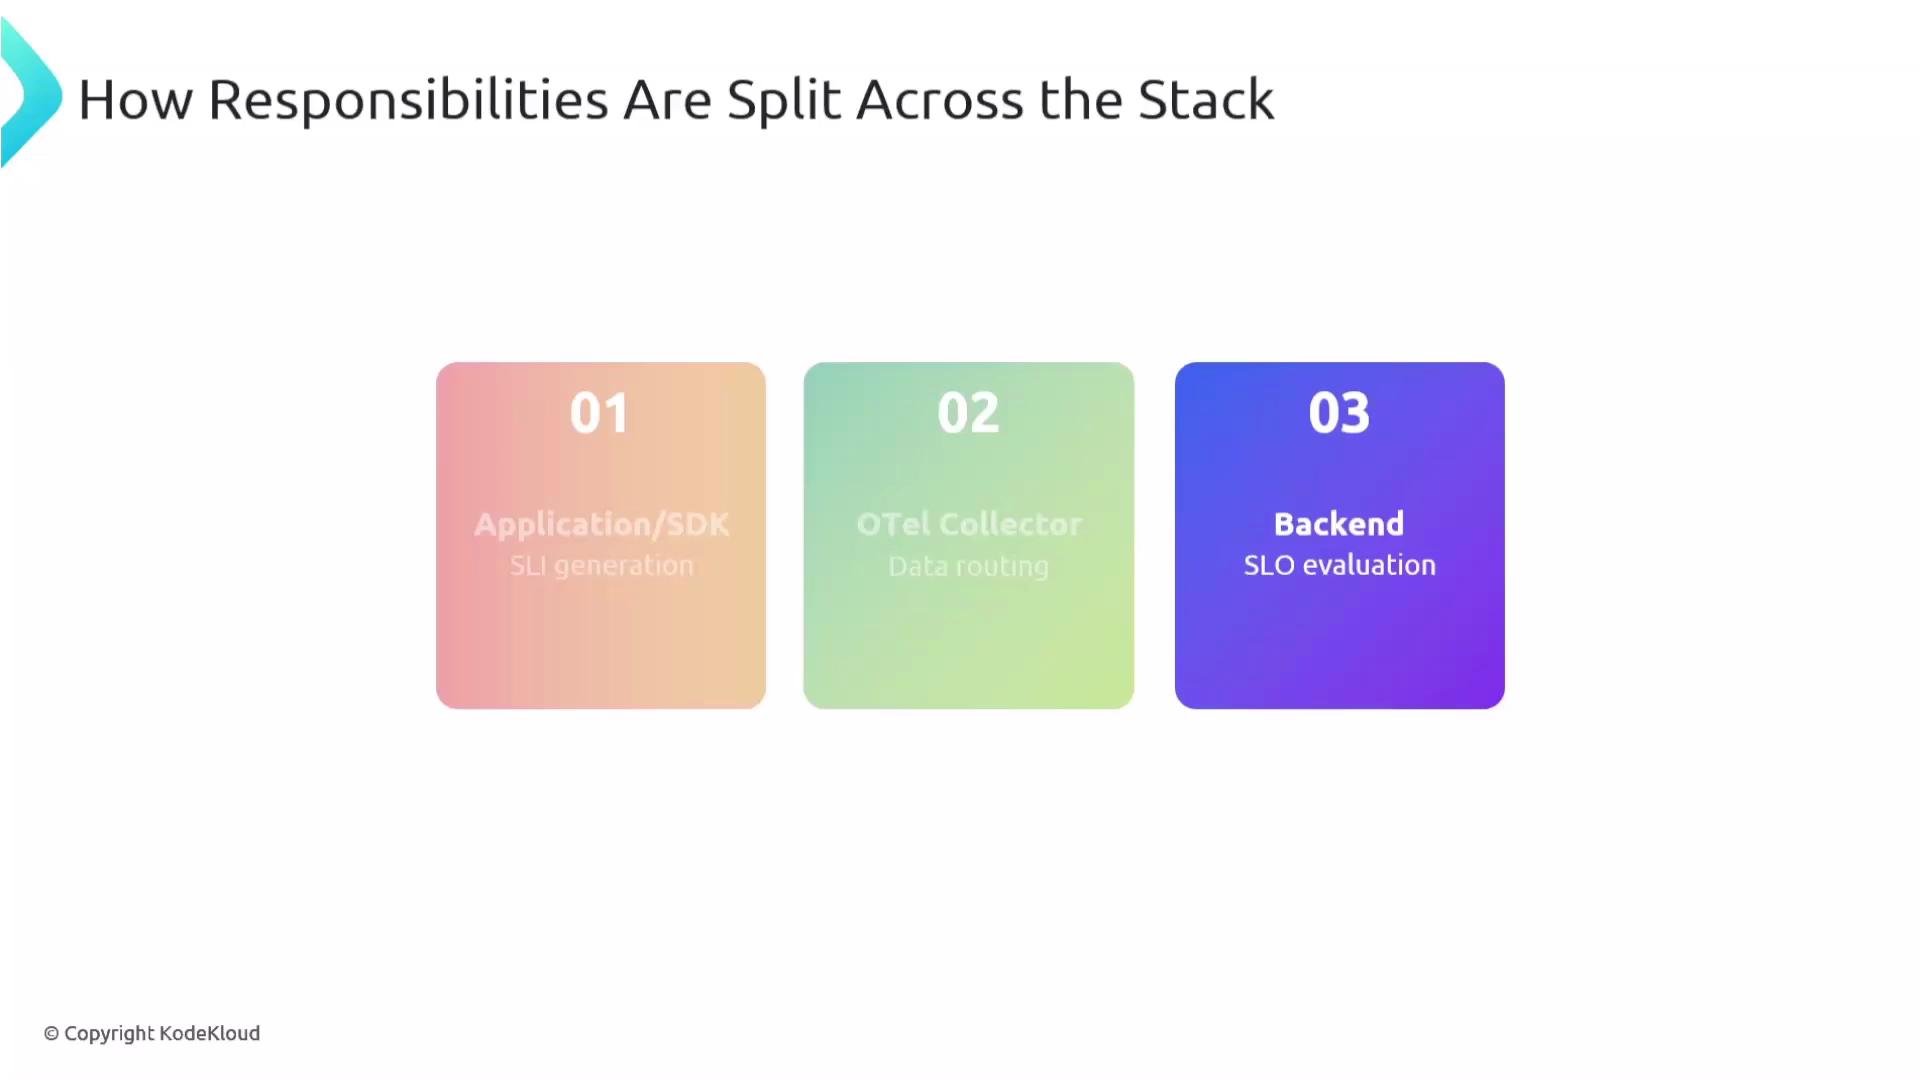
Application / SDKGenerate accurate telemetry (instrument requests, spans, and events)
Collector (optional)Route, transform, pre-aggregate, and convert logs/traces to metrics where helpful
Backend / PlatformCompute SLO compliance over windows, visualize SLOs, and trigger alerts
The image illustrates how responsibilities are divided across the stack in three stages: Application/SDK for SLI generation, OTel Collector for data routing, and Backend for SLO evaluation.
OpenTelemetry does not perform SLO evaluation; it provides the signals that feed into your backend, which performs compliance calculations over the defined time windows.
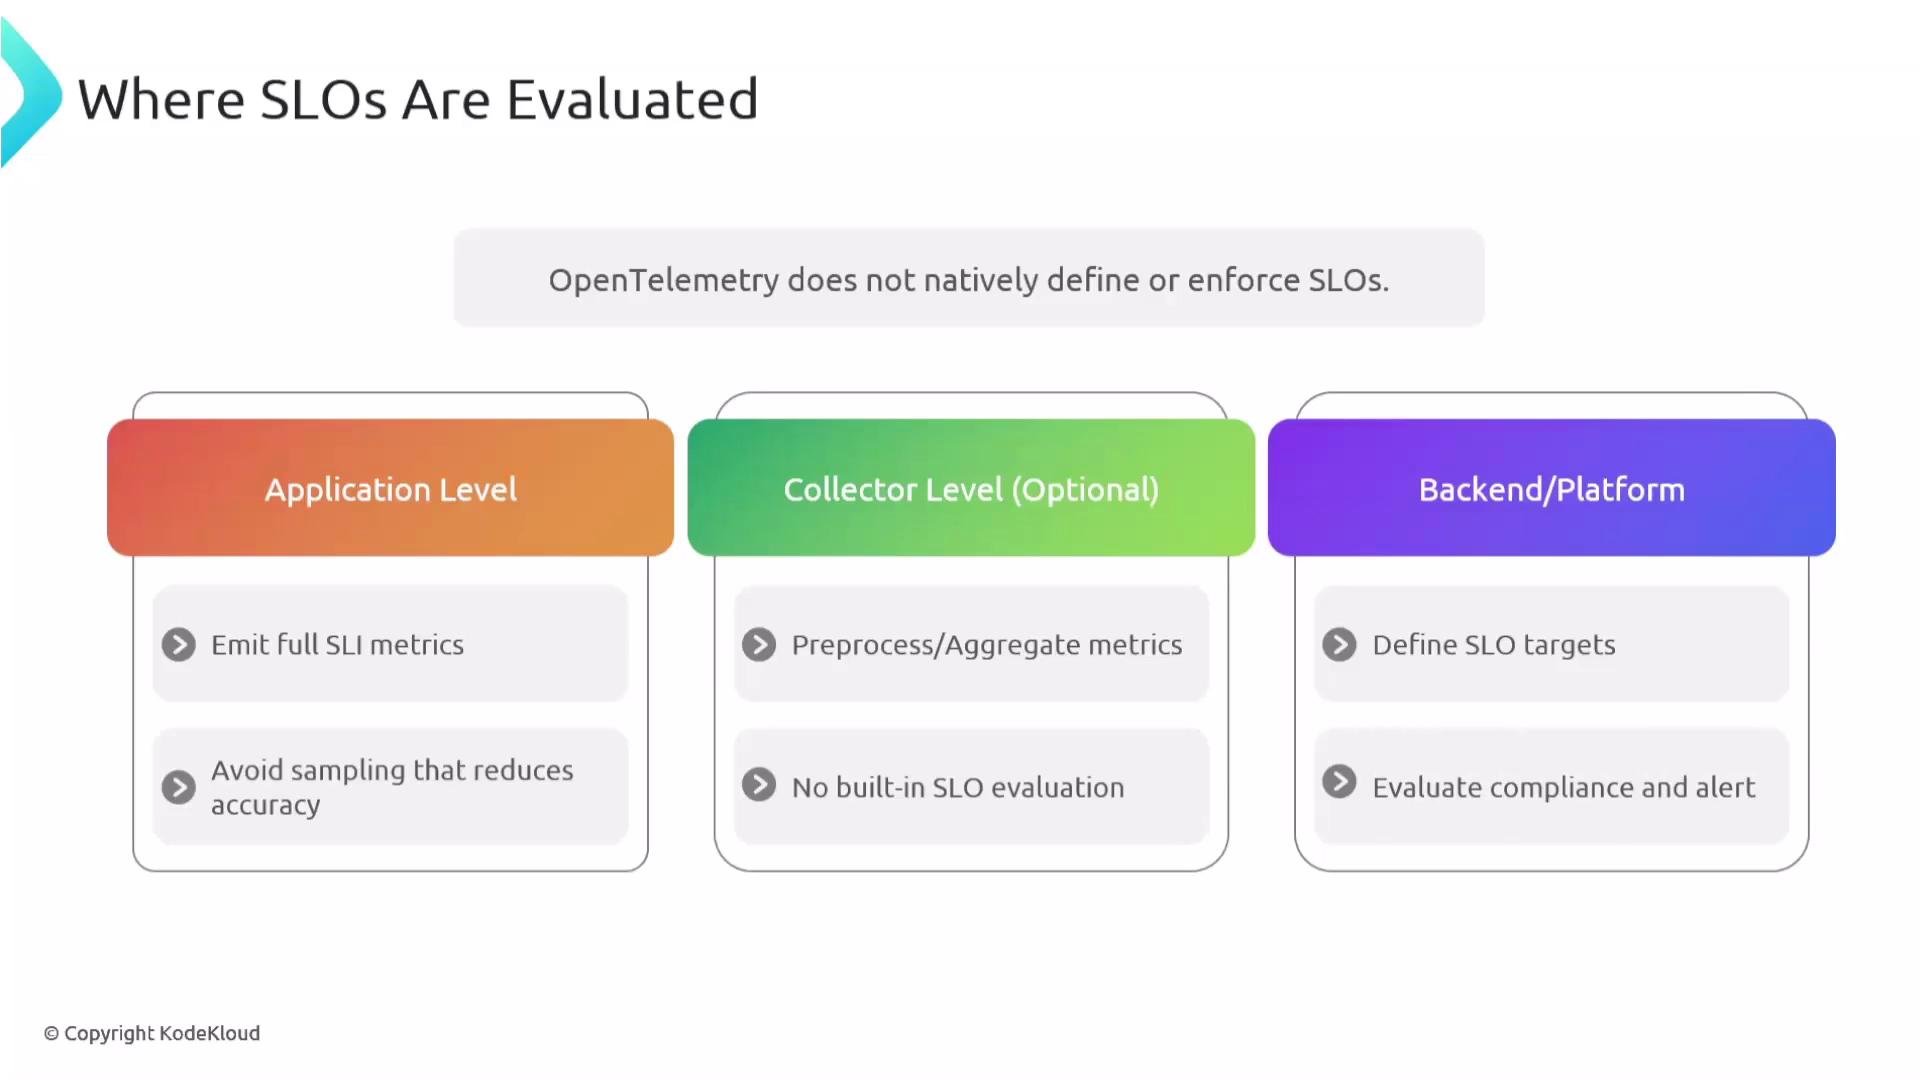
The image outlines where Service Level Objectives (SLOs) are evaluated, divided into three levels: Application, Collector (optional), and Backend/Platform, with specific actions and notes for each level.
Avoid aggressive sampling when generating SLIs. Dropping or heavily sampling requests can reduce SLI accuracy and mask real reliability problems. If sampling is necessary, document its effect on SLI accuracy and consider adjustments in the backend.
Summary
  • SLIs measure user-facing behavior (latency, success rate, errors, throughput) and should be defined from the user’s perspective.
  • SLOs are time-windowed targets applied to SLIs (e.g., 99% of requests under 200 ms over 30 days).
  • OpenTelemetry standardizes and transports telemetry (metrics, traces, logs) to your backend — but SLO evaluation, rolling-window calculations, visualization, and alerting are responsibilities of your monitoring/SLO platform.
  • Be cautious with sampling: it can undermine SLI accuracy if not managed carefully.
Further reading and references

Watch Video