

- Java (JVM): attach the OpenTelemetry Java agent when starting the JVM:
- Python: use the OpenTelemetry CLI wrapper to instrument supported libraries at runtime:
app.py.
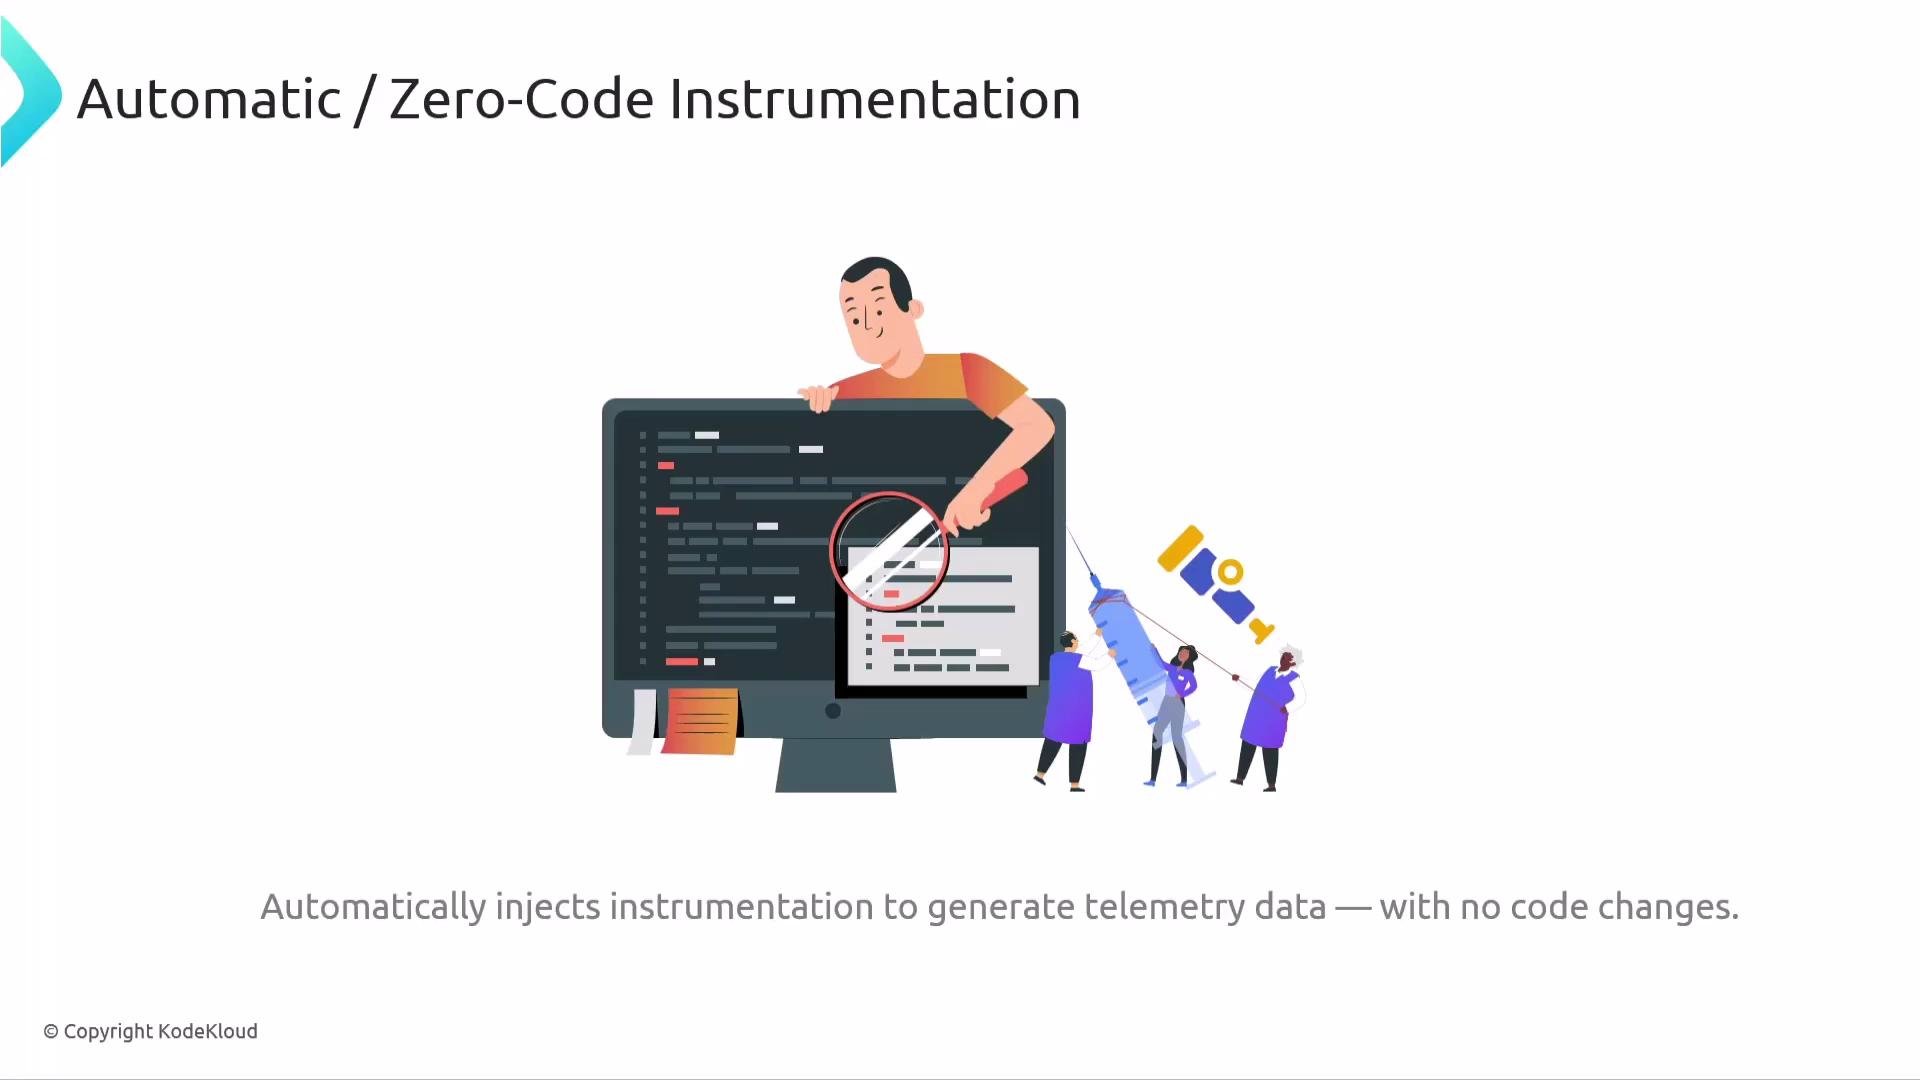
Both examples turn an existing application into a telemetry-producing source with no code edits. This makes automatic instrumentation a fast way to add observability—often in minutes.
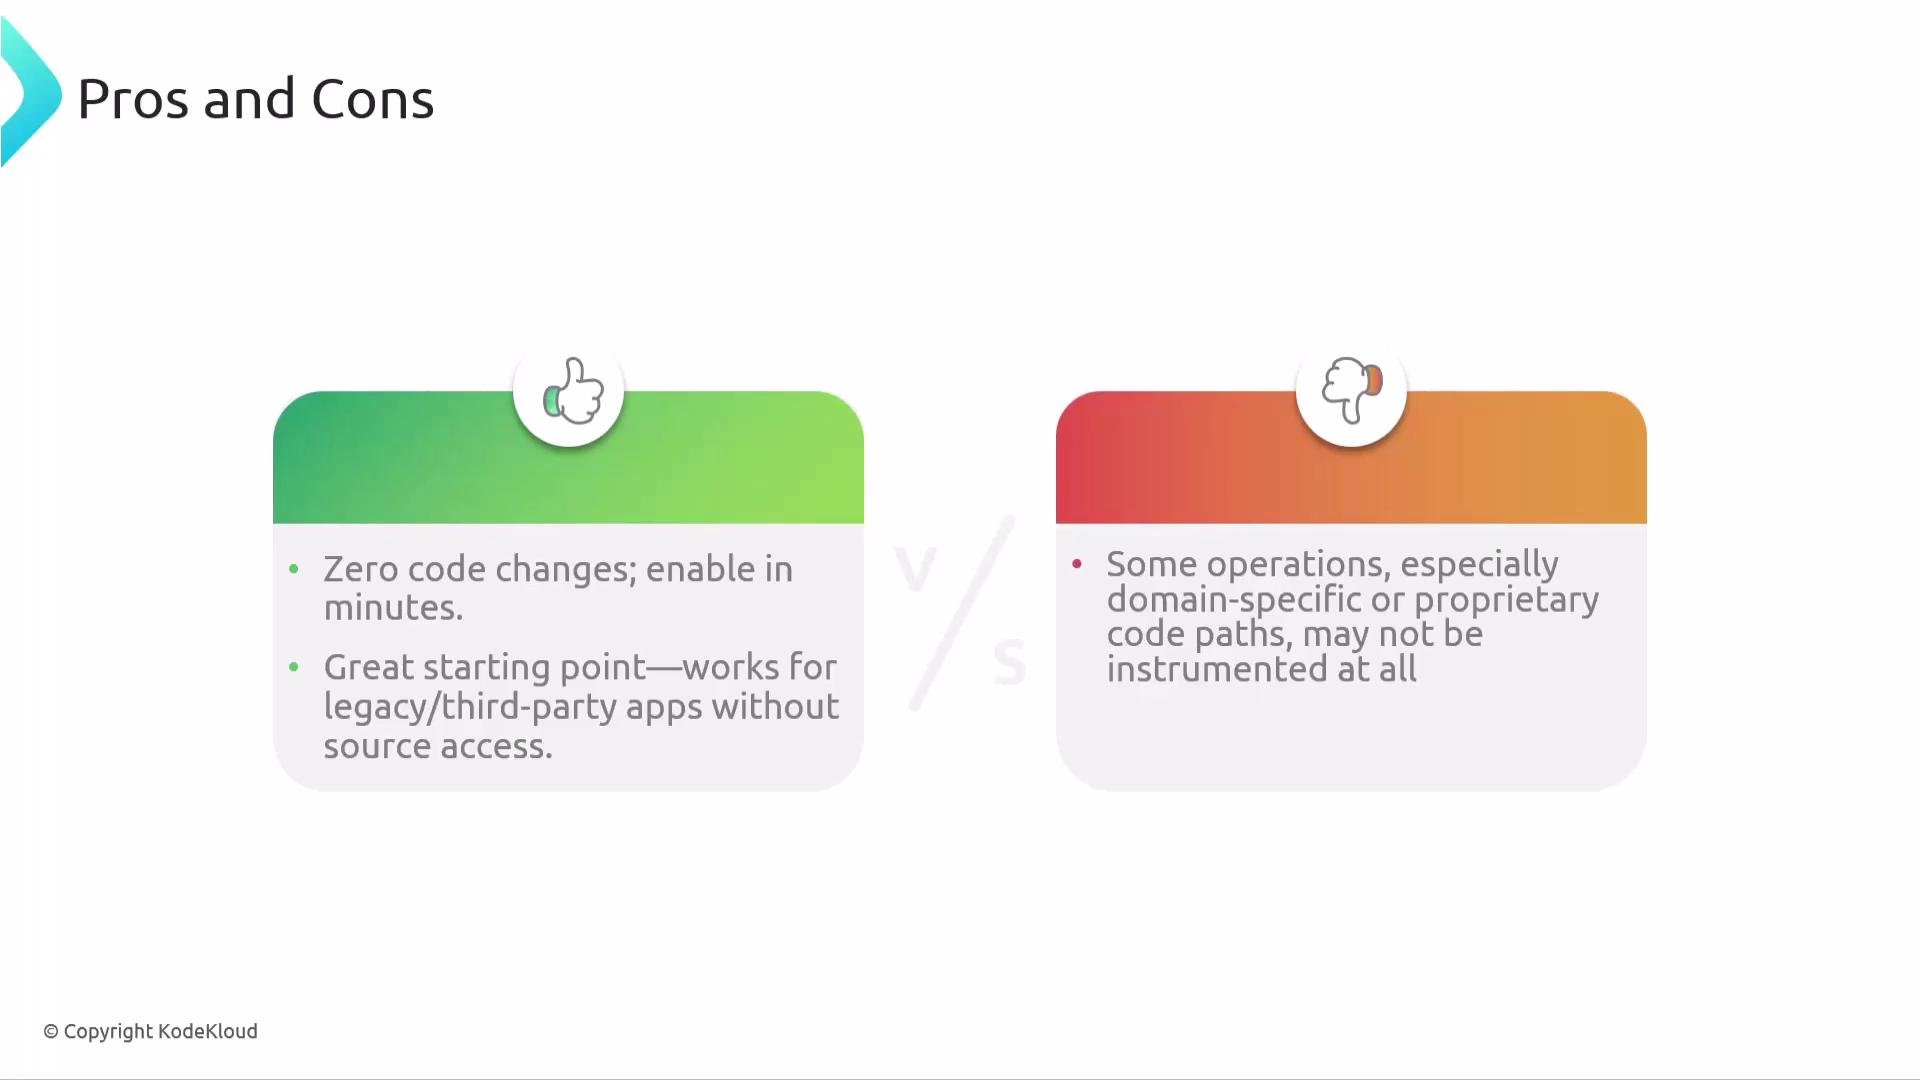
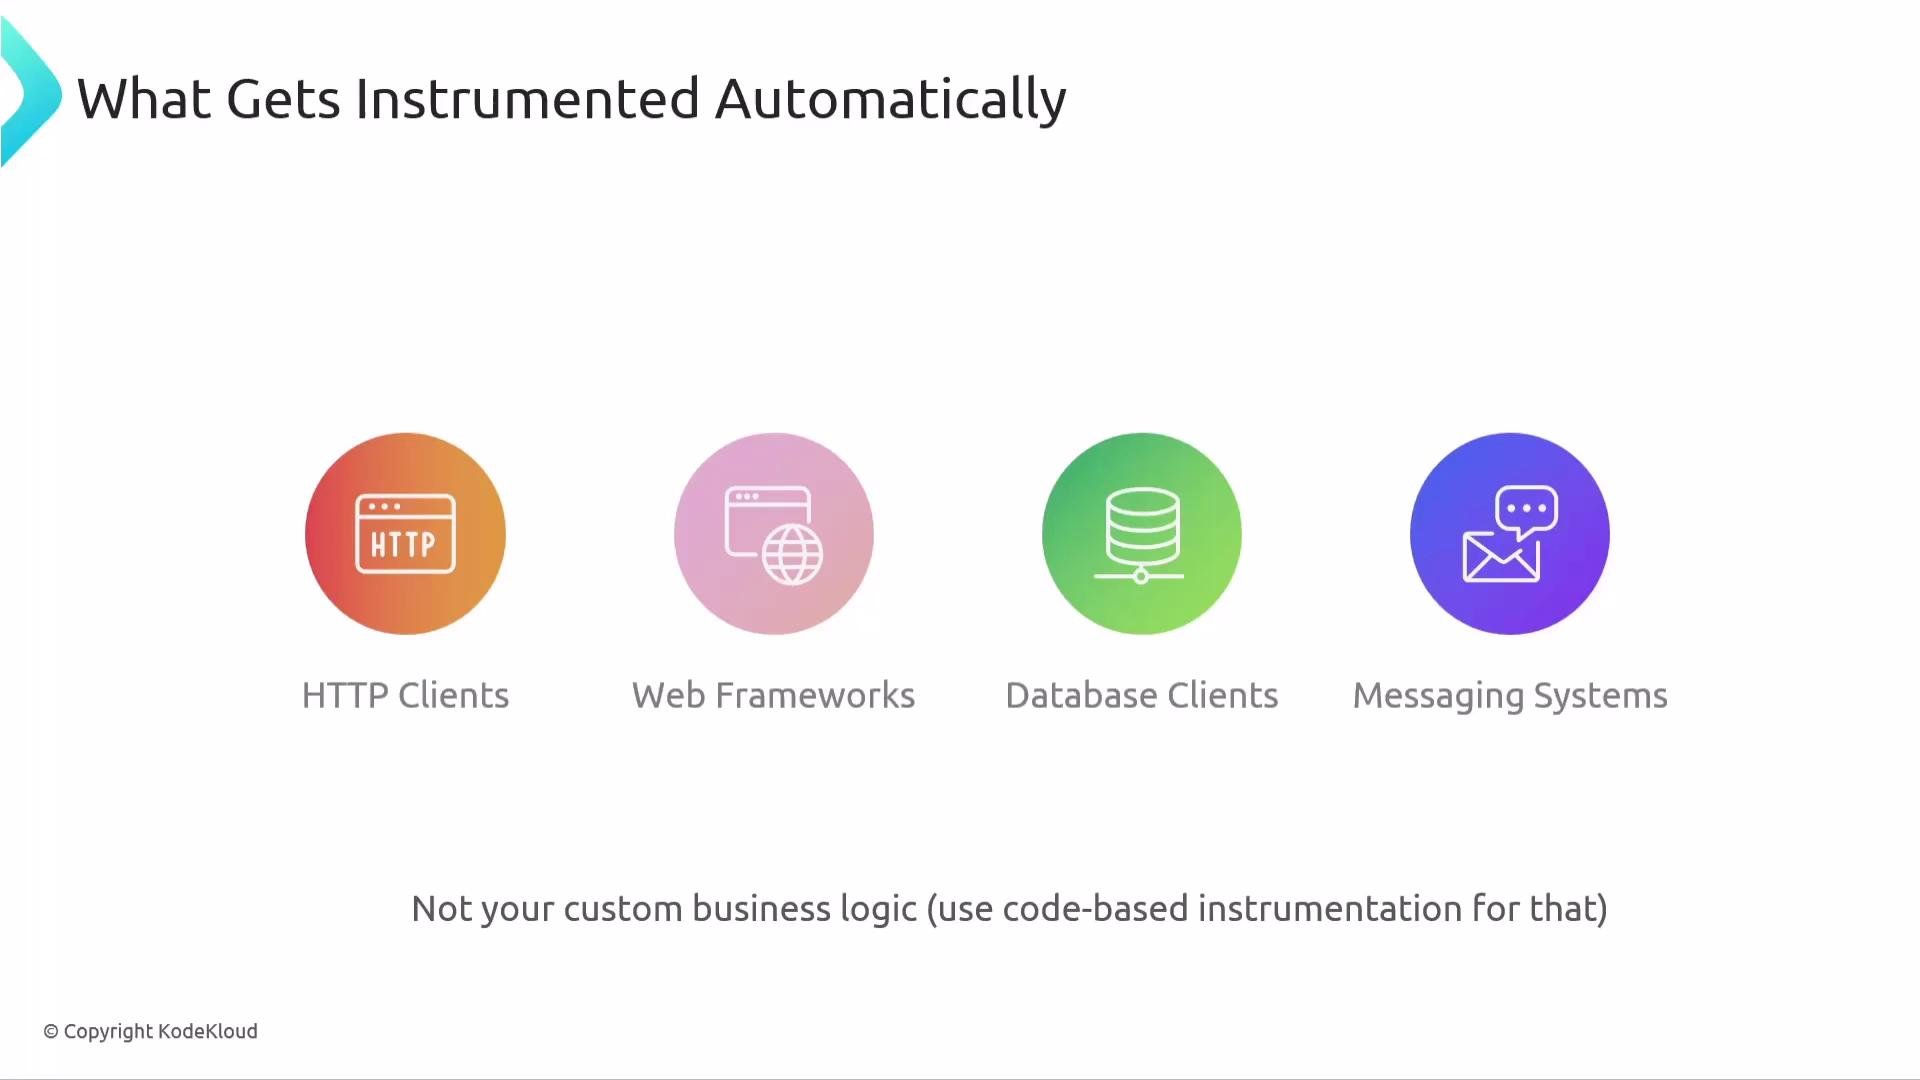
The main advantage is speed: enable it quickly without touching the code. It’s ideal for legacy apps, third-party binaries, or environments where developers cannot modify source. The trade-off is that domain-specific or business-logic spans are generally not created automatically; automatic instrumentation covers widely used frameworks and libraries but cannot infer custom business operations.
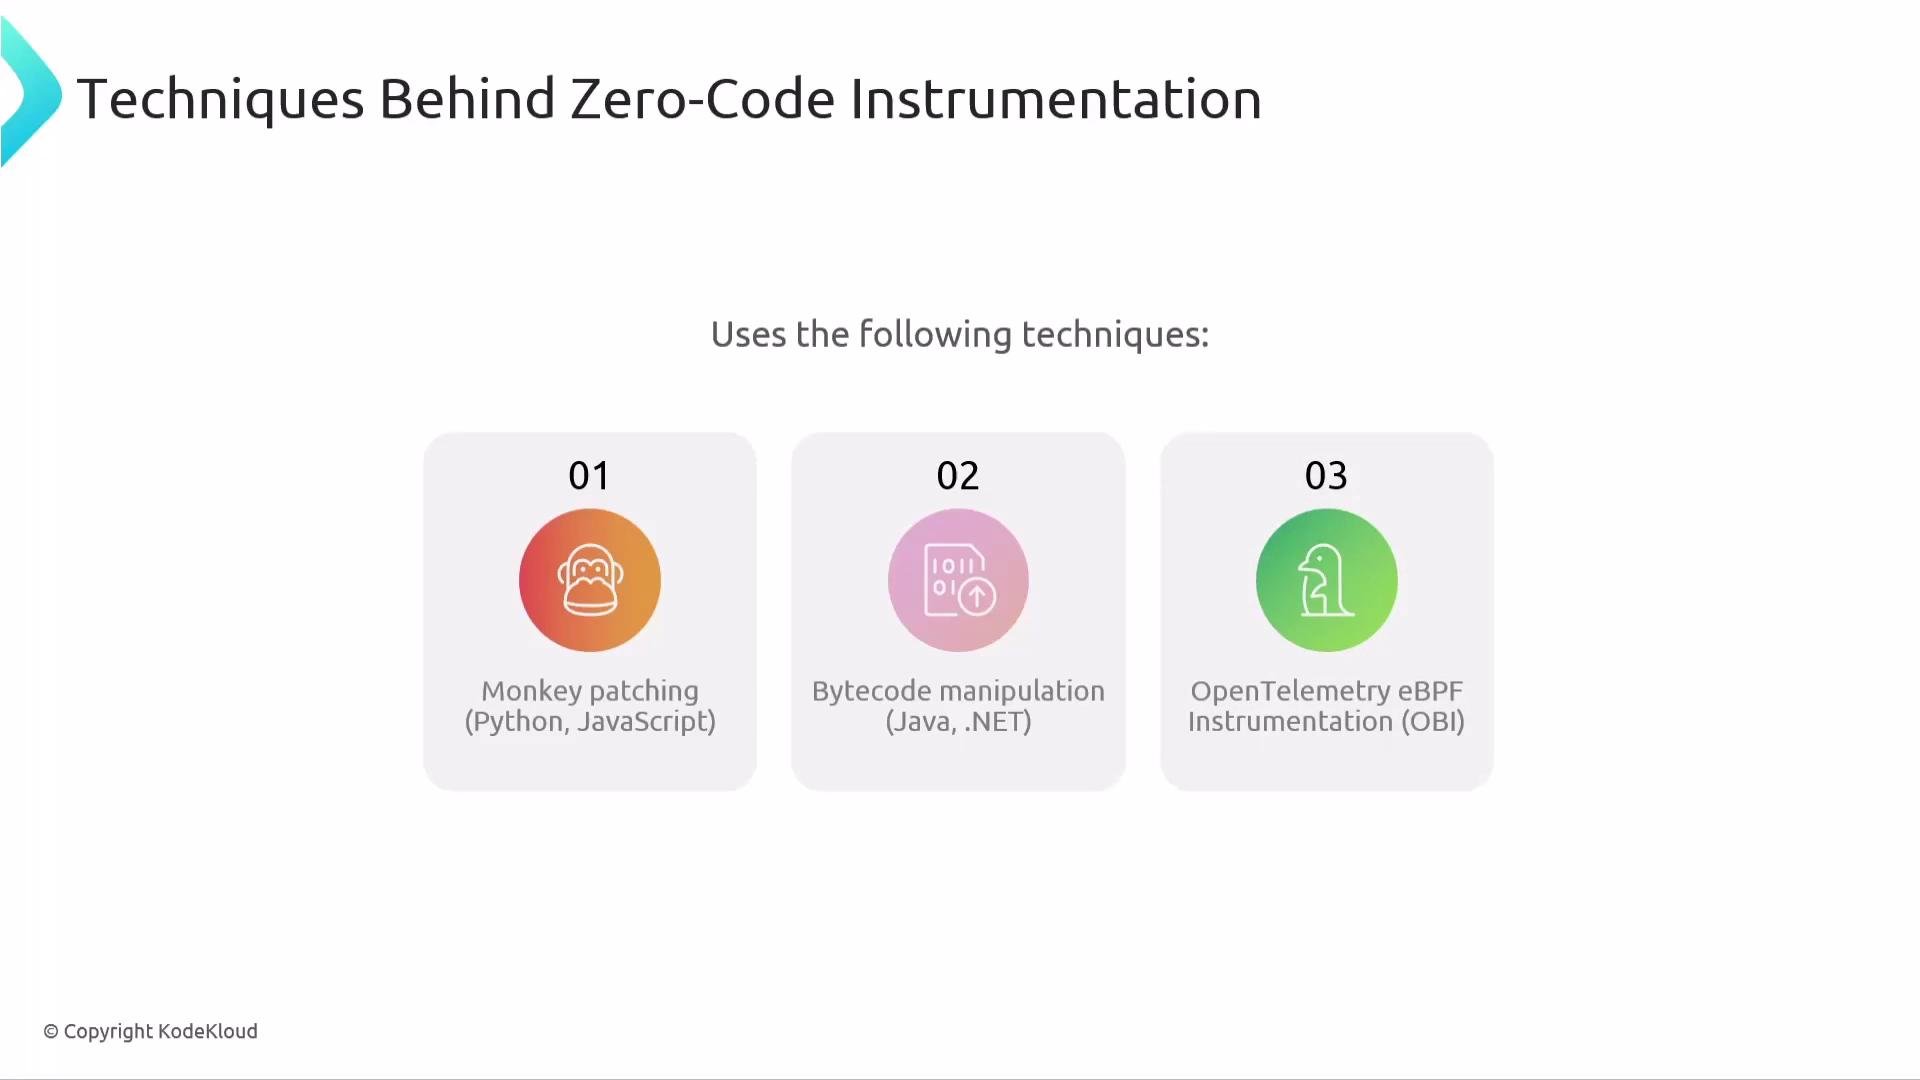
- Monkey patching: used in dynamic languages such as Python and JavaScript. At runtime, the agent replaces or wraps library functions to call telemetry APIs.
- Bytecode manipulation: used in statically compiled runtimes such as Java and .NET. The agent modifies bytecode as classes/assemblies are loaded to insert telemetry before/after method execution.
- eBPF-based instrumentation: OpenTelemetry’s eBPF initiative observes system-level events (network, syscalls) from the kernel, providing language-agnostic and non-intrusive telemetry—useful in containerized or polyglot environments (see https://github.com/open-telemetry/opentelemetry-ebpf).
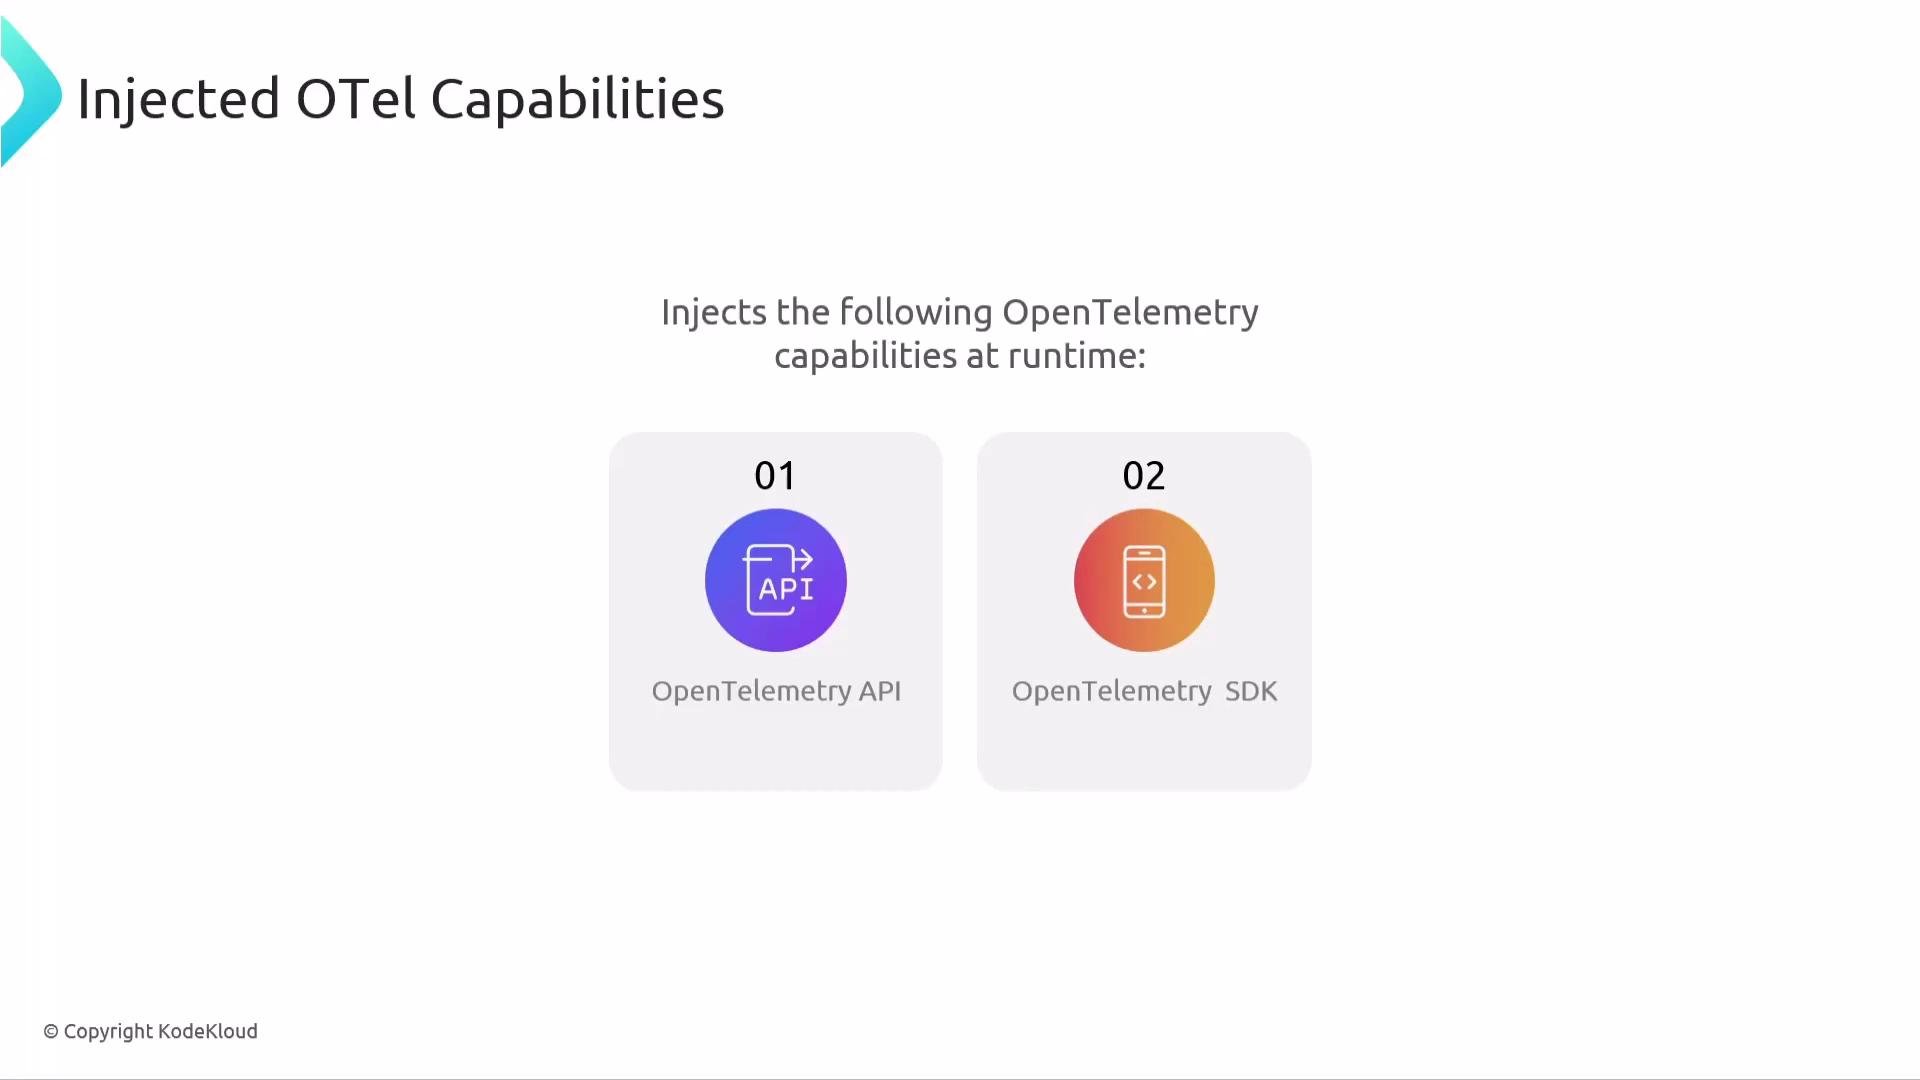
Automatic instrumentation usually does not capture application-specific business logic—those spans must be added with code-based instrumentation if you need fine-grained, domain-specific traces.
- Environment variables (most common)
- System properties (common for Java/.NET)
- Startup arguments (runtime customization)
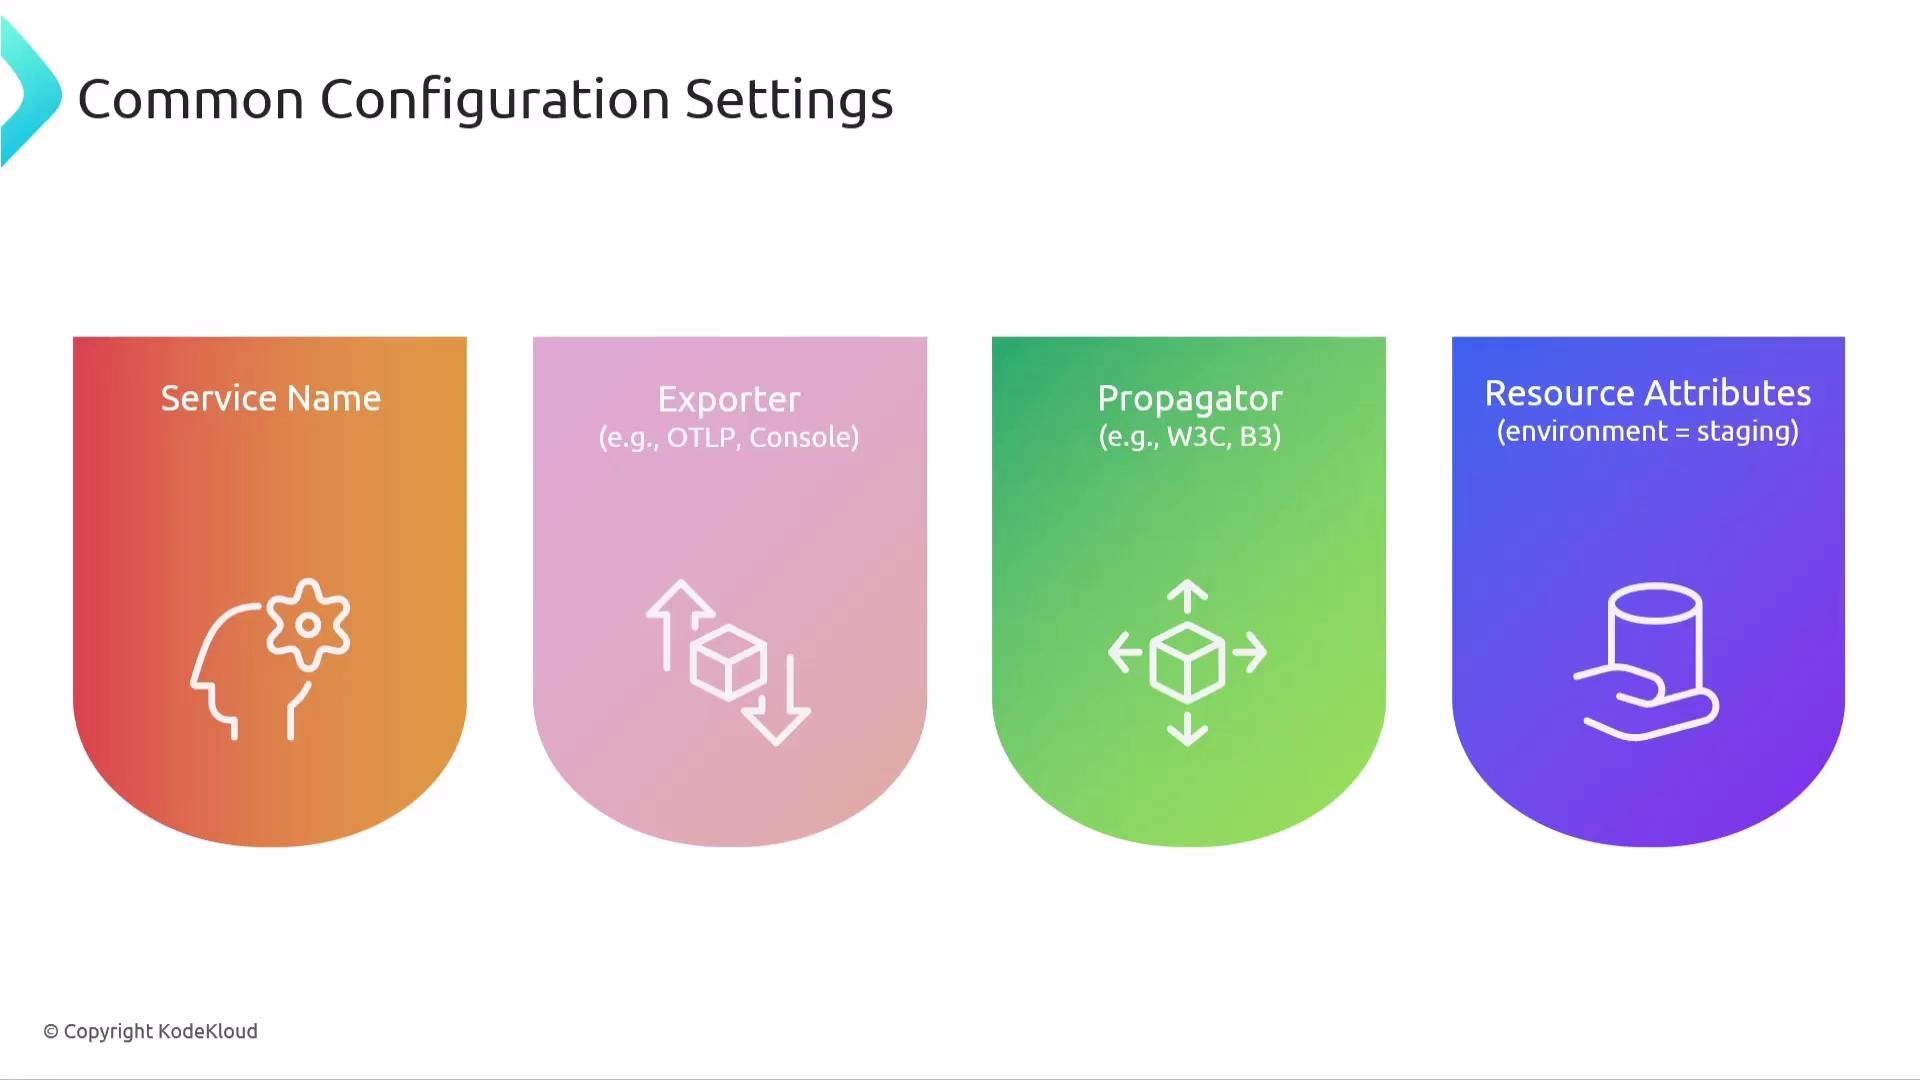
- Service name (so traces are grouped under a logical service in your observability backend)
- Exporter (OTLP, console, etc.)
- Propagators (W3C trace-context, B3)
- Resource attributes (environment, region, team, etc.)
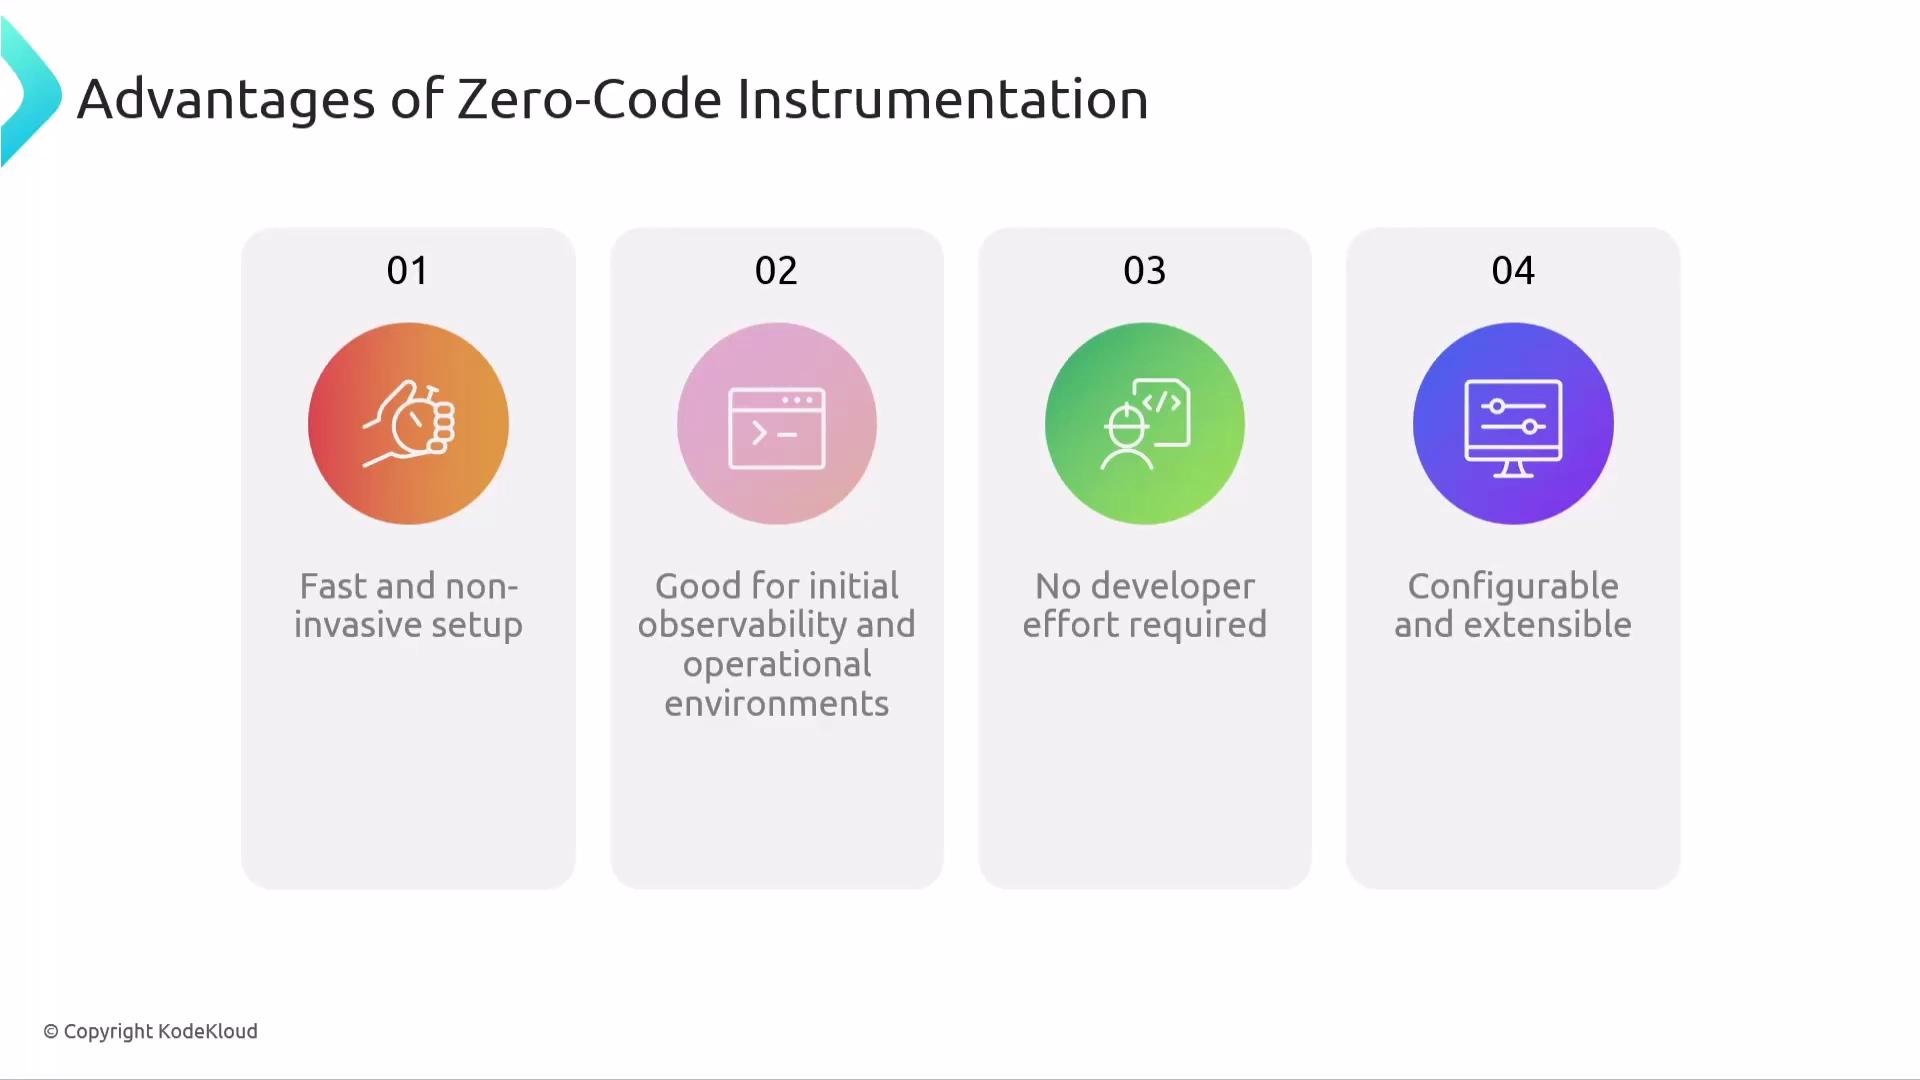
- Fast and non-invasive: enables telemetry quickly without code changes.
- Great for initial observability: provides immediate visibility into production systems.
- Low developer effort: only change how the app is started or its runtime environment.
- Configurable and extensible: environment variables and startup options let you tailor behavior.
Zero-code instrumentation is an excellent first step for gaining observability quickly. Use it to get baseline telemetry, then add code-based instrumentation selectively where you need domain-specific traces or richer context.
- OpenTelemetry: https://opentelemetry.io/
- OpenTelemetry eBPF project: https://github.com/open-telemetry/opentelemetry-ebpf