This guide shows how to configure an OpenTelemetry Collector to export traces to Jaeger using OTLP, run both the Collector and Jaeger locally with Docker Compose, and generate test telemetry to verify traces appear in the Jaeger UI. What you’ll see here:
  • Overview of Collector core components
  • Minimal Collector config that prints telemetry to console
  • Docker Compose to run Collector + Jaeger locally
  • Collector configuration updated to export to Jaeger via OTLP
  • Commands to run the stack and generate telemetry
  • Verification steps in Jaeger UI
OpenTelemetry Collector core components
  • receivers: how the collector receives telemetry from applications
  • processors: how the collector processes telemetry
  • exporters: where the collector forwards telemetry for storage/analysis
  • service pipelines: connect receivers → processors → exporters (configurable per-signal: traces, metrics, logs)
Minimal Collector configuration (OTLP receiver + debug exporter) This minimal config accepts OTLP and prints received telemetry to the console via the debug exporter:
Wire the Collector to Jaeger In this lesson we’ll send traces to Jaeger so they are stored and viewable in the Jaeger UI. We’ll run Jaeger’s all-in-one image and configure the Collector to export traces to Jaeger over OTLP. Docker Compose (recommended local stack) Use this Docker Compose fragment to run the Collector and Jaeger on a shared Compose network. The Collector reads OTLP on 4317 (gRPC) and 4318 (HTTP). Jaeger supports OTLP ingest and listens on its OTLP gRPC port (exposed here for convenience).
Ports summary
ServicePurposePort(s)
Collector OTLPOTLP ingest from apps (gRPC / HTTP)4317 / 4318
Jaeger UIWeb UI to view traces16686
Jaeger OTLP/gRPCJaeger ingest endpoints14250
Jaeger agent (UDP)Thrift-based agent ports6831/udp, 6832/udp
Notes
  • When running both services in Docker Compose the Collector can reach Jaeger at jaeger:4317 (the Compose service name resolves on the network).
  • You do not have to expose port 4317 to the host unless you need external access to Jaeger’s OTLP port.
Update the Collector configuration to export to Jaeger Because you may have multiple OTLP exporters (to different backends), give each OTLP exporter a unique name using the otlp/<name> pattern. The example below defines otlp/jaeger and retains the console debug exporter:
When you require multiple OTLP exporters (for example, one to Jaeger and another to a different backend), name them like otlp/jaeger and otlp/backend2. Use those exact names in your pipeline exporter lists.
Start and stop the Compose stack Start the stack in detached mode:
Stop and remove containers:
Generate test telemetry Use the telemetrygen tool to send sample traces and logs to the Collector over OTLP HTTP. Example:
Sample trimmed output (telemetrygen and Collector logs) when sending traces and logs:
Collector console (debug exporter) output will include received span details, for example:
Verification in Jaeger
  • Open the Jaeger UI: http://localhost:16686
  • Under “Services” find your service (for example, telemetrygen)
  • Click “Find Traces” to view the traces exported by the Collector
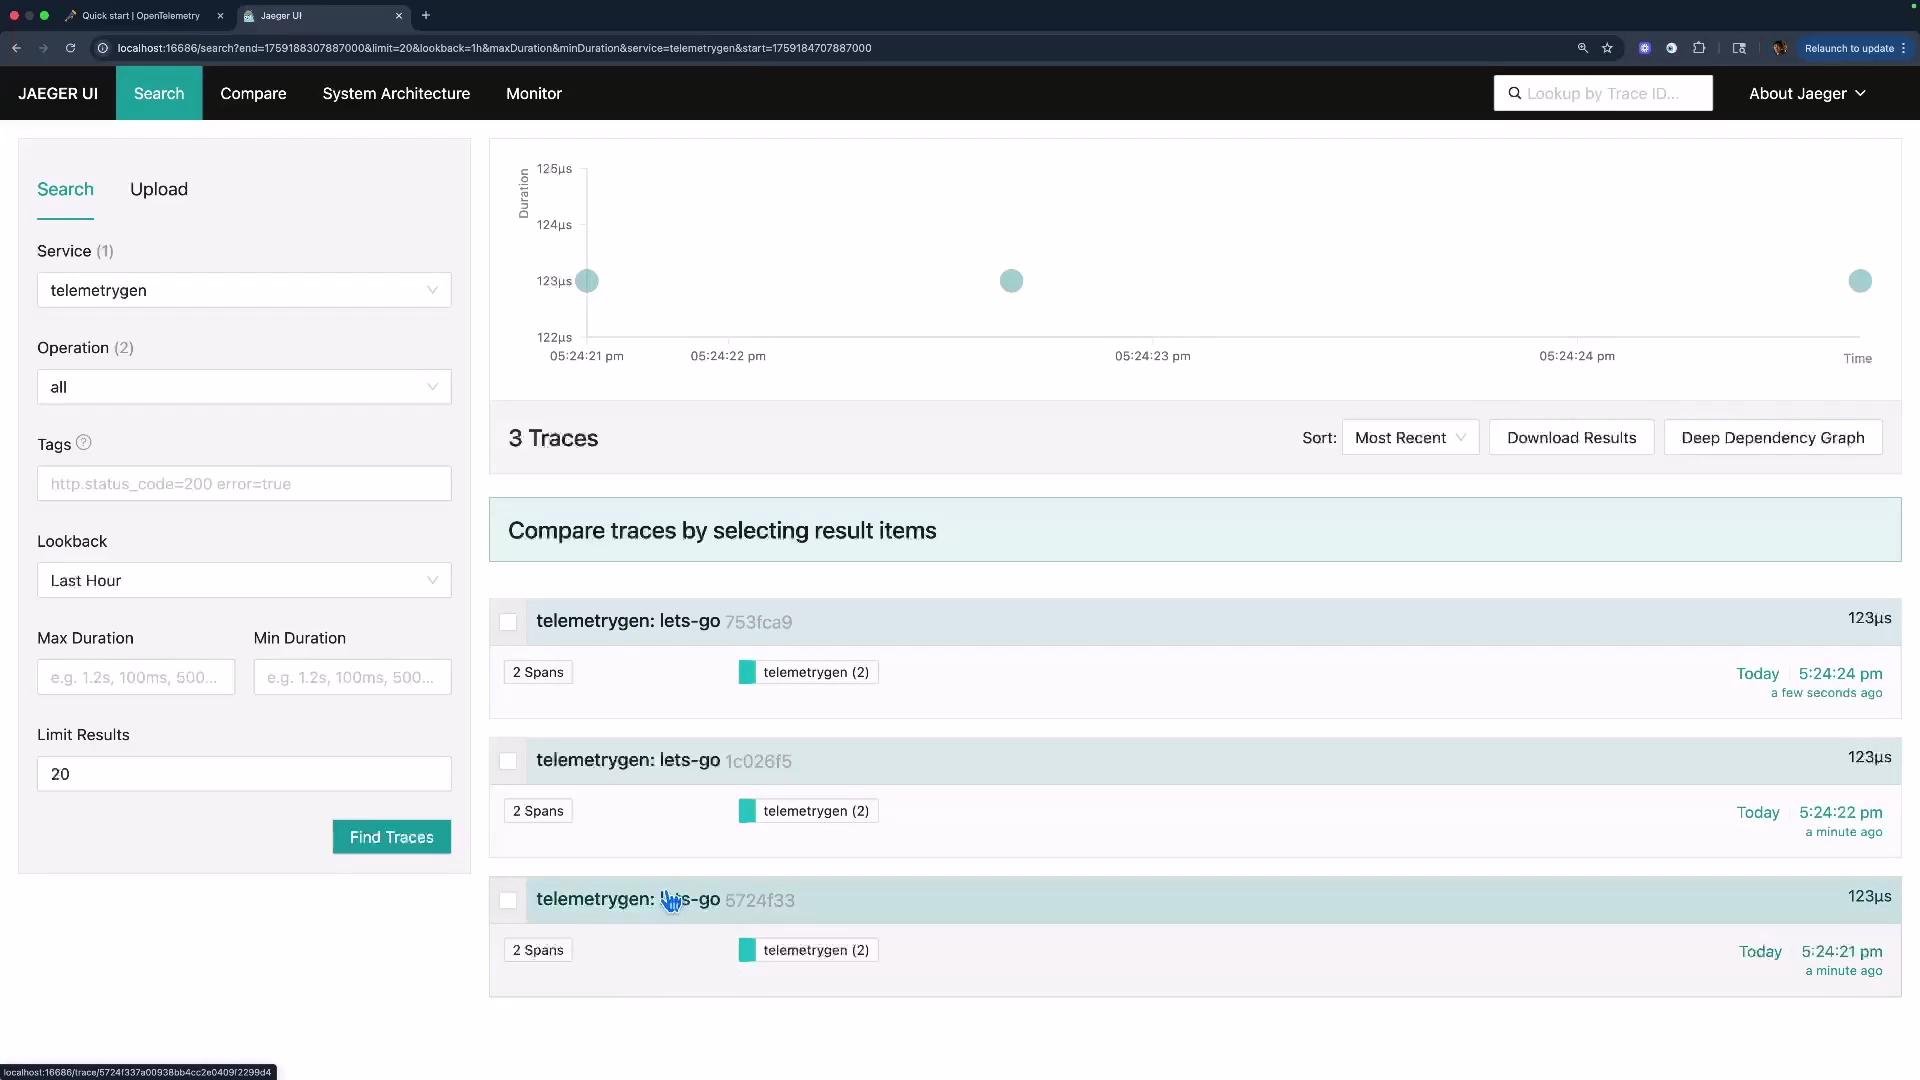
The image shows the Jaeger UI displaying trace results for the service "telemetrygen," including a graph of trace durations and a list of three traces with their respective details and timestamps.
Links and references

Watch Video