Auto Instrumentation Using the OpenTelemetry Operator
Explains using the OpenTelemetry Operator to auto-instrument Kubernetes workloads, centralizing instrumentation configuration and injecting language agents via Instrumentation custom resources and annotations.
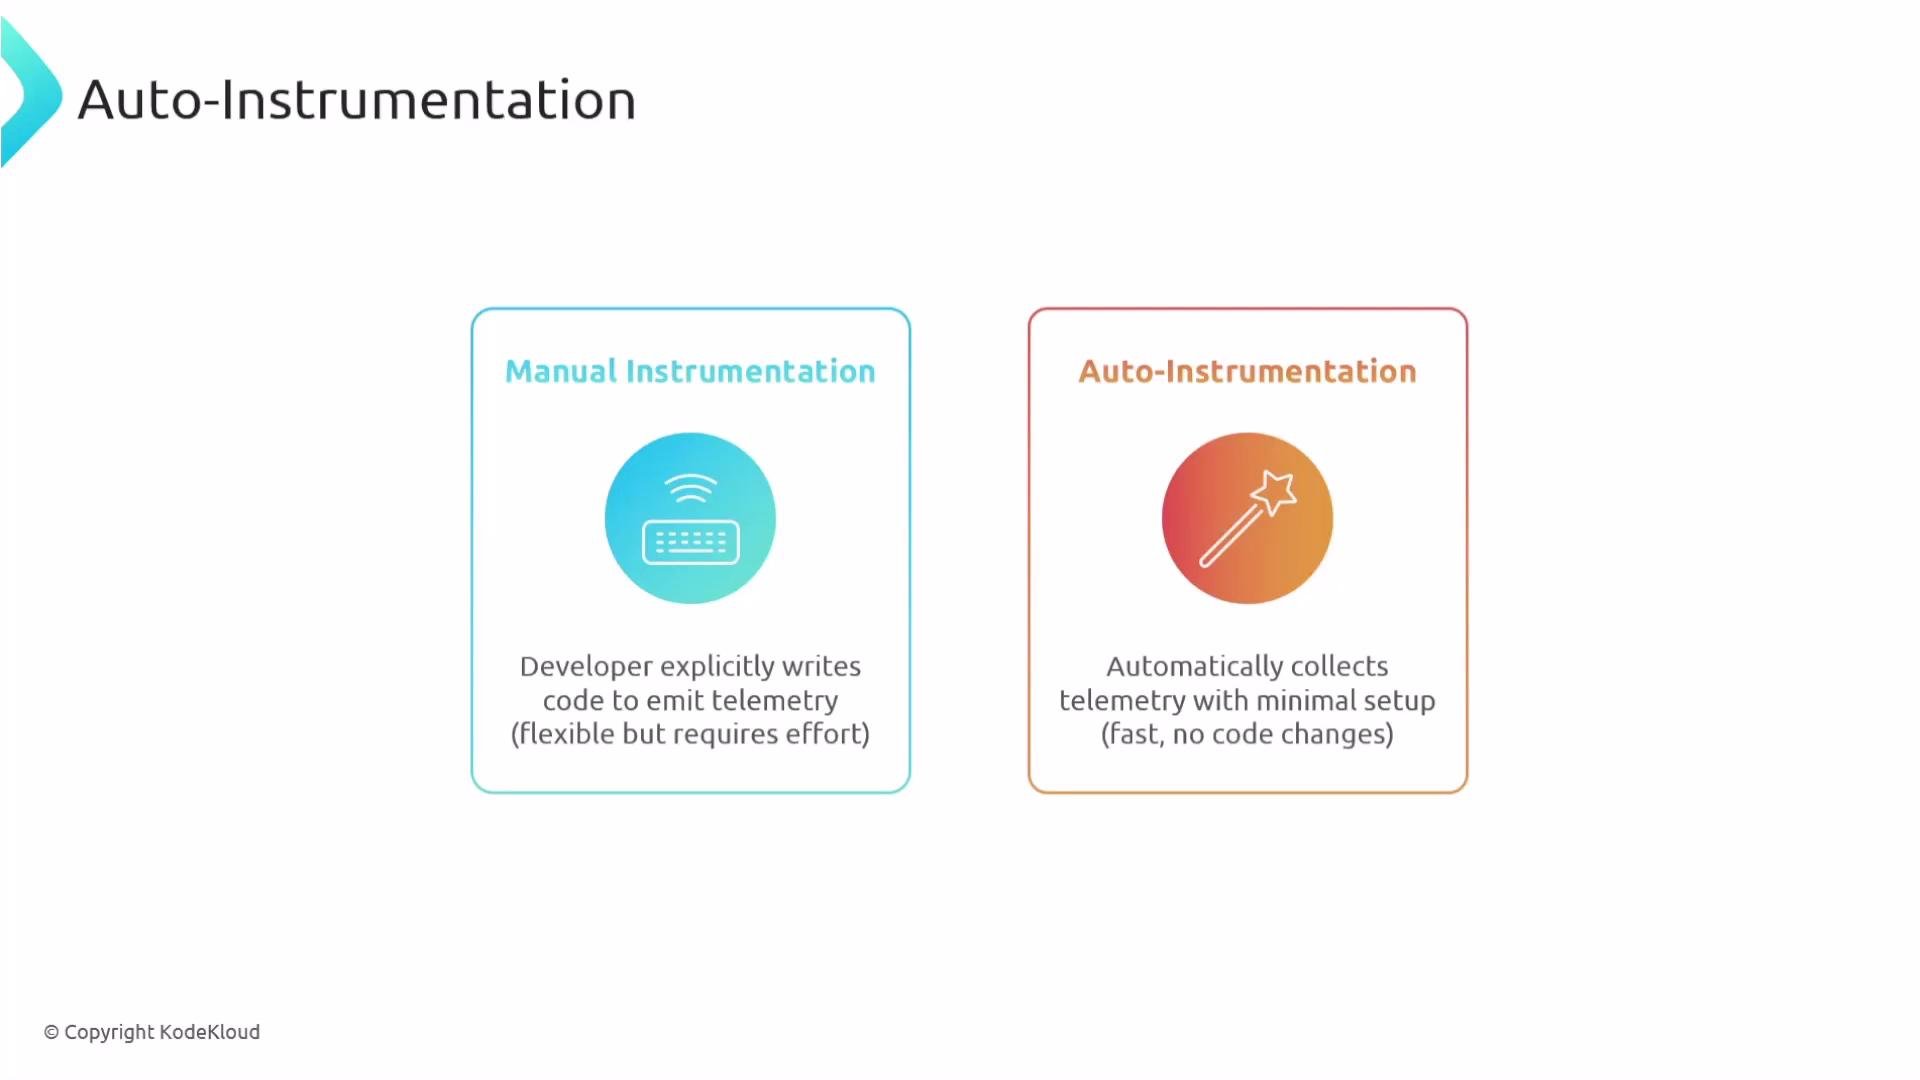
This article explains how auto-instrumentation works with the OpenTelemetry Operator and how it simplifies collecting telemetry from applications running in Kubernetes. While manual instrumentation remains an option, operator-based auto-instrumentation lets you collect traces, metrics, and logs with minimal code changes.
Auto-instrumentation is ideal when you need quick visibility into running workloads or when you want consistent observability settings across many deployments and namespaces.
Why use auto-instrumentation?
Fast path to visibility when you lack instrumentation in running workloads.
Centralized configuration reduces duplication and human error.
Operator ensures consistent agent injection and environment configuration across pods.
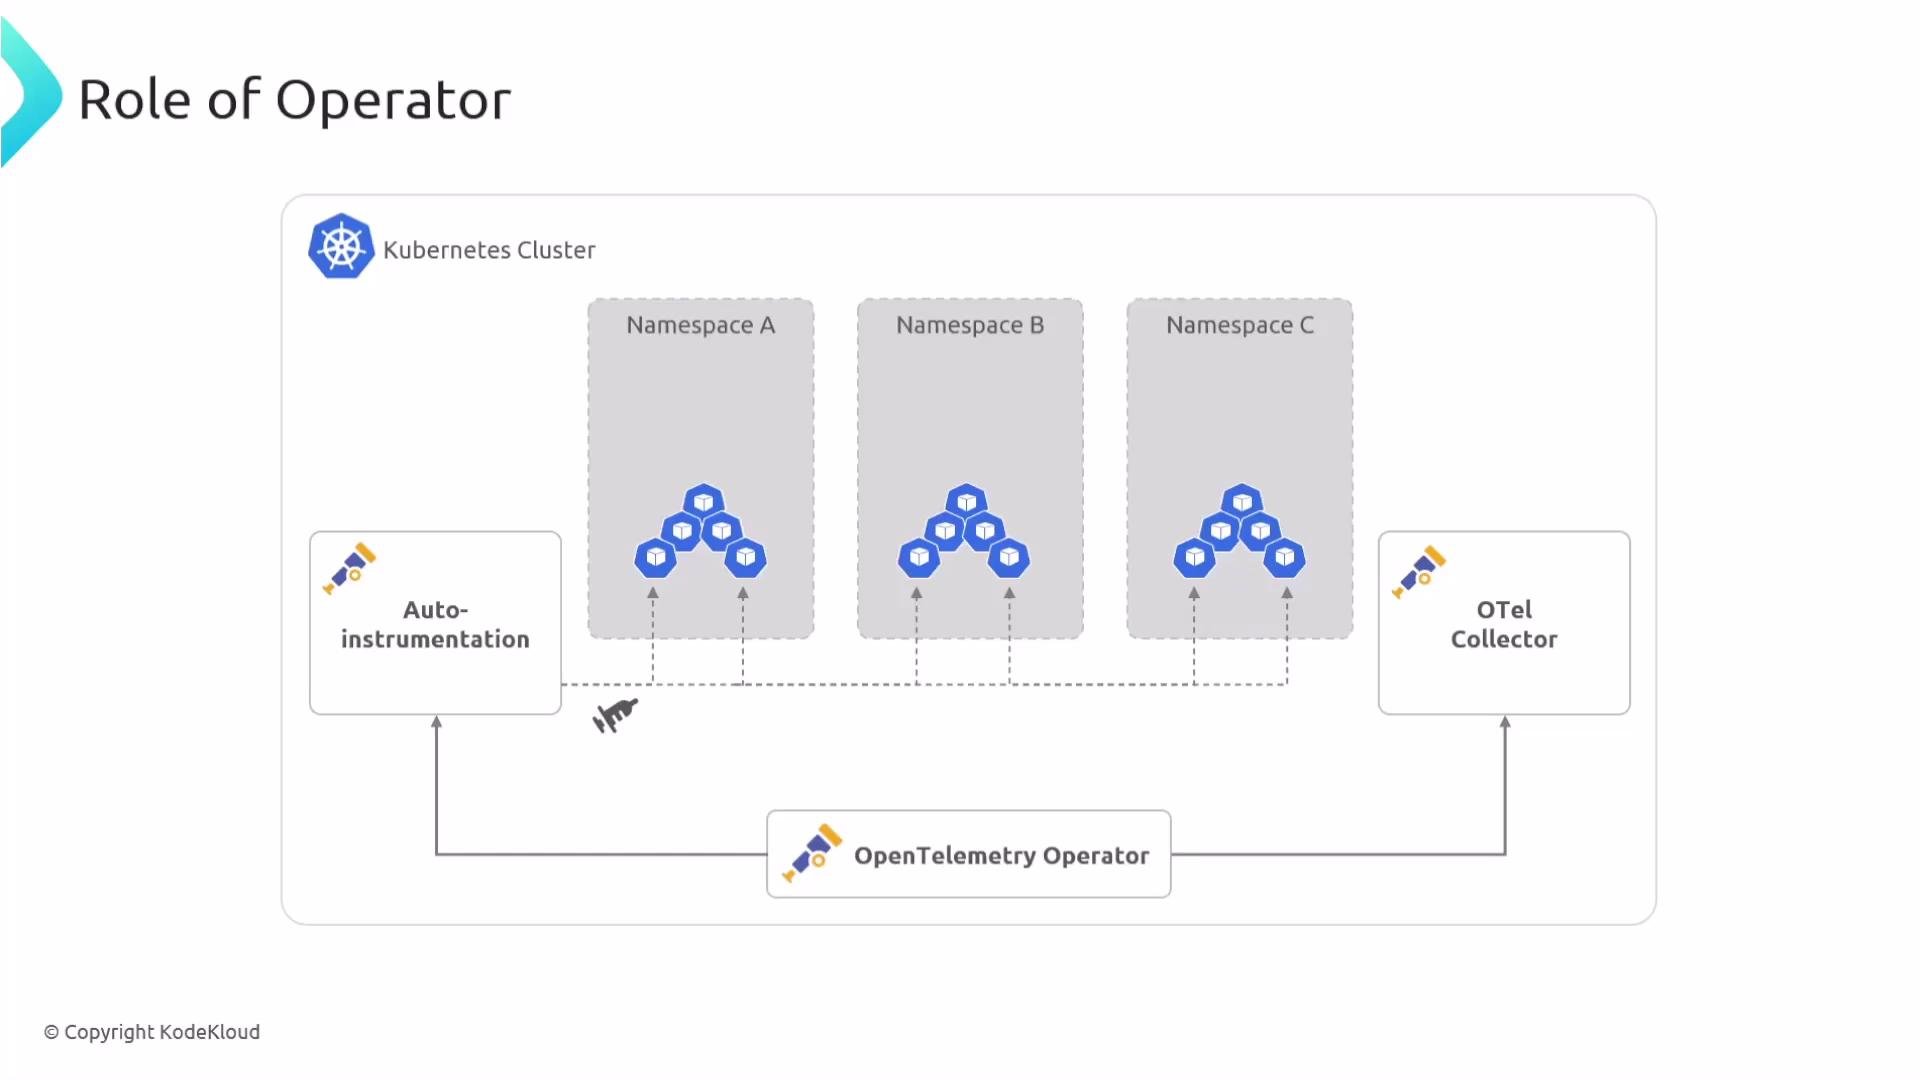
What the Operator does
Injects language-specific instrumentation libraries or agents into targeted pods.
Sets environment variables and runtime flags required by those agents.
Routes telemetry to a configured OpenTelemetry Collector or exporter endpoint.
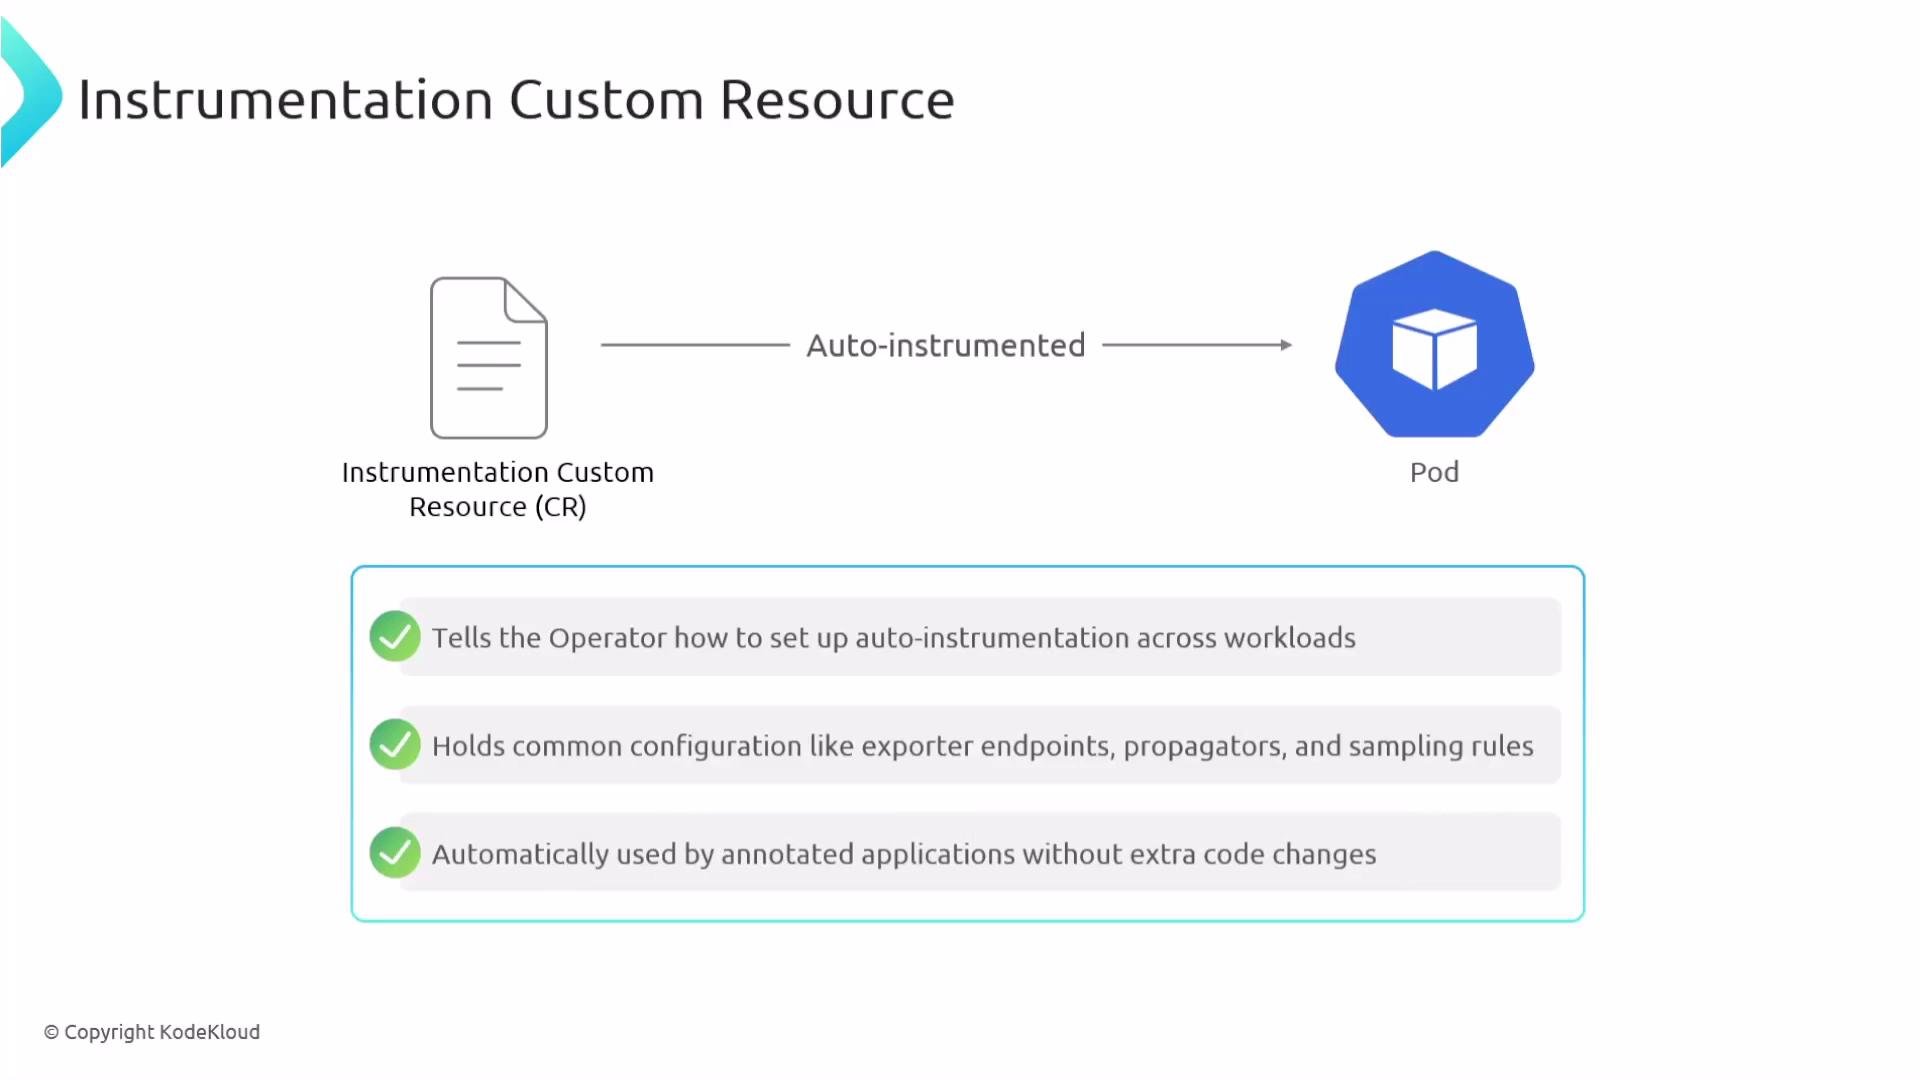
Instrumentation custom resources (CRs)A Kubernetes Custom Resource Definition (CRD) extends the API with new kinds. The OpenTelemetry Operator defines an Instrumentation custom resource that centralizes shared observability settings—exporter endpoints, propagators, samplers, and more—so you don’t repeat them in every Deployment or Pod.When an Instrumentation CR exists in a namespace, workloads can opt in via annotations. This model is particularly useful at scale (many namespaces or clusters) for enforcing consistent telemetry configuration.
Example Instrumentation CRThis example creates an Instrumentation CR that directs the operator to export OTLP to a collector and configures propagators and sampling:
Exam-style recall question
What is the Kubernetes kind that automatically instruments applications in Kubernetes?
Answer: InstrumentationHow the CR maps to injected environment variablesThe Operator translates the Instrumentation spec into environment variables and agent-specific settings inside the injected pod. Common mappings include:
spec.propagators → OTEL_PROPAGATORS with comma-separated values.
spec.sampler → OTEL_TRACES_SAMPLER and OTEL_TRACES_SAMPLER_ARG (or similar).
Illustrative example of injected env vars in a Pod:
# Example injected env vars in a Pod (illustrative)env: - name: OTEL_EXPORTER_OTLP_ENDPOINT value: "http://demo-collector:4318" - name: OTEL_PROPAGATORS value: "tracecontext,baggage" - name: OTEL_TRACES_SAMPLER value: "parentbased_traceidratio" - name: OTEL_TRACES_SAMPLER_ARG value: "1"
Sampling optionsYou control sampling behavior from the Instrumentation CR. The snippet below shows sampler configuration and common choices:
# In the Instrumentation CRspec: sampler: type: parentbased_traceidratio argument: "1" # 1 = 100%; 0.25 = 25%; 0 = 0%
Common sampler types:
Sampler type
Behavior
always_on
Sample all traces
always_off
Sample no traces
traceidratio
Sample approximately the fraction set by argument (e.g., "0.2" = 20%)
parentbased_traceidratio
Parent-based sampling; when no parent exists, argument controls the fraction
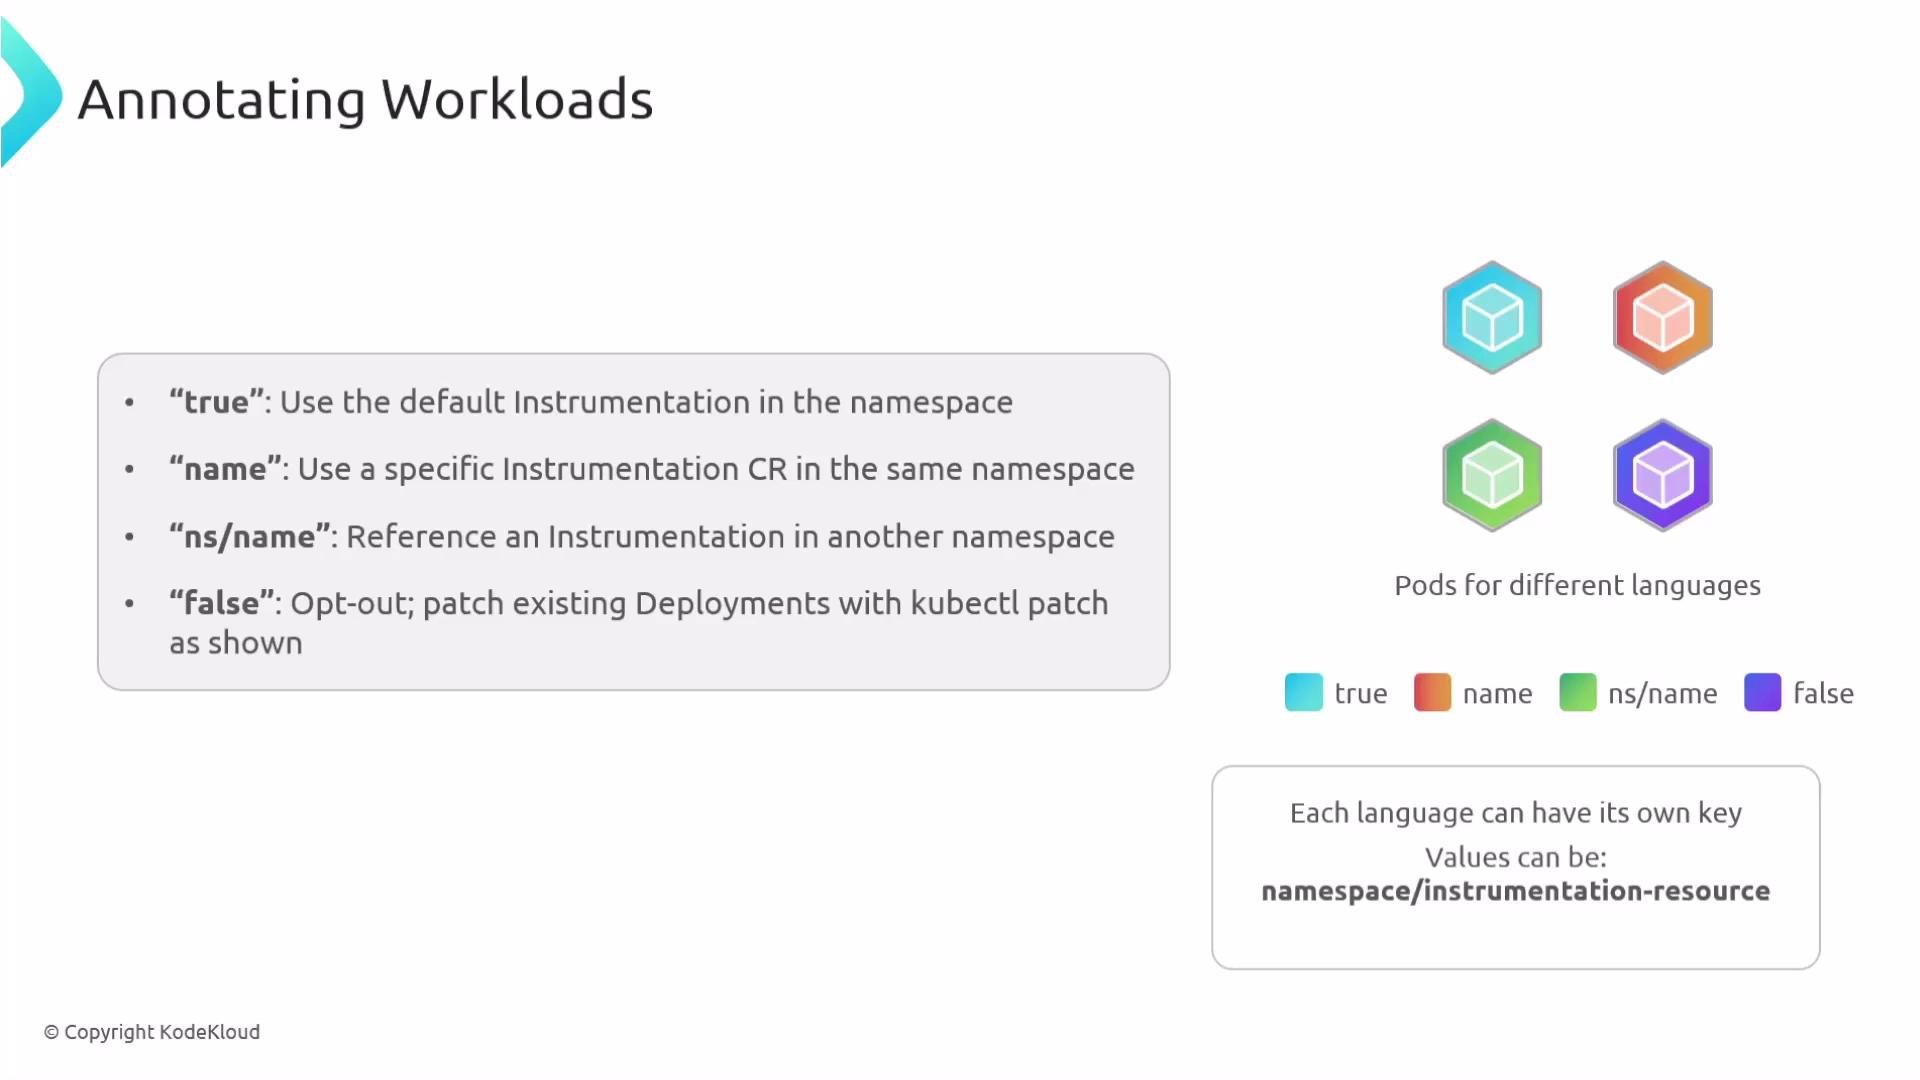
Enabling auto-instrumentation for workloadsWorkloads opt in by adding annotations on the Pod template. Each runtime has a specific annotation key.Pod template annotations example:
Use the default Instrumentation CR in the same namespace
"name"
Use an Instrumentation CR in the same namespace by name
"ns/name"
Use an Instrumentation CR from another namespace (useful for shared config)
"false"
Explicitly opt out of injection for this workload
Namespace-level opt-inInstead of annotating individual pod templates, you can annotate a Namespace to enable injection for all pods in that namespace:
# Opt-in at Namespace level (affects all Pods in the namespace)apiVersion: v1kind: Namespacemetadata: name: appns annotations: instrumentation.opentelemetry.io/inject-python: "true"
Use namespace-level injection with care. It will affect all pods in the namespace, including system, test, or utility pods that may not need instrumentation.
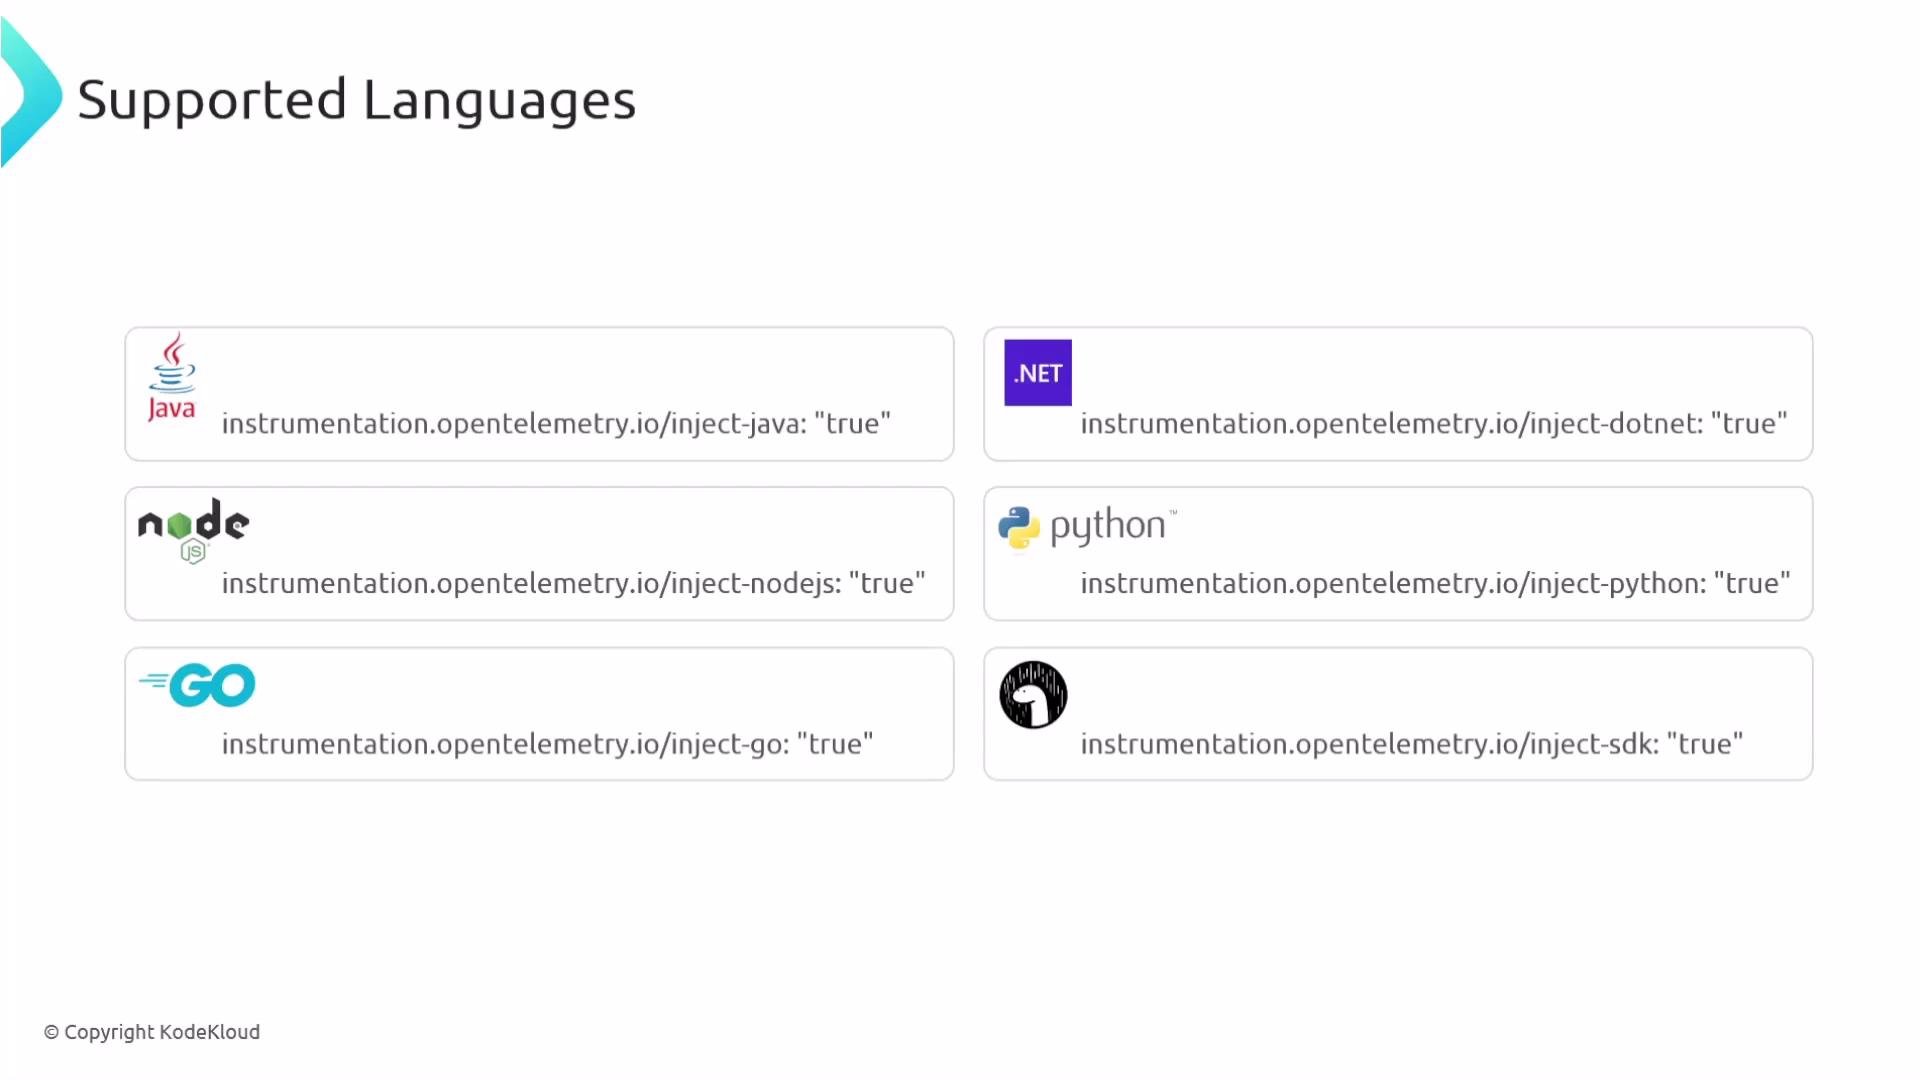
Supported languagesThe Operator supports injecting language-specific agents and setting the appropriate environment variables. Commonly supported runtimes include Java, .NET, Node.js, Python, and Go.
Key takeaways
The OpenTelemetry Operator centralizes observability settings through the Instrumentation custom resource.
Instrumentation CRs define exporters, propagators, samplers, and other shared configuration to avoid per-deployment duplication.
Workloads opt in to auto-instrumentation via pod annotations or namespace annotations; annotations can reference Instrumentation CRs across namespaces.
Apply namespace-level injection carefully to prevent unintentional agent injection.