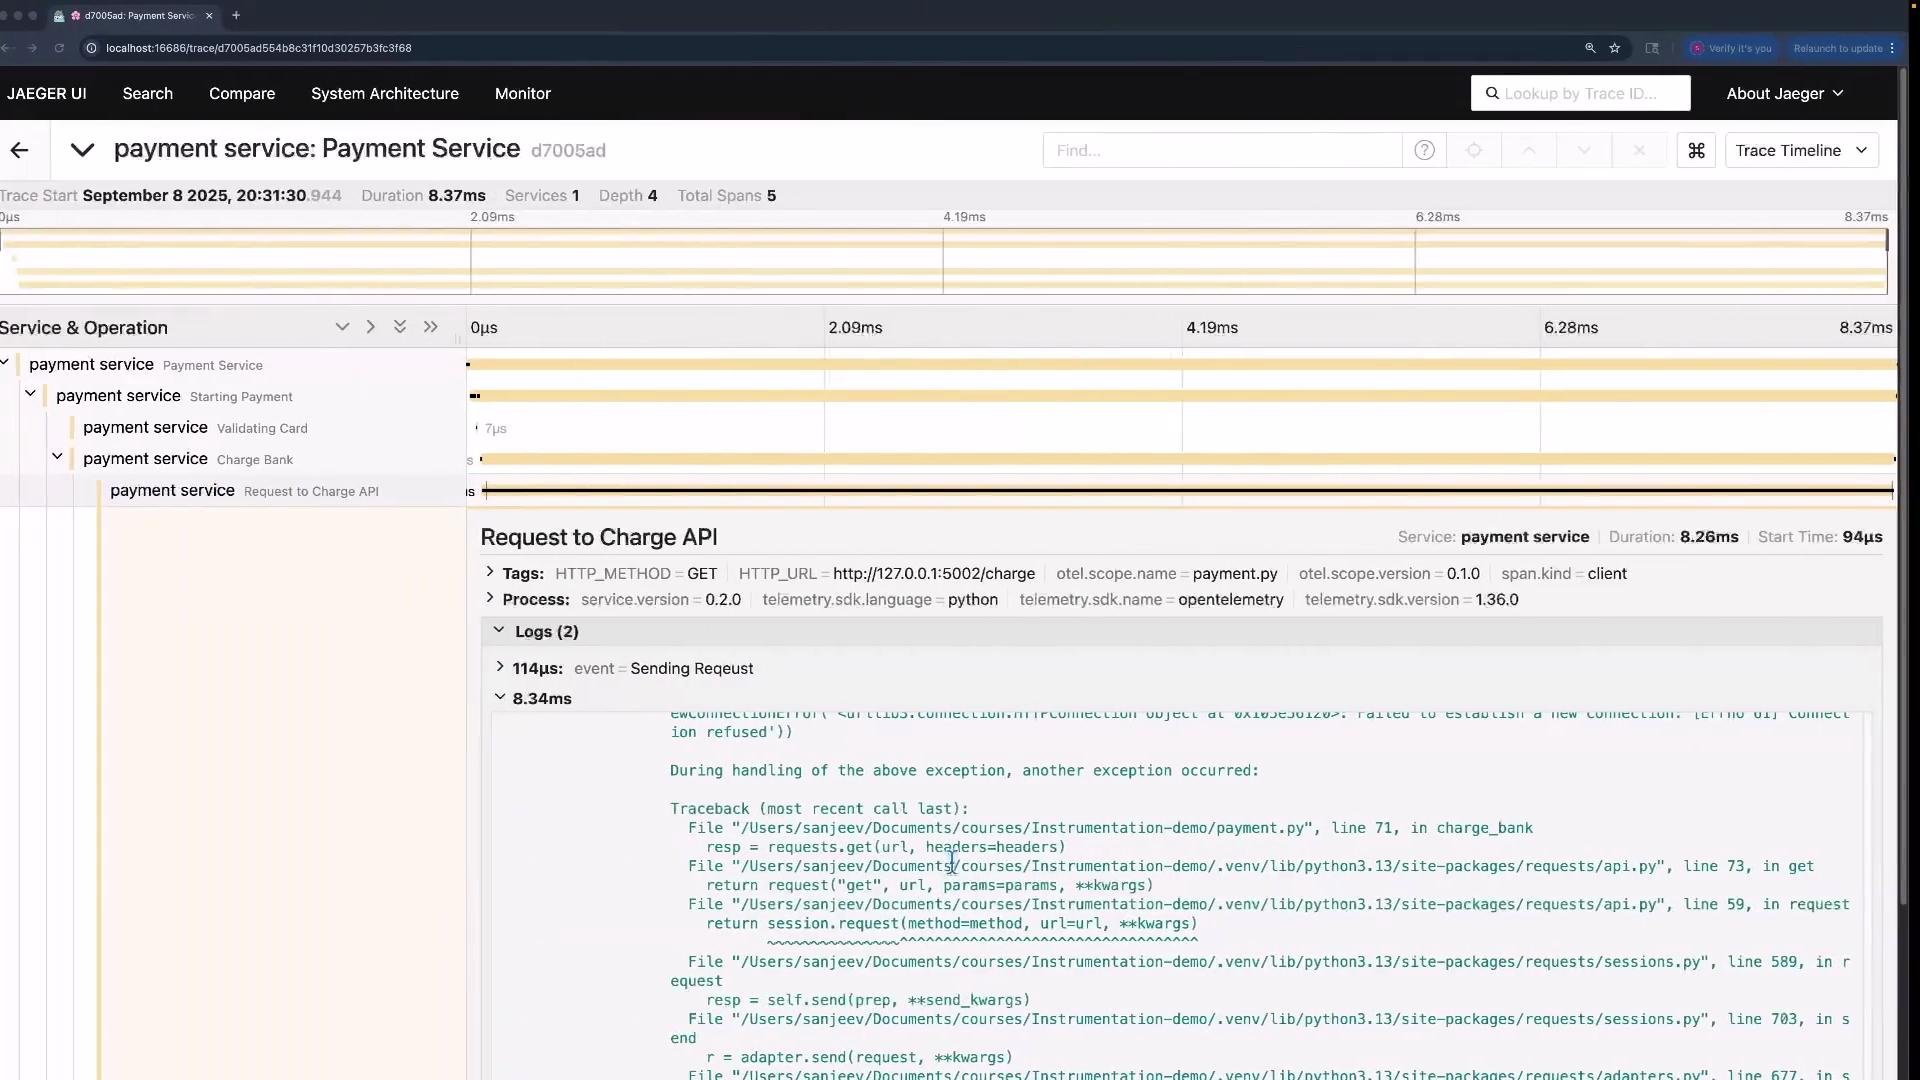
In this lesson we’ll show how to record exceptions in your OpenTelemetry traces. Exceptions occur when something unexpected fails — for example, a request to an external Charge API might fail because the remote service is down or the network is unavailable. Attaching exception details to spans helps you answer: what failed, when did it fail, and where in the trace timeline the failure occurred. Below are three progressively richer examples that demonstrate:
  • creating a client span for an outgoing HTTP request,
  • annotating spans with events and attributes,
  • recording exceptions explicitly, and
  • using the built-in helper to capture exception type, message, and stack trace.
First, a simple, clean example that creates a client span and annotates it with events and attributes:
If the remote service is unreachable (for example, if you mistakenly target port 5002 where nothing is listening) the requests.get call will raise an exception. You can catch that exception and add it to the span as a plain event:
This approach attaches an “exception” event to the span and includes the error message as an attribute. A better approach is to use the span API’s built-in helper so the instrumentation captures richer exception metadata (type, message, and stack trace):
Using span.record_exception(err) will include the exception type, message, and stack trace in the span. You can also set the span status to error with span.set_status(...) to make the error state explicit.
Best practices and behavior
  • Prefer span.record_exception(err) when you want structured exception data (type, message, stack trace) in the span.
  • Use span.set_status(trace.Status(trace.StatusCode.ERROR, "...")) if you want the span to be explicitly marked as an error in UI/analytics.
  • You do not always need an explicit try/except: if an exception propagates out of a span and your instrumentation/exporter is configured to capture uncaught exceptions, the tracing system may automatically record the exception on that span.
  • For richer context, include relevant attributes (HTTP method, URL, status code, and other request metadata) so backends can correlate exceptions with request details.
Comparison: event vs record_exception vs automatic capture
ApproachCapturesUse when
span.add_event("exception", attributes={...})Arbitrary attributes you add (e.g. {"error": "Connection refused"})You want custom, lightweight event data.
span.record_exception(err)Exception type, message, stack traceYou want structured exception data for debugging and stack traces.
Automatic capture by instrumentationDepends on instrumentation/exporter configurationYou rely on automatic capture for uncaught exceptions and minimal code changes.
When recorded, tracing backends such as Jaeger will display the exception event and stack trace in the trace timeline, making it easy to correlate a failure with the specific span and service. References
The image shows a Jaeger UI interface displaying the trace timeline of a payment service with multiple spans and logs, including a request to a charge API.

Watch Video