

- Traces emitted by application instrumentation (e.g., OpenTelemetry SDKs).
- Metrics scraped from a Prometheus server or exposed by applications.
- Logs from files, agents, or structured log streams.
Receivers
Receivers are the Collector’s entry points. They accept data over external protocols and translate it into the Collector’s internal data model. Each signal type (traces, metrics, logs) usually has its own receiver implementations. Common examples includeotlp, prometheus, jaeger, and filelog.
Key responsibilities:
- Decode wire formats (gRPC, HTTP, protobuf, text).
- Perform protocol-specific validation or minimal parsing.
- Hand data into the Collector’s internal pipeline model.
Processors
Processors operate on data after reception but before export. They refine, enrich, and reduce data volumes to prepare telemetry for backends. Typical processor tasks:- Batching: group items to increase throughput and reduce exporter load.
- Filtering and routing: drop or route data based on attributes.
- Transformation / enrichment: add or rewrite attributes, map resource information.
- Sampling: keep a representative subset of spans to control costs.
Processor order matters. Place
sampling before batch when you need to avoid batching sampled-out items, and apply resource/attributes processors early if later processors rely on those attributes.Exporters
Exporters convert the Collector’s internal model into backend-specific wire formats and transmit data over HTTP, gRPC, or other protocols. Examples include exporters forotlp, prometheus, logging, and commercial backends.
Exporter responsibilities:
- Marshal data to the target format (JSON, protobuf).
- Manage network communication, retries, and timeouts.
- Optionally implement buffering or queuing logic.
Pipelines and Service
Each signal type (traces, metrics, logs) runs in its own pipeline configured under the Collector’sservice section. A pipeline executes components in sequence:
receiver -> processor(s) -> exporter
This modular architecture lets you configure independent processing paths for each signal type and tailor behavior to different backends.
Example pipeline configuration (YAML):
Each pipeline is signal-specific (traces, metrics, logs). Receivers translate protocols, processors modify or enrich data, and exporters deliver processed telemetry to your chosen backends.
Connectors
Connectors bridge data between pipelines or transform one signal into another. Use cases include:- Deriving metrics from traces (e.g., counting specific trace events).
- Routing logs into metrics or traces for correlation.
- Forwarding data from one pipeline to another without touching the original instrumentation.
Extensions
Extensions run outside the main signal pipelines and add operational capabilities to the Collector process itself. Examples:- Health checks and readiness probes.
- zPages for debugging and insight into internal state.
- Authentication, TLS termination, and observability endpoints.
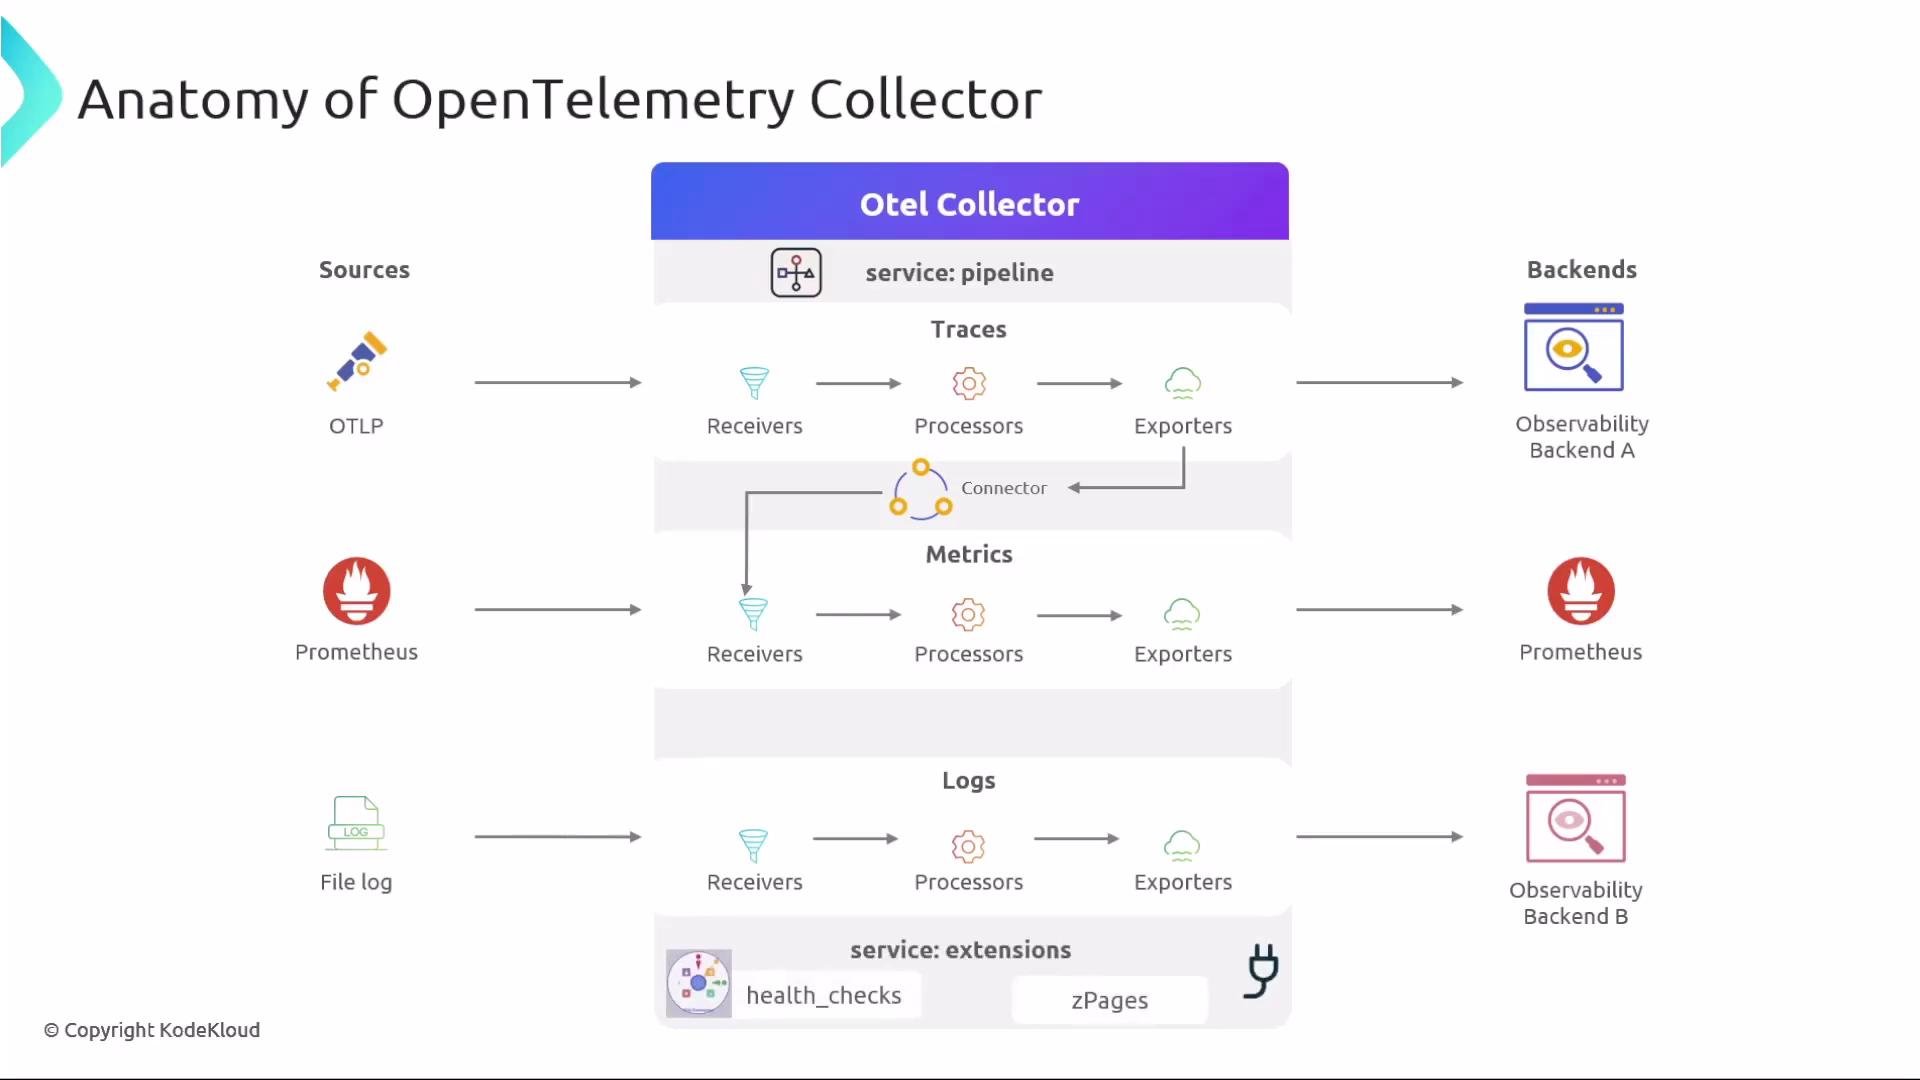
Putting it all together
Telemetry enters via receivers, flows through configured processors inside a pipeline, and exits through exporters to one or more backends. Connectors let you bridge pipelines when you need cross-signal conversions, while extensions provide operational and administrative capabilities for the Collector process itself. This architecture allows you to compose multiple independent pipelines and components to match your deployment, scaling, and observability requirements.Component Summary
Best Practices
- Design pipelines around signal types to keep configuration clear and maintainable.
- Use batching and memory-limiting processors to avoid spikes in exporter load.
- Apply sampling strategically to control cost while preserving signal fidelity.
- Monitor the Collector (using extensions like zPages or Prometheus metrics) to detect backpressure and resource issues.
Links and References
- OpenTelemetry Collector: https://opentelemetry.io/docs/collector/
- Collector GitHub repo: https://github.com/open-telemetry/opentelemetry-collector
- OpenTelemetry Specification: https://github.com/open-telemetry/opentelemetry-specification
Start small: configure a single pipeline, validate end-to-end telemetry flow, then iterate with processors and exporters as your needs grow.