

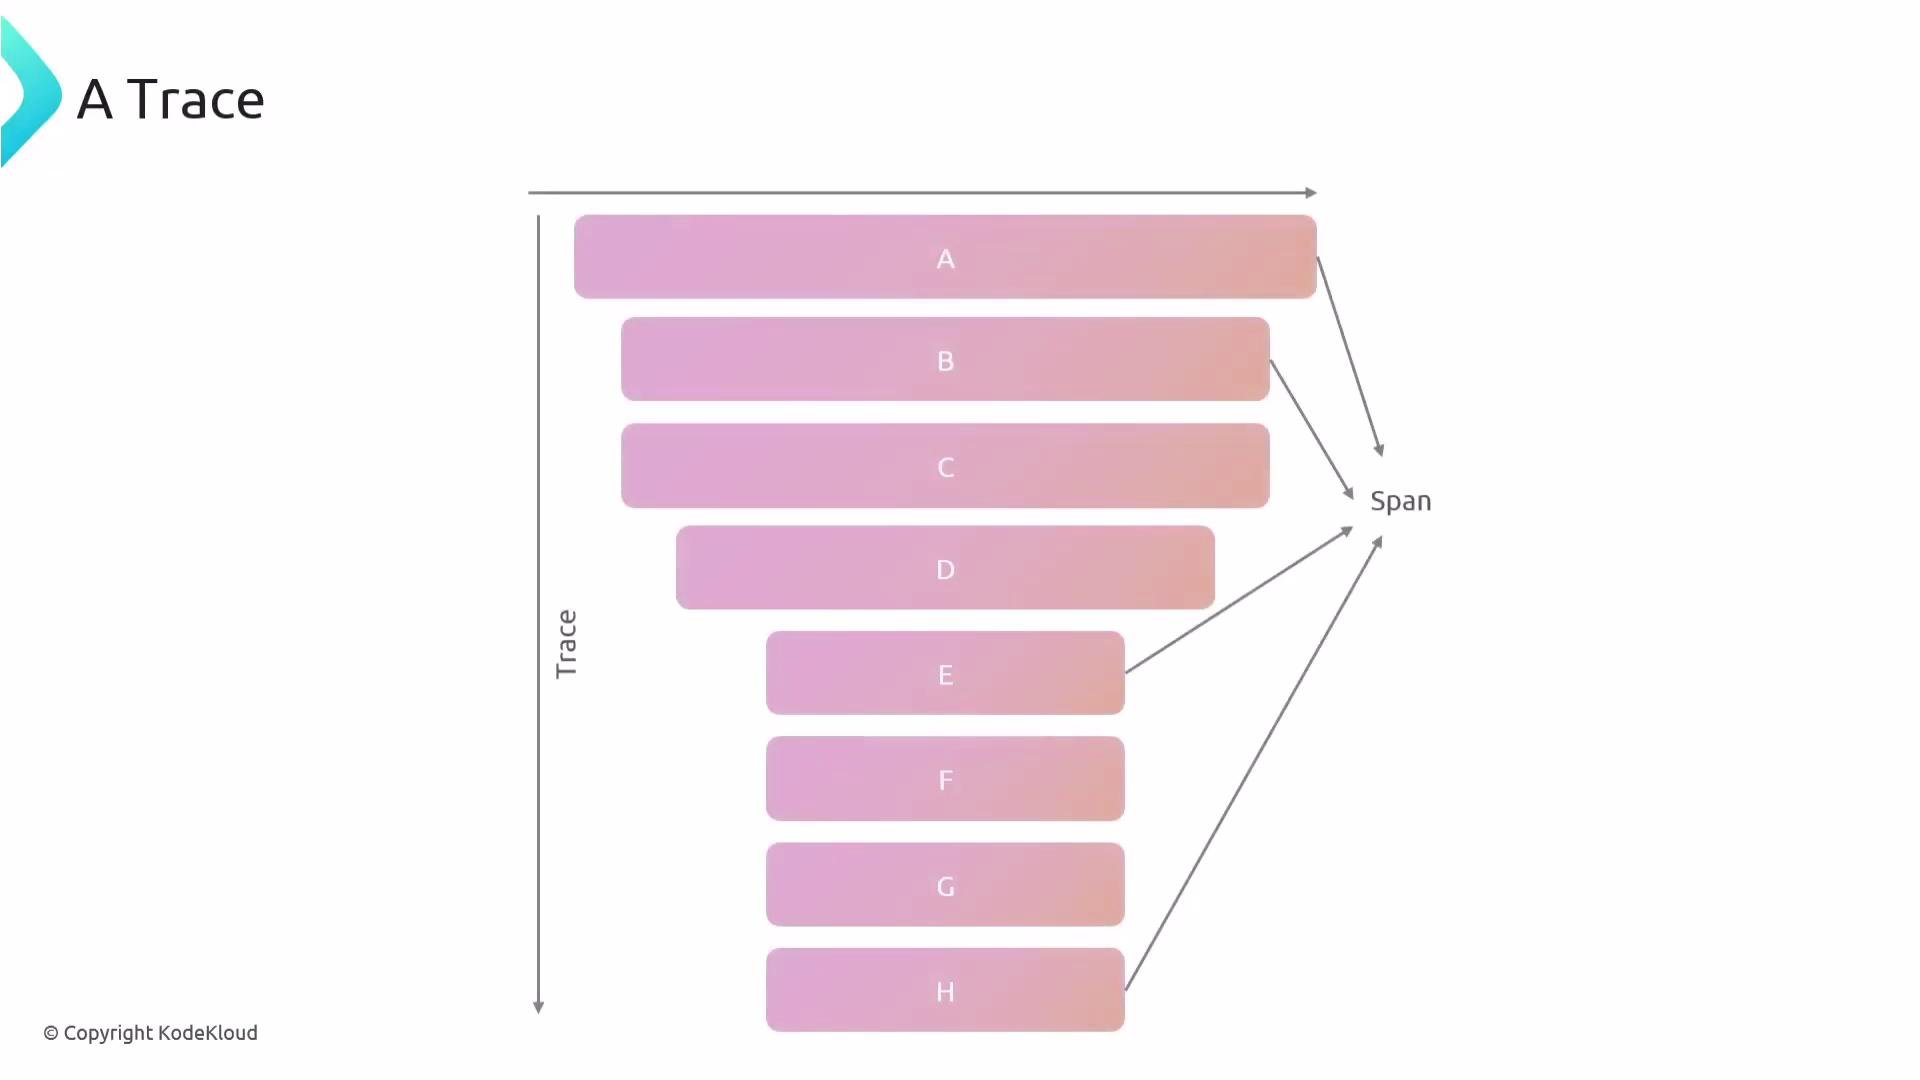
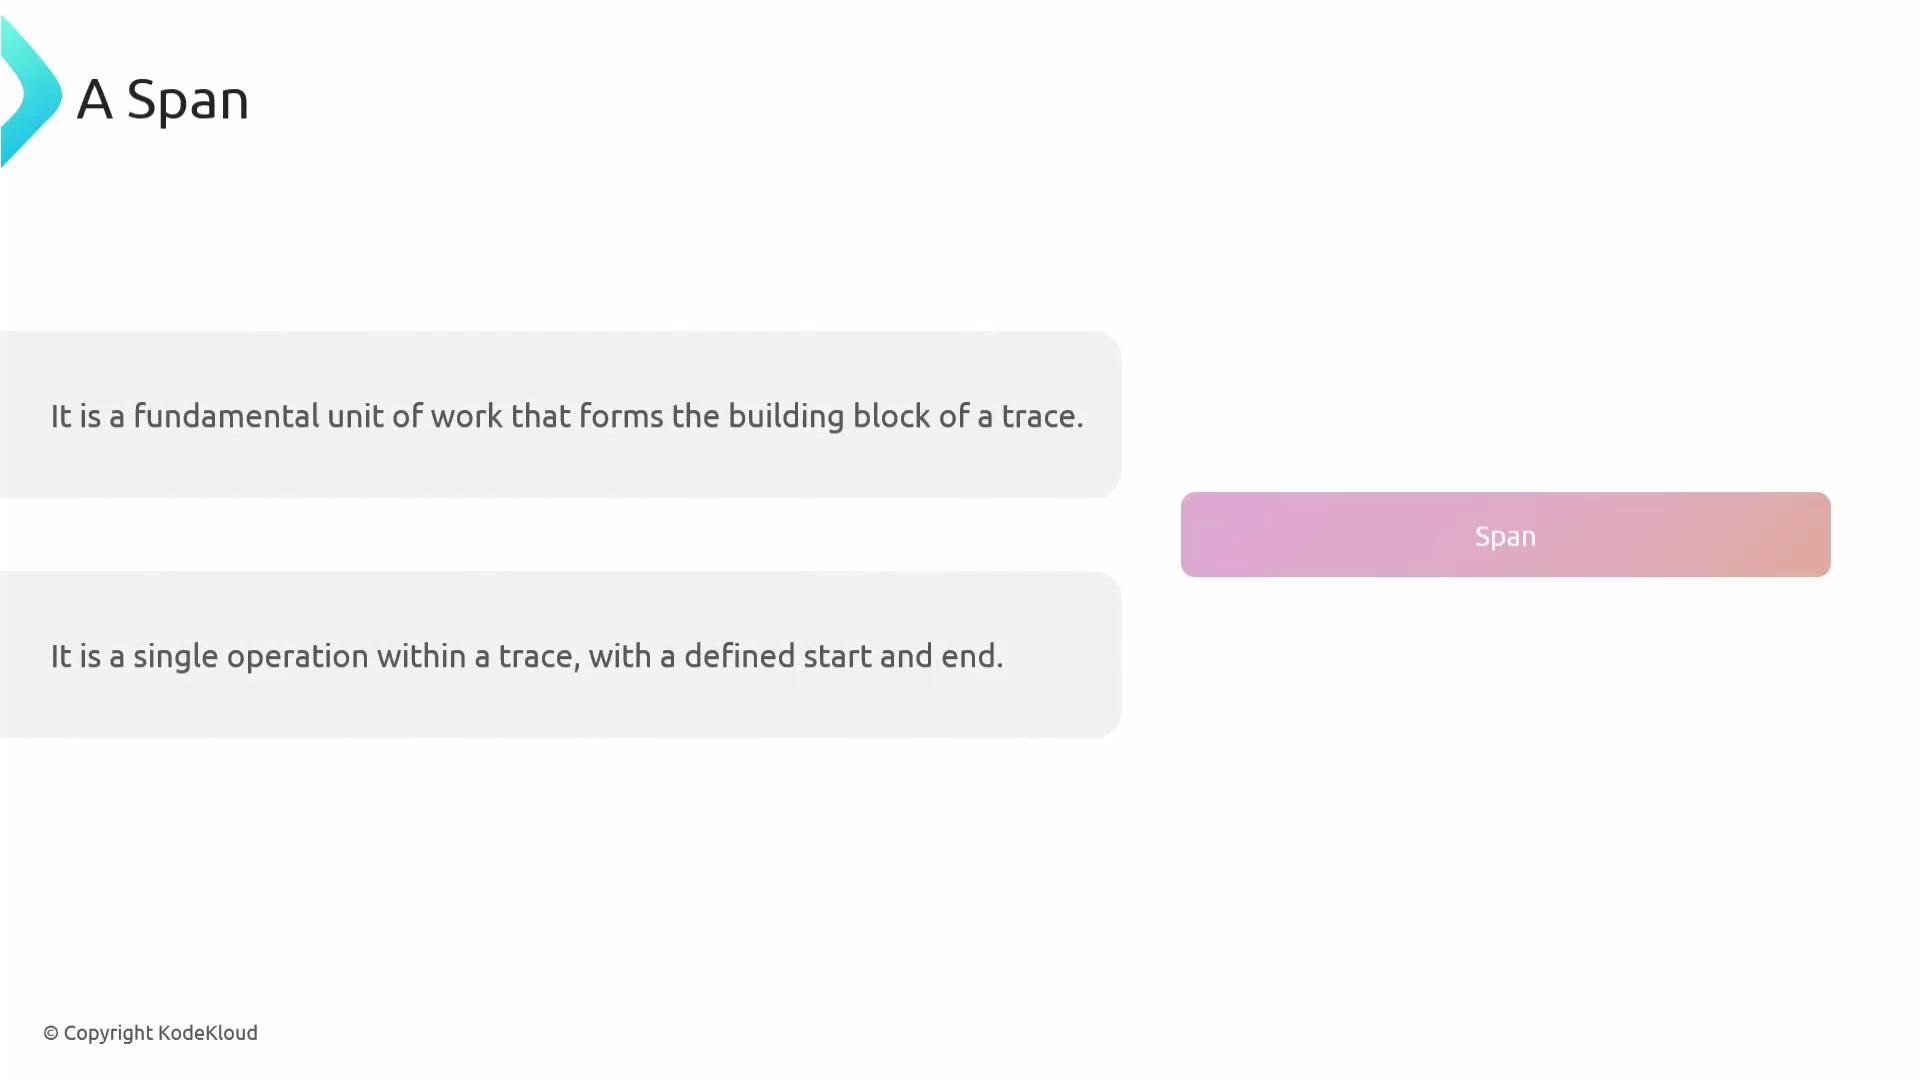
What can a span represent?
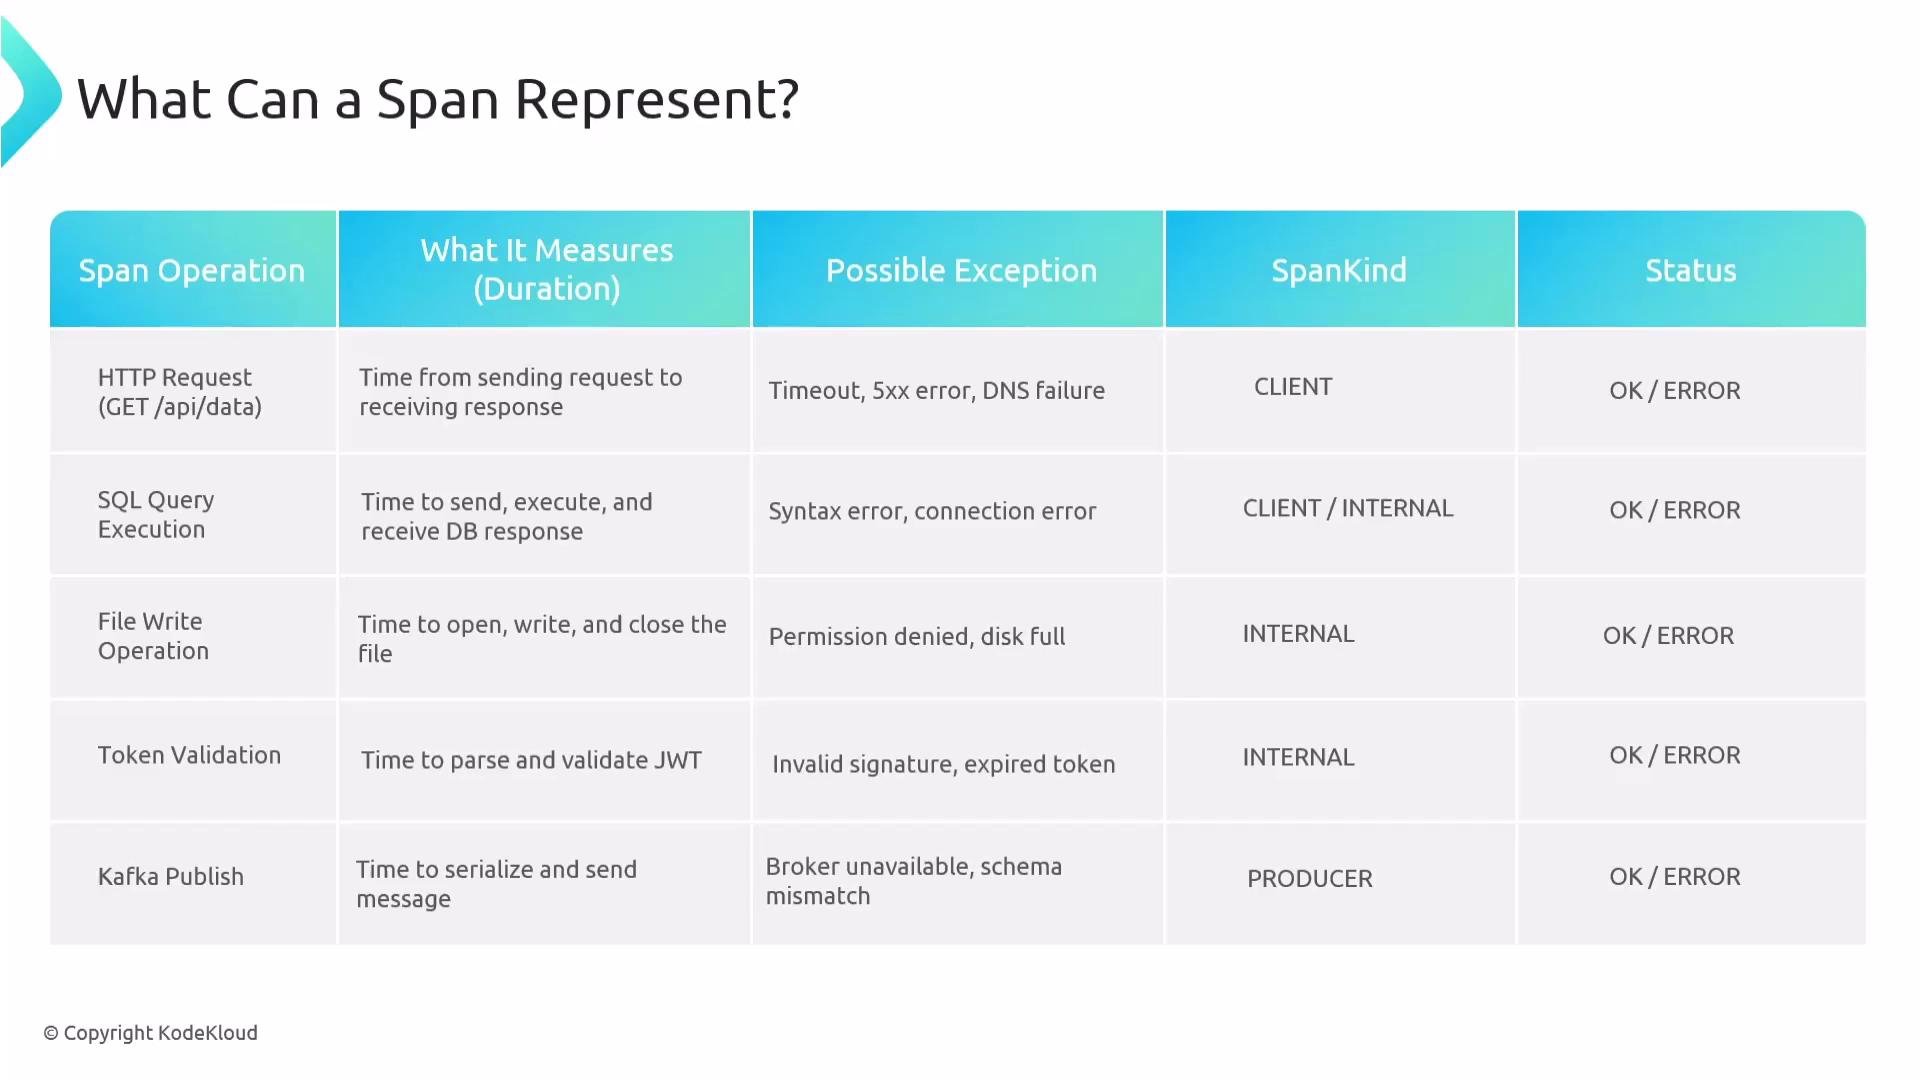
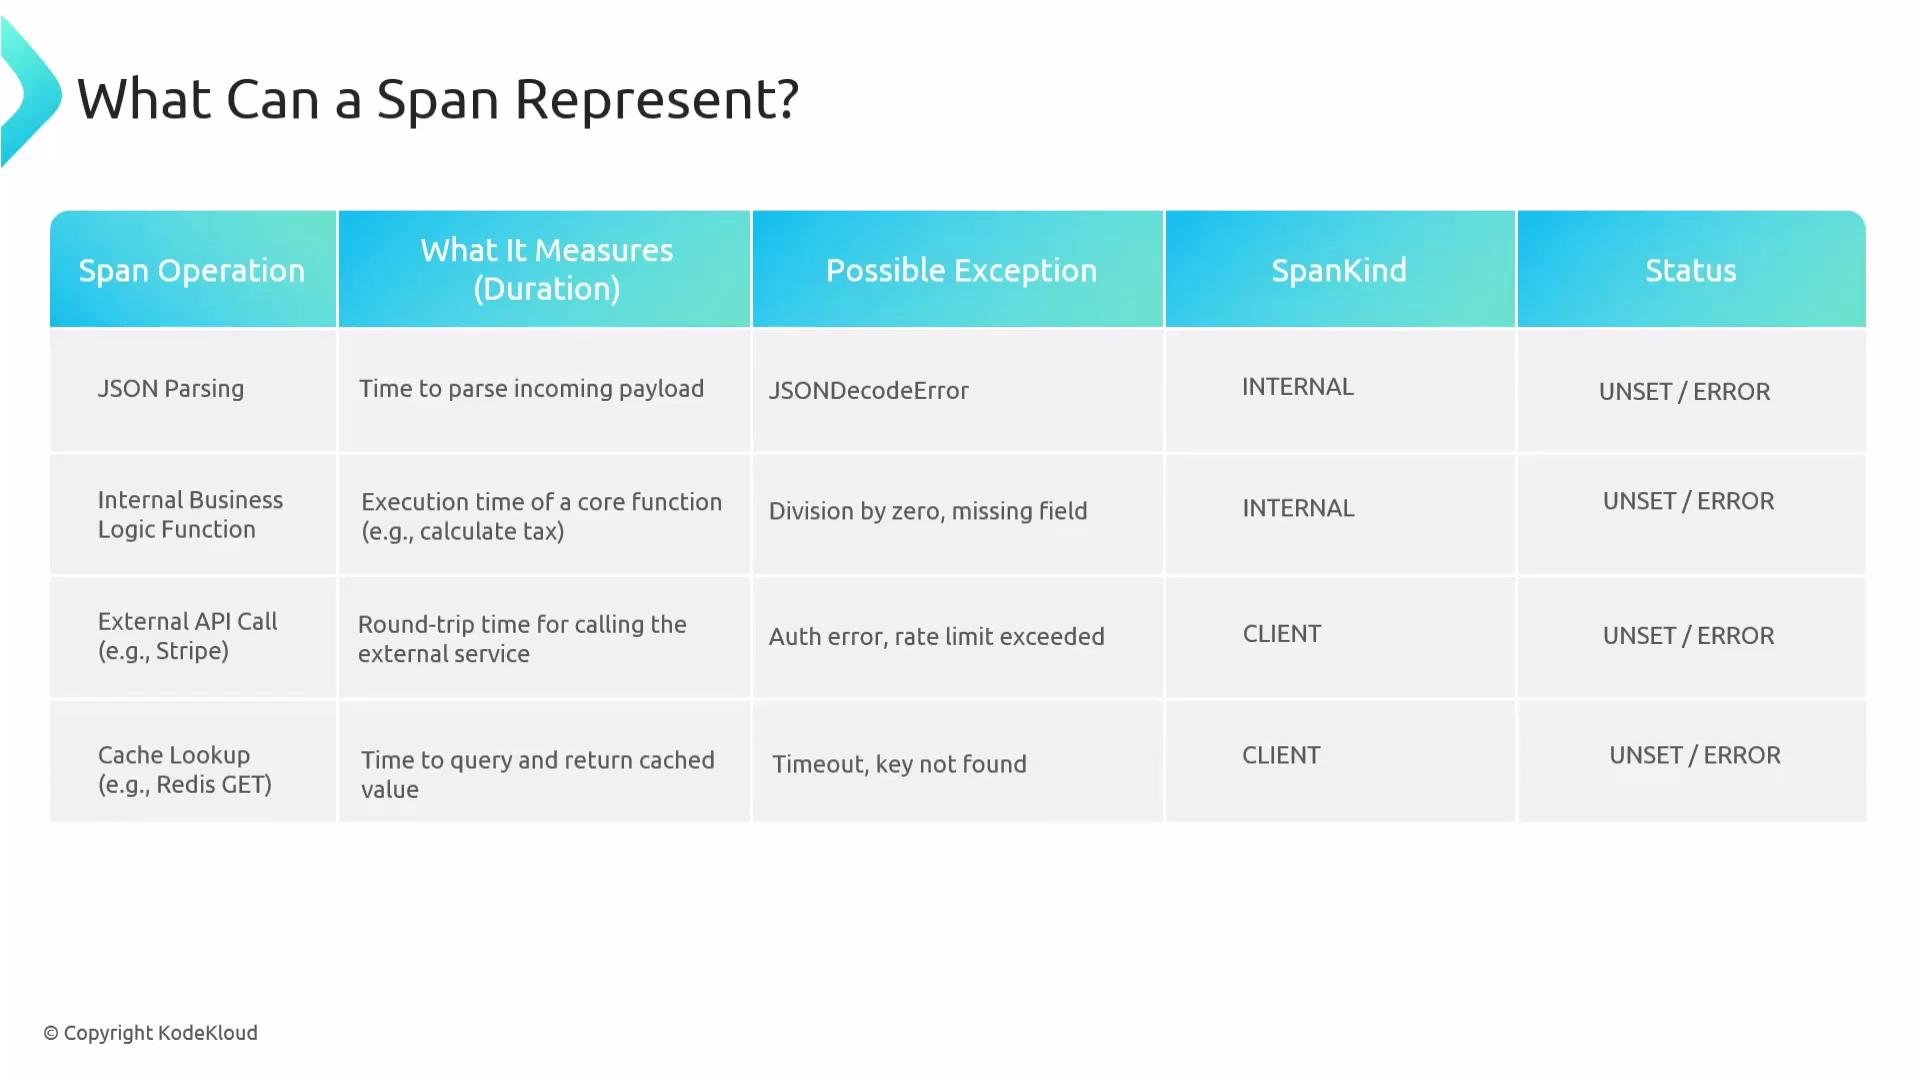
Think of a span as one measurable piece of work inside your application. Typical examples include:- A function or internal business-logic execution.
- An outgoing HTTP/gRPC call (for example, fetching product details from another service).
- A database operation such as a SQL query.
- File I/O, encryption/decryption, or image compression.
- Lightweight work like JSON parsing or payload validation.
- Message processing (consuming a single Kafka message).
- UI rendering (for instance, a React component render).
- Background tasks, retries, authentication flows, and notification delivery.
Span structure: what a span includes
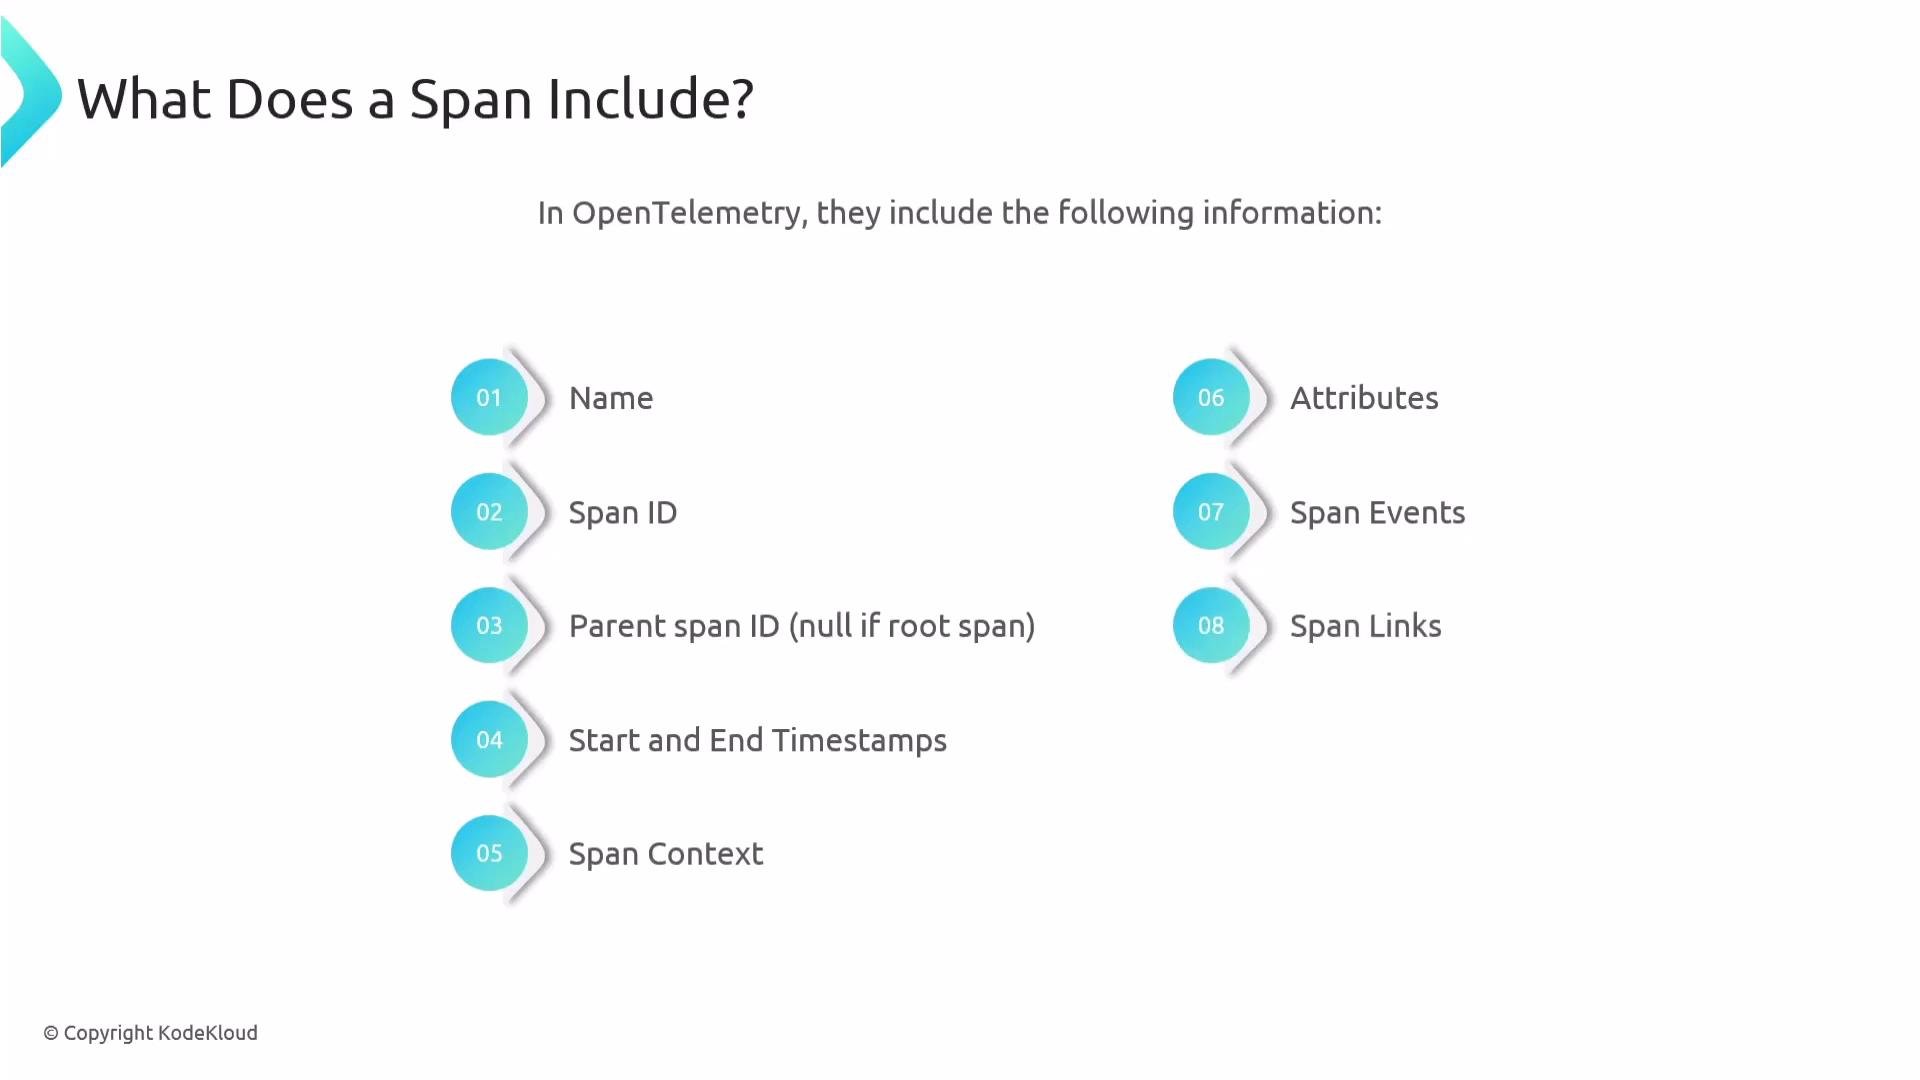
An OpenTelemetry span captures a consistent set of fields that let you reason about the operation and how it relates to other work:- The span name (human-readable).
- The span ID and the parent span ID (
parent_idisnullfor a root span). - Start and end timestamps.
- The span context (the trace identifiers that propagate across services).
- Attributes (key/value pairs that add descriptive metadata).
- Events (time-stamped annotations, commonly used to record exceptions or milestones).
- Links (optional references to other spans or traces).
- Span status (for example,
OK,ERROR, orUNSET).
service.name). The schema_url can describe the semantics of attribute keys.
Example: a recorded span (JSON)
Below is a representative OpenTelemetry span encoded as JSON. It models a client span that performed an HTTP GET and recorded an event when the response arrived.name: human-readable operation name.context.trace_idandcontext.span_id: identifiers that link spans into traces.kind: the span kind (for example,SpanKind.CLIENTorSpanKind.SERVER).parent_id: links a span to its parent (or isnullfor the root).start_timeandend_time: timestamps; duration =end_time - start_time.status.status_code: for example,OK,ERROR, orUNSET.attributes: contextual key/value pairs (network info, DB statement, user id, etc.).events: time-stamped events within the span (exceptions, response reception).links: optional cross-trace relations, useful for batching or forks.resource.attributes: metadata about the originating service (for example,service.name).schema_url: optional pointer to attribute semantics.
status.status_code: "OK" indicates success. When an exception occurs, it’s common to record the exception as an event and set the span status to ERROR.
Choose span granularity deliberately — capture operations you need for latency and error visibility. Avoid over-instrumentation (which creates noise and overhead) and under-instrumentation (which loses useful diagnostic detail).
Summary
- A span captures one operation or unit of work with start/end times and contextual data.
- Parent/child relationships and links join spans into traces that represent the end-to-end request journey.
- Spans include IDs, timestamps, attributes, events, links, status, and resource metadata.
- Be intentional about span boundaries: balance observability detail against system overhead.
Links and References
- OpenTelemetry Specification: https://opentelemetry.io/docs/
- OpenTelemetry Trace Semantic Conventions: https://opentelemetry.io/docs/reference/specification/trace/semantic_conventions/