

Receivers are the first stage in the Collector pipeline. Configure them to match your instrumented applications, Prometheus endpoints, host agents, or legacy systems so the Collector can consistently process and export telemetry.
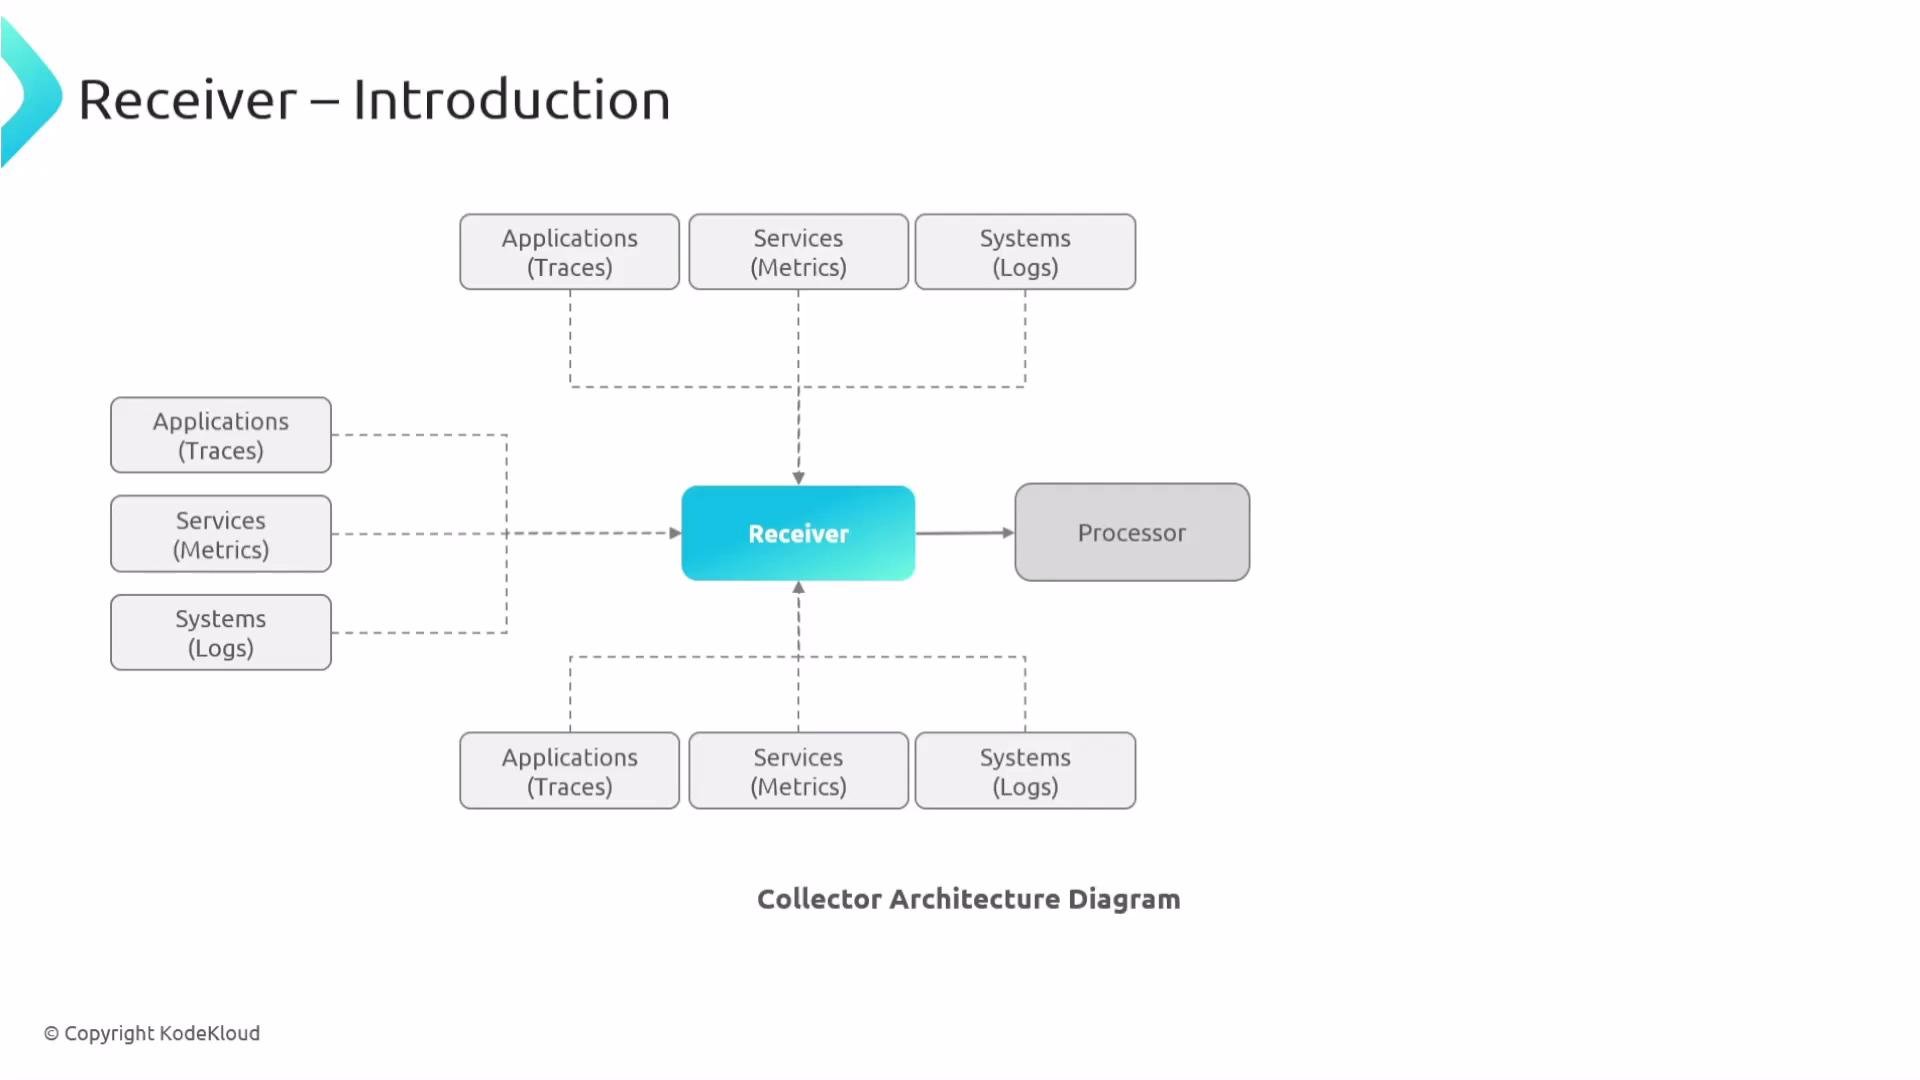
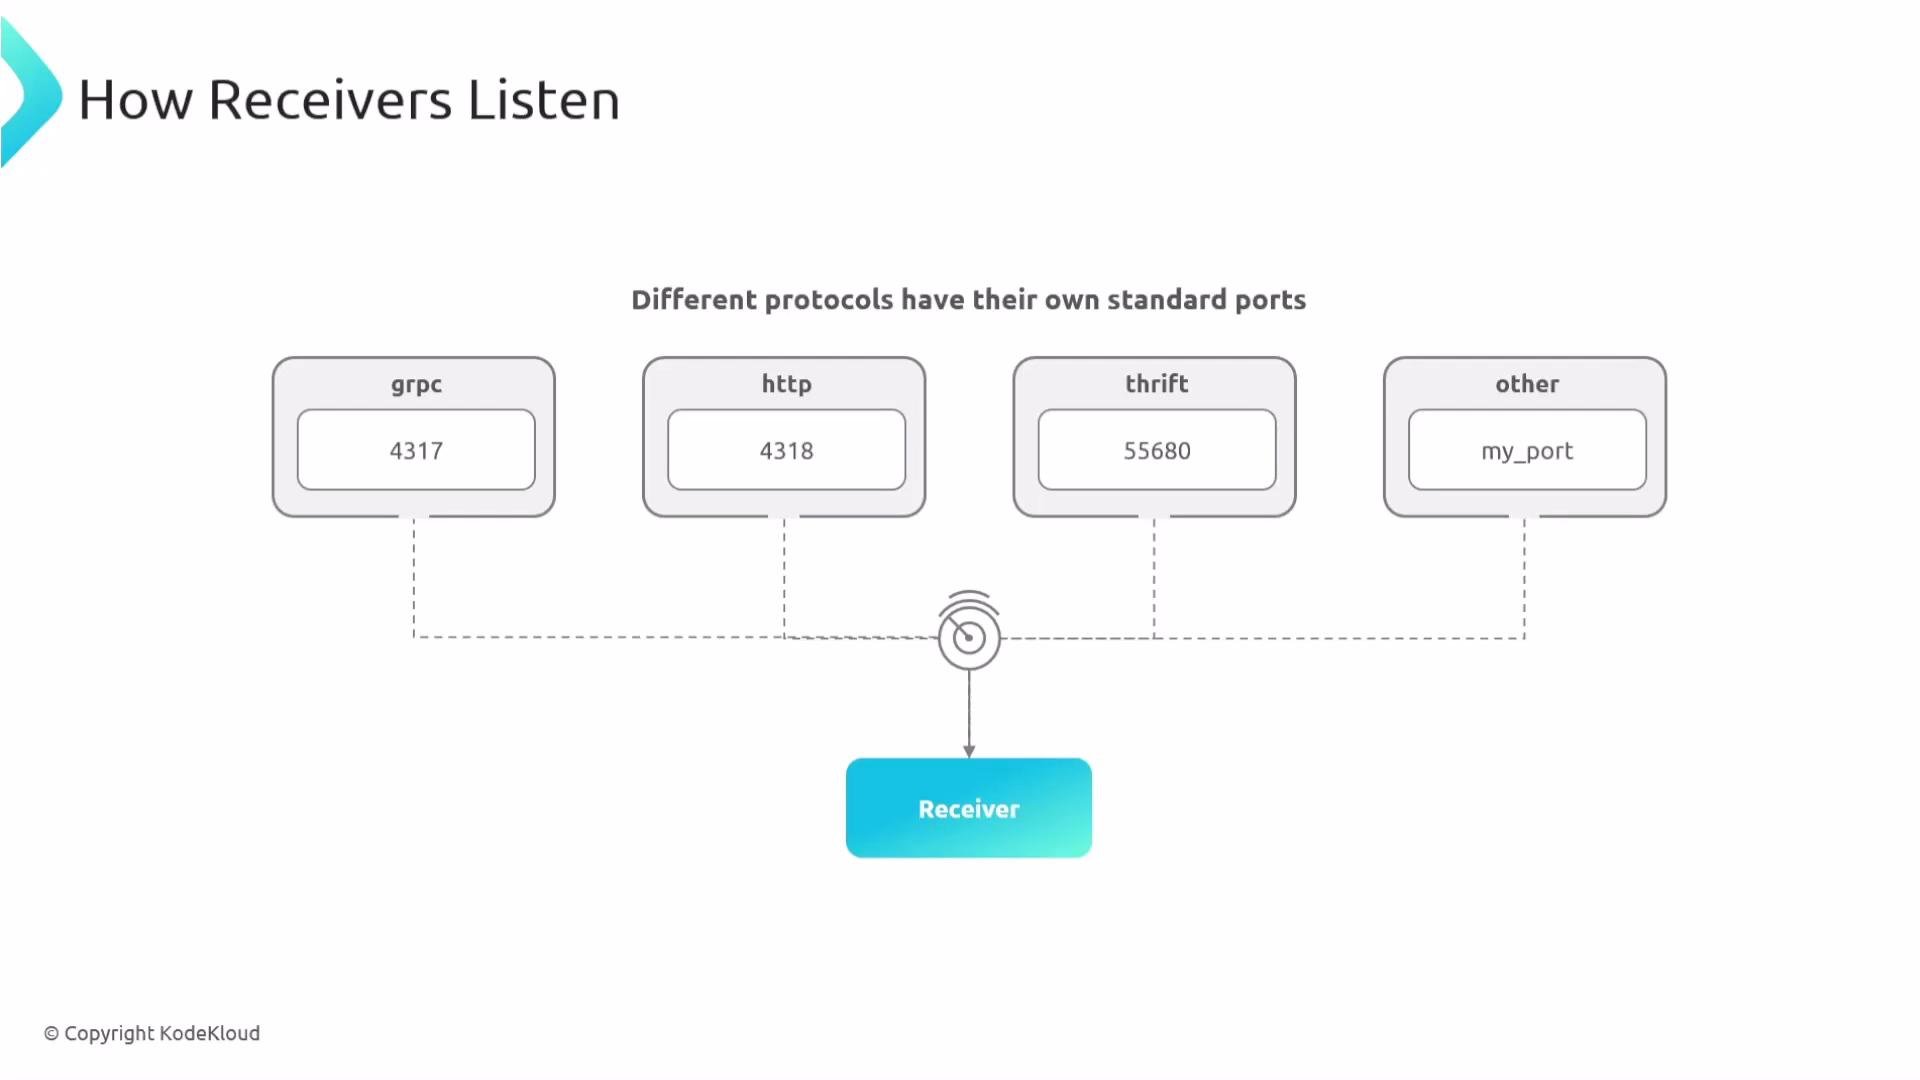
receivers: key. For example, the Collector can expose OTLP endpoints, scrape Prometheus metrics, and tail log files concurrently:
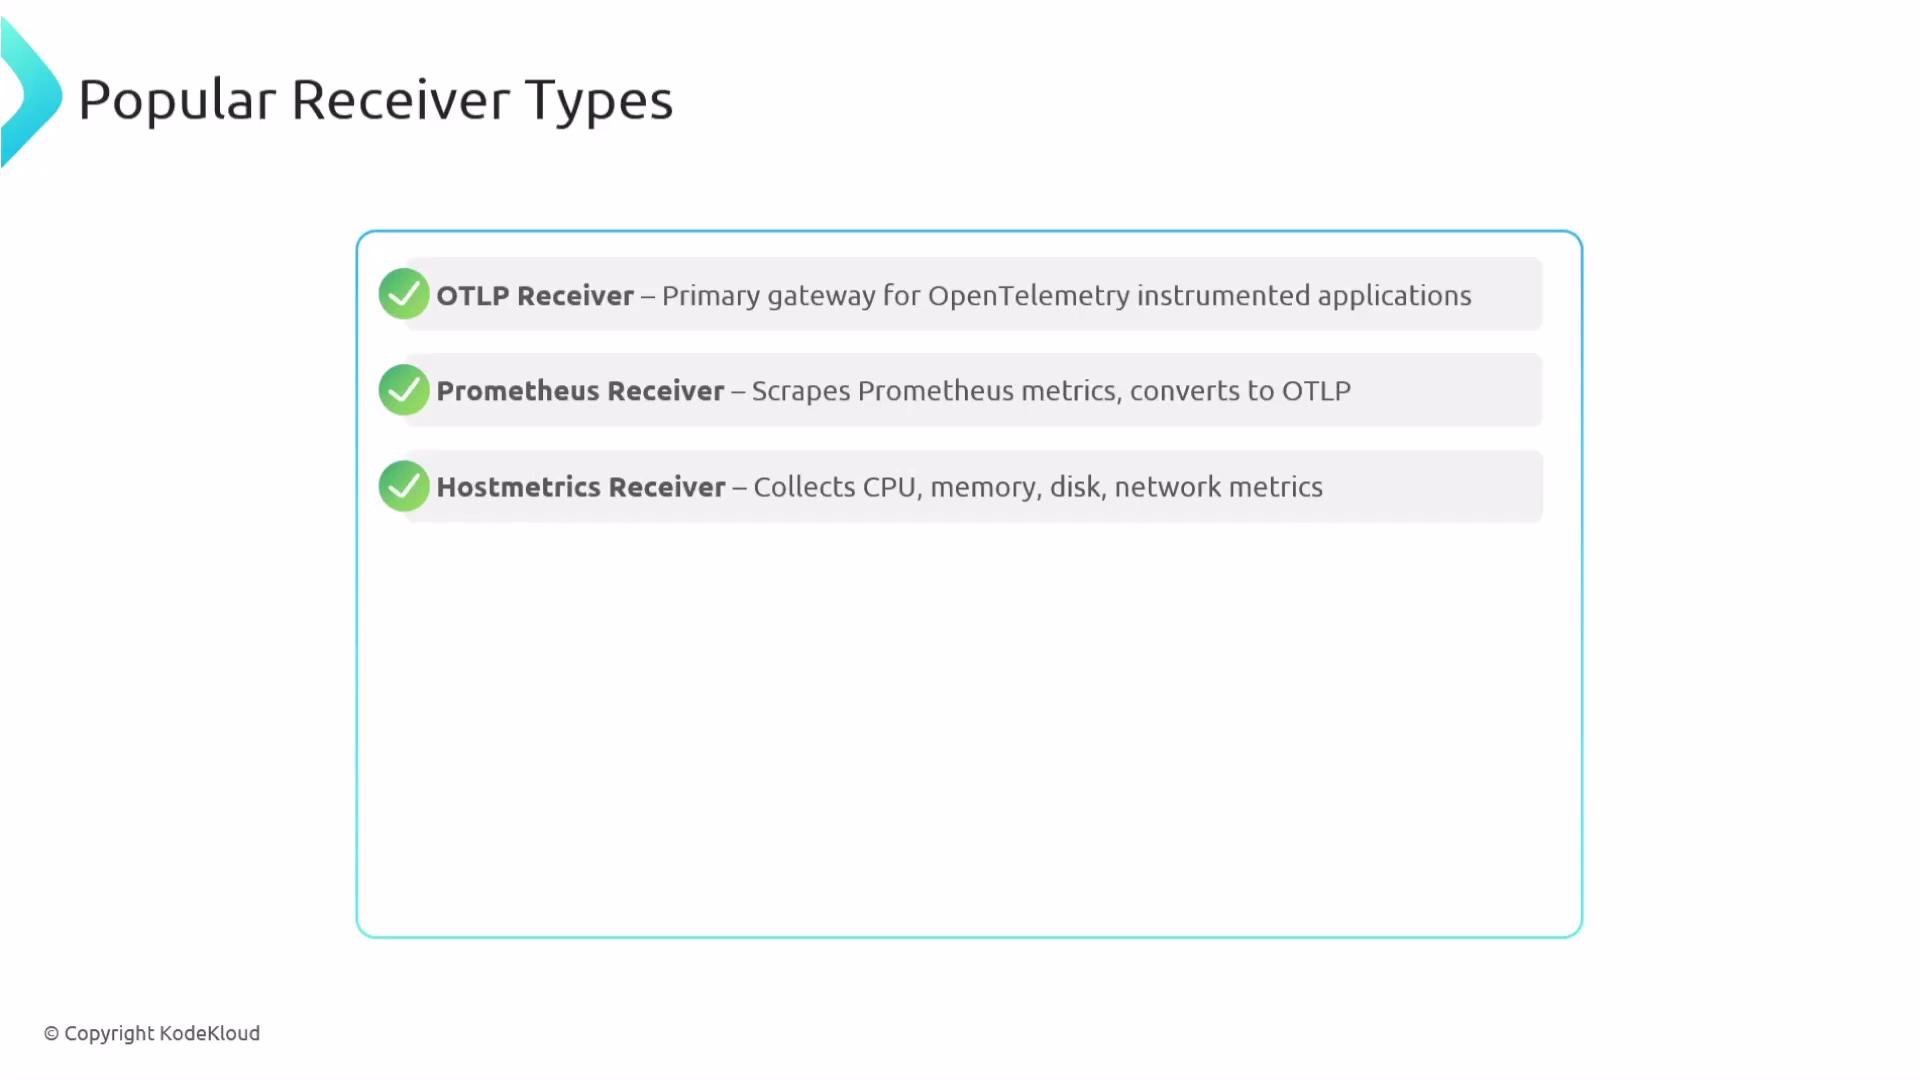
OTLP receiver
- Primary gateway for instrumented apps.
- Accepts OpenTelemetry Protocol data via gRPC and HTTP for traces, metrics, and logs (same endpoint for all signal types).
- Scrapes metrics from Prometheus endpoints and forwards them as OTLP.
- Uses standard Prometheus-style config and service discovery.
- Collects system-level metrics (CPU, memory, disk, network).
- Useful when running the Collector as an agent to capture host performance.
- Pulls pod- and container-level metrics directly from the kubelet on each node.
- Typically run as a DaemonSet so each Collector instance can contact its local kubelet.
- Gathers cluster-wide metrics and node conditions by querying the Kubernetes API.
- Best run as a Deployment (single replica) to avoid duplicate cluster-level data.
- Captures Kubernetes objects (events, pods, services) as structured logs or telemetry.
- Run as a Deployment with one replica to prevent duplicate events.
Run node-level receivers (like kubeletstats) as DaemonSets. Run cluster-level receivers (like k8s_cluster and k8sobjects) as a Deployment with one replica to avoid duplicate data.
- Tails log files, supports compressed files, handles rotations, and persists file positions across restarts.
- Reads logs from systemd journal units and supports filtering by unit and log level.
- Useful for collecting system and container logs on Linux hosts.
- Listens for syslog messages over TCP or UDP (RFC formats).
- Common for network devices, firewalls, and centralized syslog collection.
- Polls network or IoT devices via SNMP to collect metrics (e.g., uptime, interface counters).
- Accepts traces from Jaeger clients/agents and translates them to OTLP — useful when migrating from Jaeger.
- Receives Zipkin spans (V1/V2 JSON) and converts them into OTLP for unified processing.
- Ingests telemetry from applications still using OpenCensus and converts traces and metrics to OTLP.
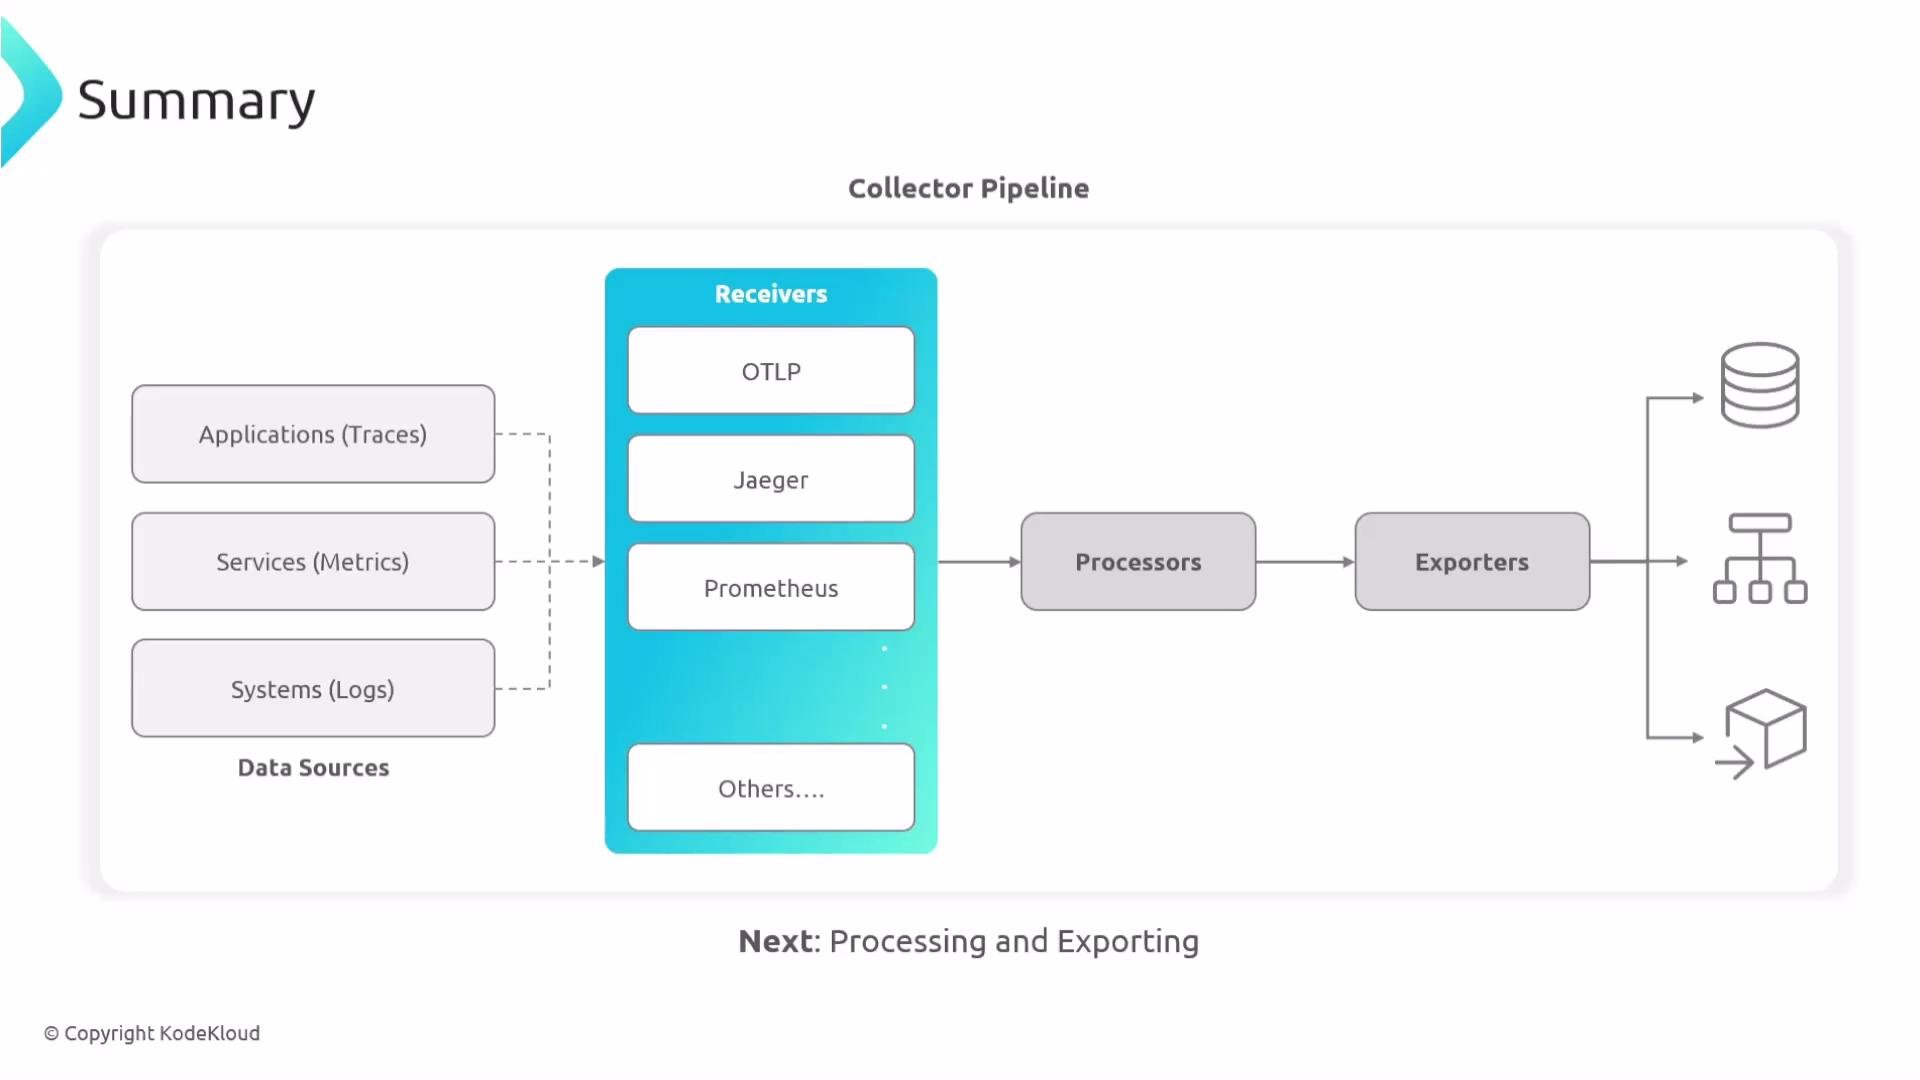
opentelemetry-collector-contrib repository) beyond those shown here — including integrations for legacy protocols and vendor-specific sources. Receivers are the starting point of your telemetry journey: they listen, collect, and translate incoming telemetry so the rest of your Collector pipeline can process and export it reliably.
References and further reading
That’s all about receivers.