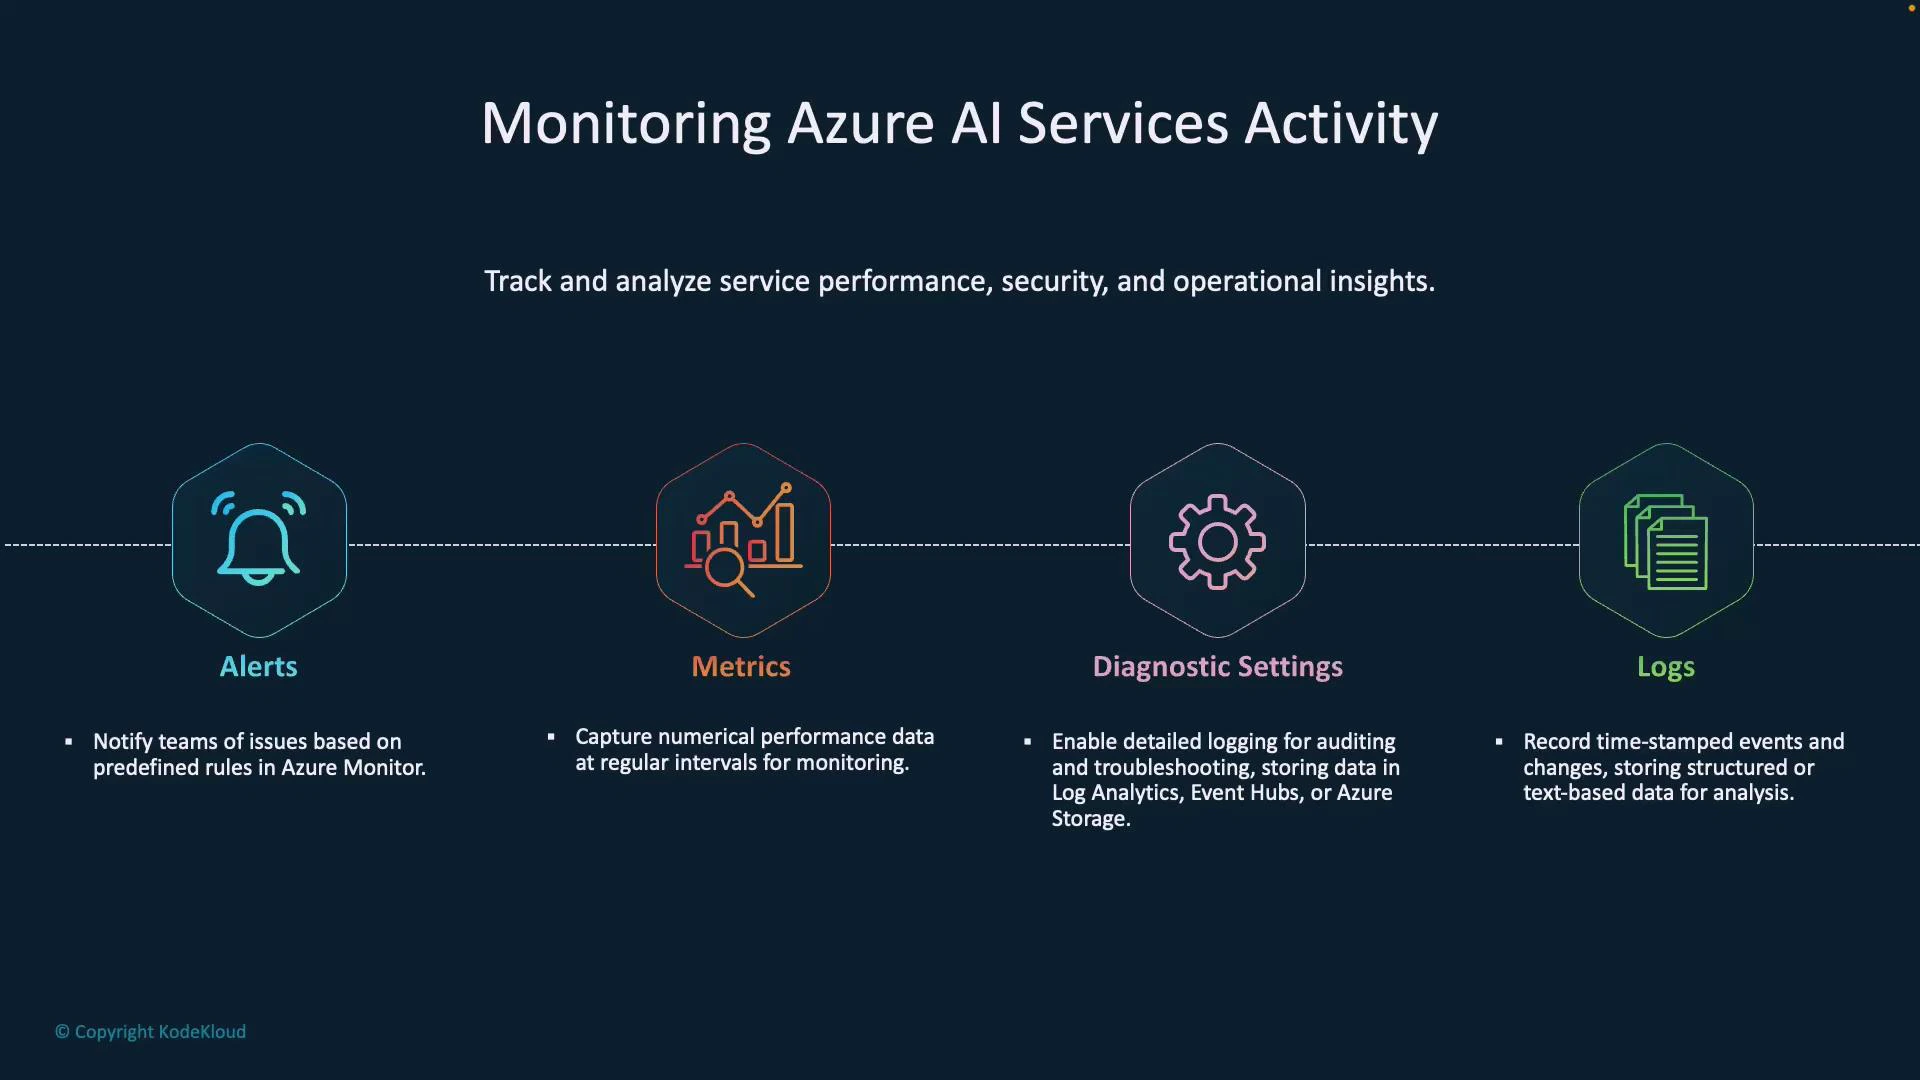
Locate Metrics in the Azure portal
Steps to view metrics for a Cognitive Services / Azure AI resource:- In the Azure portal, open your Cognitive Services or specific Azure AI resource (e.g., Language service).
- In the left-hand menu navigate to Monitoring > Metrics.
- Select a metric (Total Calls, Latency, Throttled Requests, etc.), choose aggregation (Sum, Average, Count), and set the time range.
- Add additional metrics to the chart to compare trends and spot correlations.
- Combine related metrics (e.g., Total Calls + Throttled Requests) to detect capacity or throttling issues.
- Pin metrics charts to Azure dashboards for consolidated operational views.
- Use appropriate aggregations for your scenario (Sum for totals, Average/Percentile for latency).
Diagnostic settings and Logs
Diagnostic settings determine where resource logs and metrics are exported for deeper analysis, retention, or integration with SIEMs. What diagnostic settings can export:- Resource logs: request/response logs and resource-specific events.
- Platform metrics (where applicable).
- Activity and audit logs for Azure AI capabilities (for example, Azure OpenAI request usage).
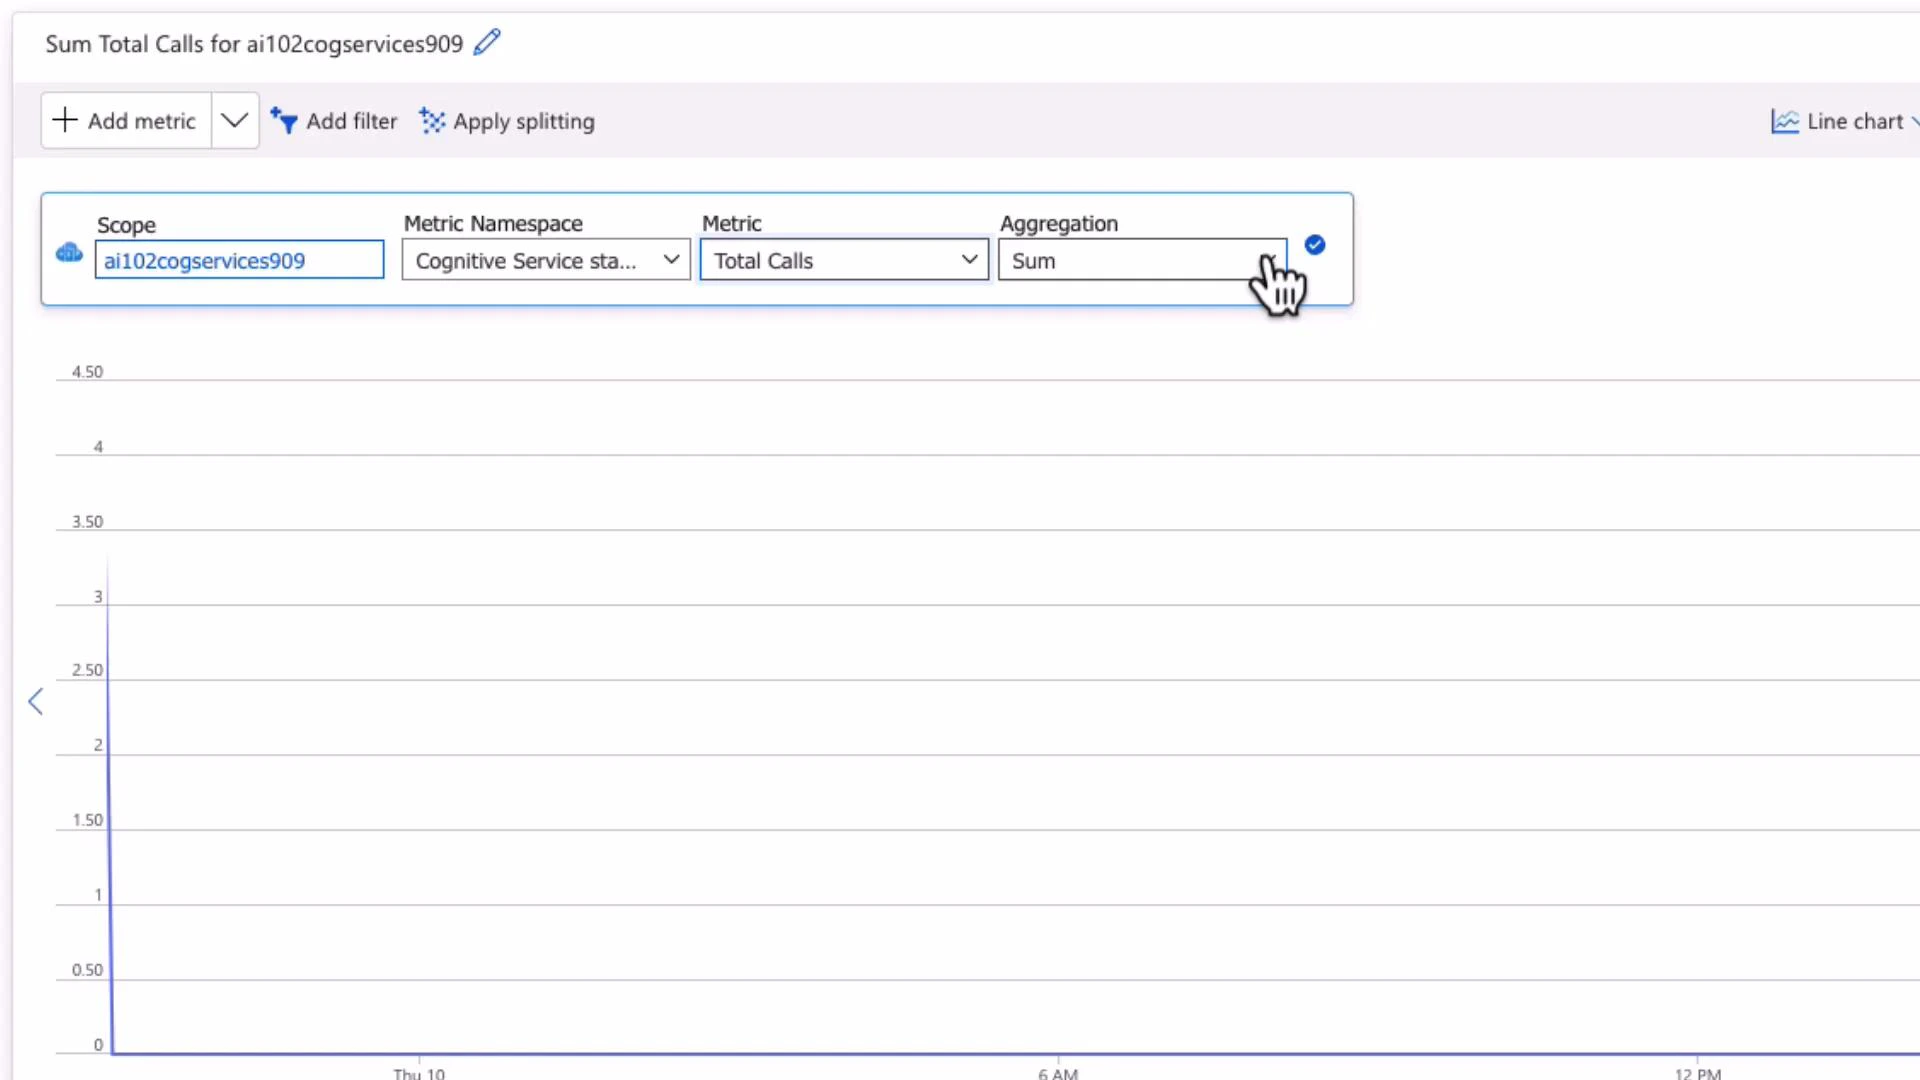
To configure diagnostic settings:
- Open your resource in the Azure portal.
- Select Diagnostic settings > Add diagnostic setting.
- Choose the log categories you need (Audit Logs, Request and Response Logs, Trace Logs, Azure OpenAI Request Usage, etc.).
- Select one or more destinations (Log Analytics, Storage, Event Hub, Partner).
- Save the diagnostic setting.
Diagnostic Settings do not automatically send logs anywhere — you must create a diagnostic setting and choose a destination (Log Analytics, Storage, Event Hub, etc.) to collect logs for analysis and retention.
- Perform forensics and investigations (who accessed what and when).
- Satisfy compliance and retention requirements.
- Create custom dashboards and log-based alert rules.
Carefully consider data sensitivity before exporting request/response logs. Avoid sending Personally Identifiable Information (PII) or secrets to destinations unless you have proper data governance and encryption in place.
Alerts: detect and respond
Azure Monitor alerts let you create rules that notify teams or trigger automation when metrics or logs meet defined conditions. Alert types:
Typical alert rule workflow:
- Define the scope (select the resource(s) to monitor).
- Define the condition (metric threshold or KQL query and evaluation frequency).
- Define actions by associating an Action Group (email, SMS, webhook, Logic App, Azure Function, Teams, PagerDuty, etc.).
- Provide alert details (severity, description) and create the rule.
- Notify DevOps on usage spikes or quota exhaustion.
- Trigger automated remediation (e.g., scale-out, restart services).
- Escalate security incidents to on-call via PagerDuty or Teams.
Putting it together
- Metrics: Best for real-time numeric monitoring and dashboards.
- Diagnostic Settings + Logs: Centralize and retain logs for deep analysis, compliance, and alerting using KQL.
- Alerts: Bridge monitoring and operations by notifying teams and invoking automated responses.
- Enable Metrics and pin key charts to an Azure dashboard.
- Configure Diagnostic Settings to send resource logs to a Log Analytics workspace (and archive critical logs to Storage).
- Create log- and metric-based alerts for operational and security thresholds.
- Automate common remediations via Action Groups connected to Logic Apps or Functions.
- Regularly review dashboard trends, alert history, and log queries to refine detection and reduce noise.
Links and further reading
- Azure Monitor documentation
- Diagnostic settings for Azure Monitor
- Kusto Query Language (KQL) quickstart
- Azure Monitor alerts overview