

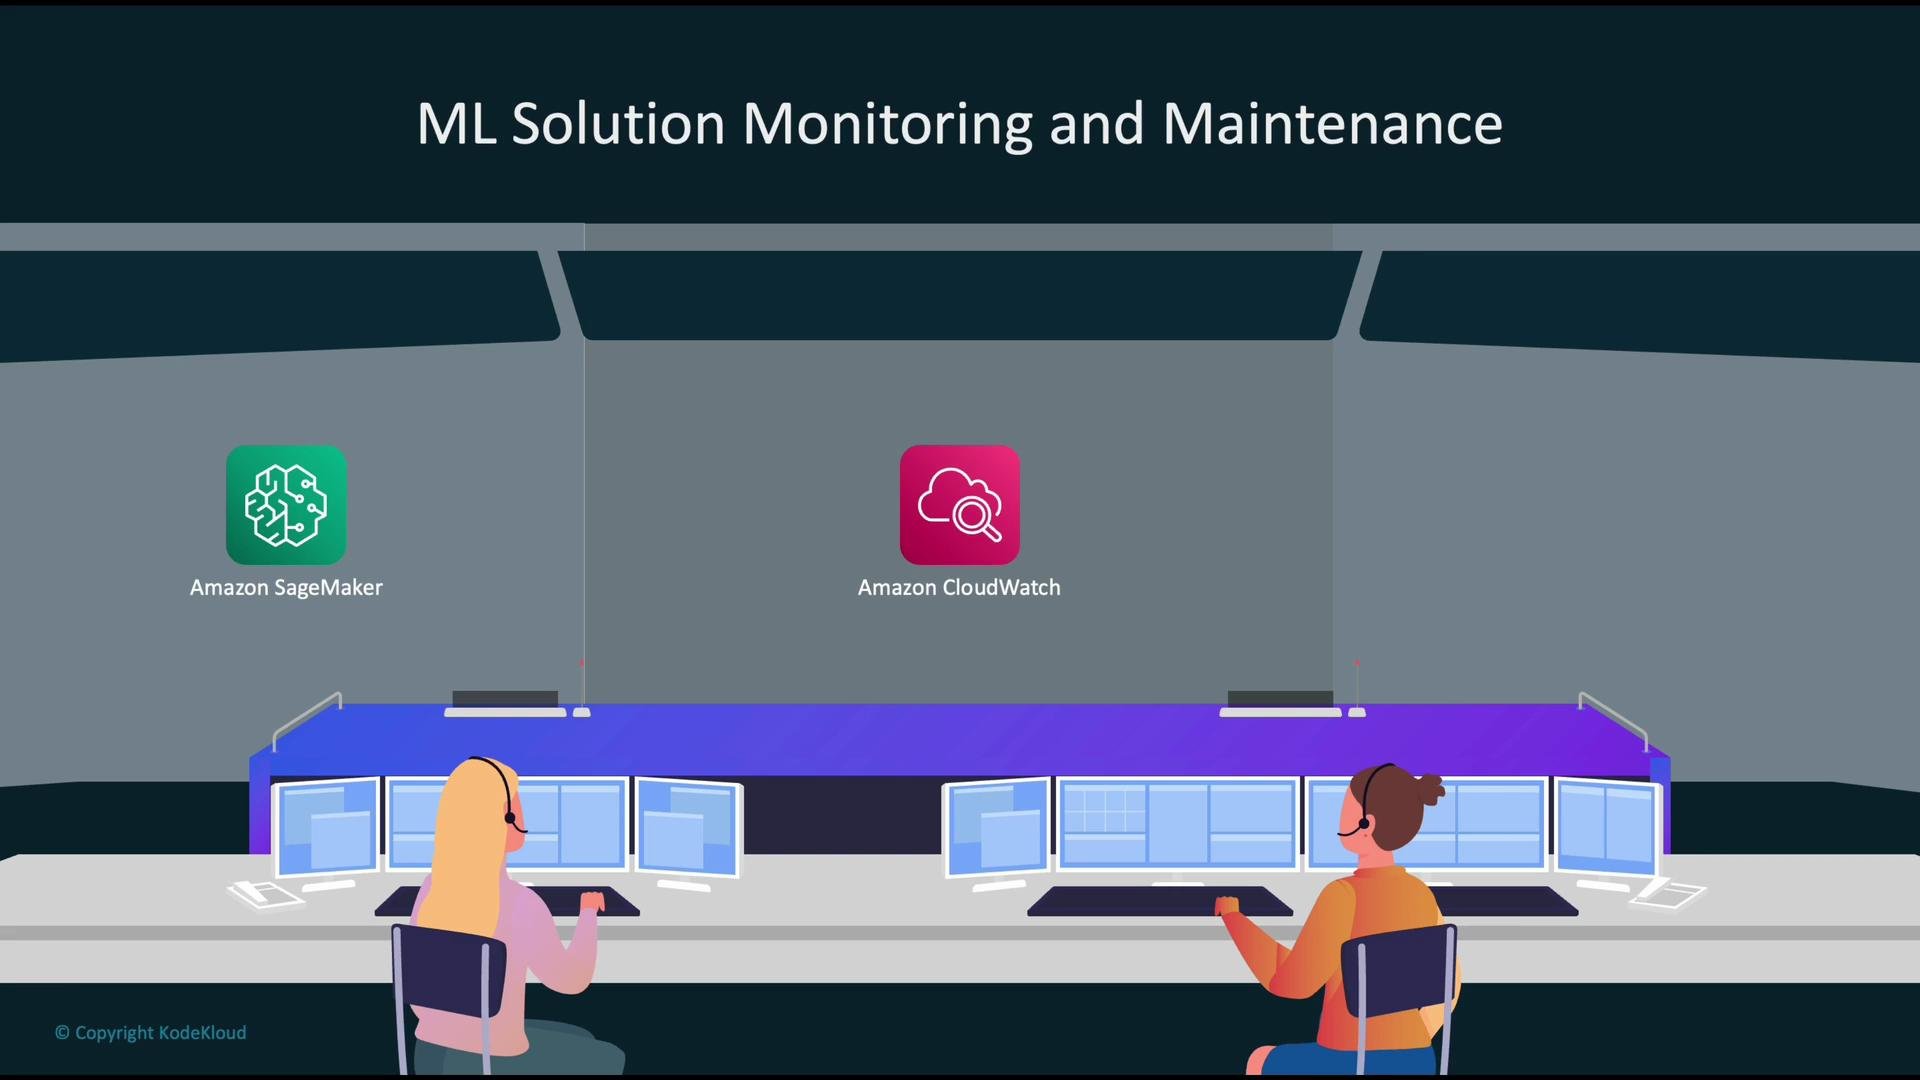
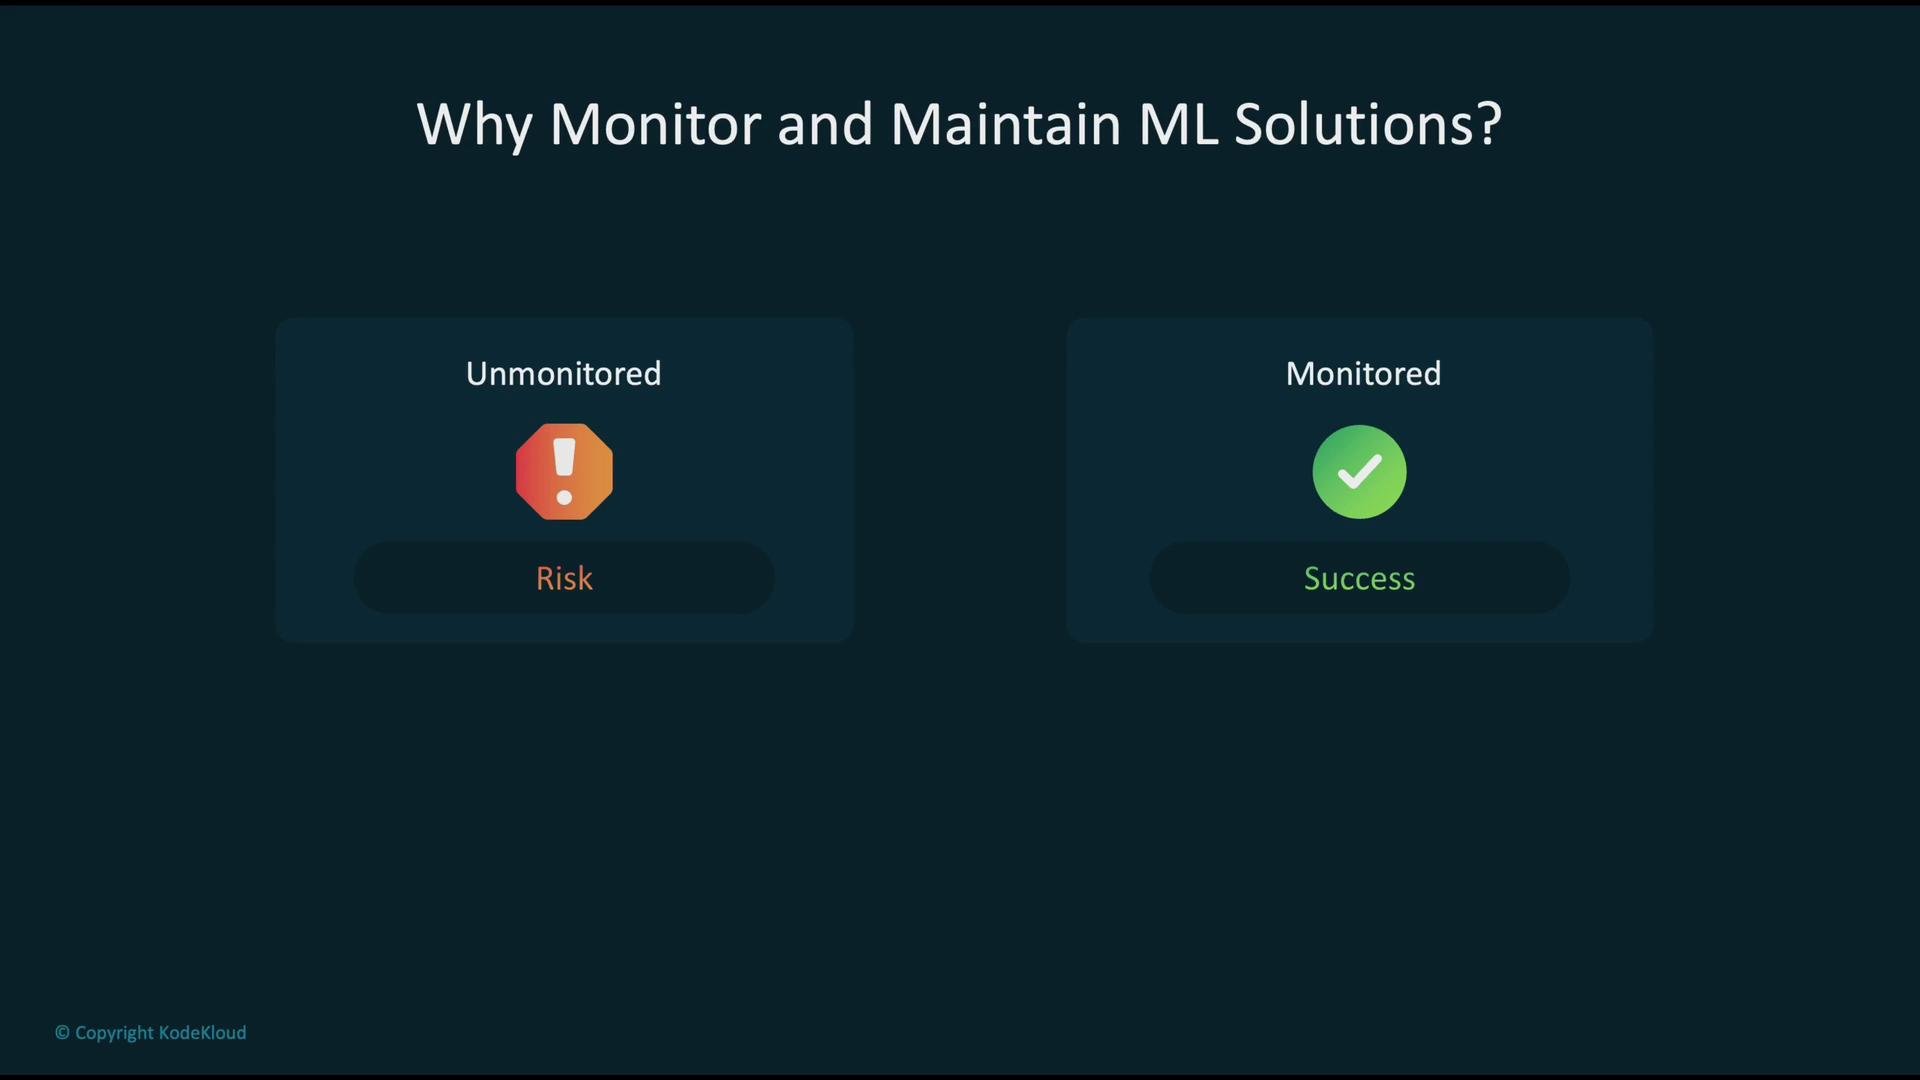
- Models degrade when input data distributions shift, features change, or runtime conditions evolve.
- Without observability, issues remain hidden and increase operational and business risk.
- With monitoring and automated maintenance, you detect problems early and restore expected behavior quickly.
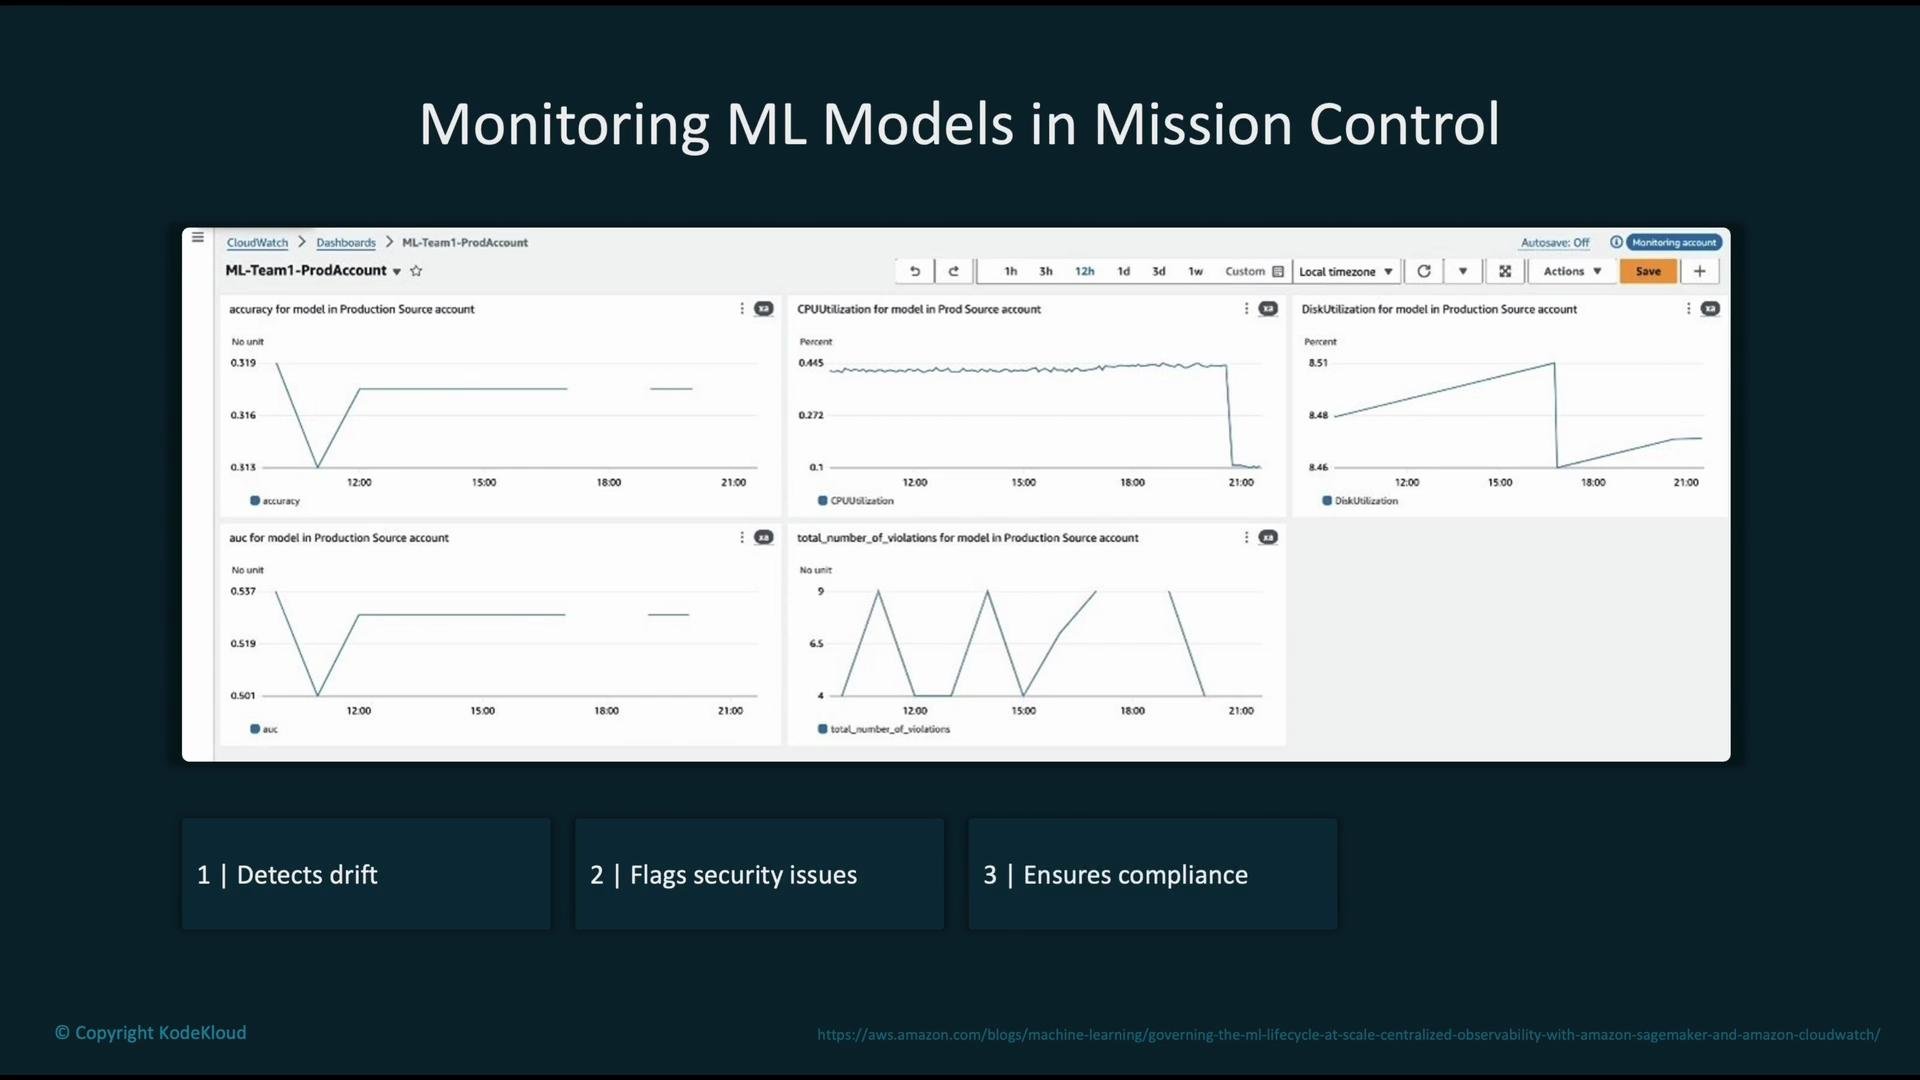
Monitor both model quality (accuracy, AUC, drift) and system health (latency, errors, CPU/memory). Combine SageMaker Model Monitor with CloudWatch metrics and alarms to build an actionable observability stack.
- Host the model with SageMaker endpoints (real-time) or SageMaker Batch Transform (batch).
- Collect operational and business metrics in CloudWatch (latency, error rates, prediction distribution, feature statistics, model quality metrics such as accuracy/AUC).
- Raise CloudWatch alarms or Model Monitor alerts when thresholds or drift are detected.
- EventBridge captures alarms and routes them to automation targets (CodePipeline, Lambda, Step Functions) to perform retraining, validation, and redeployment.
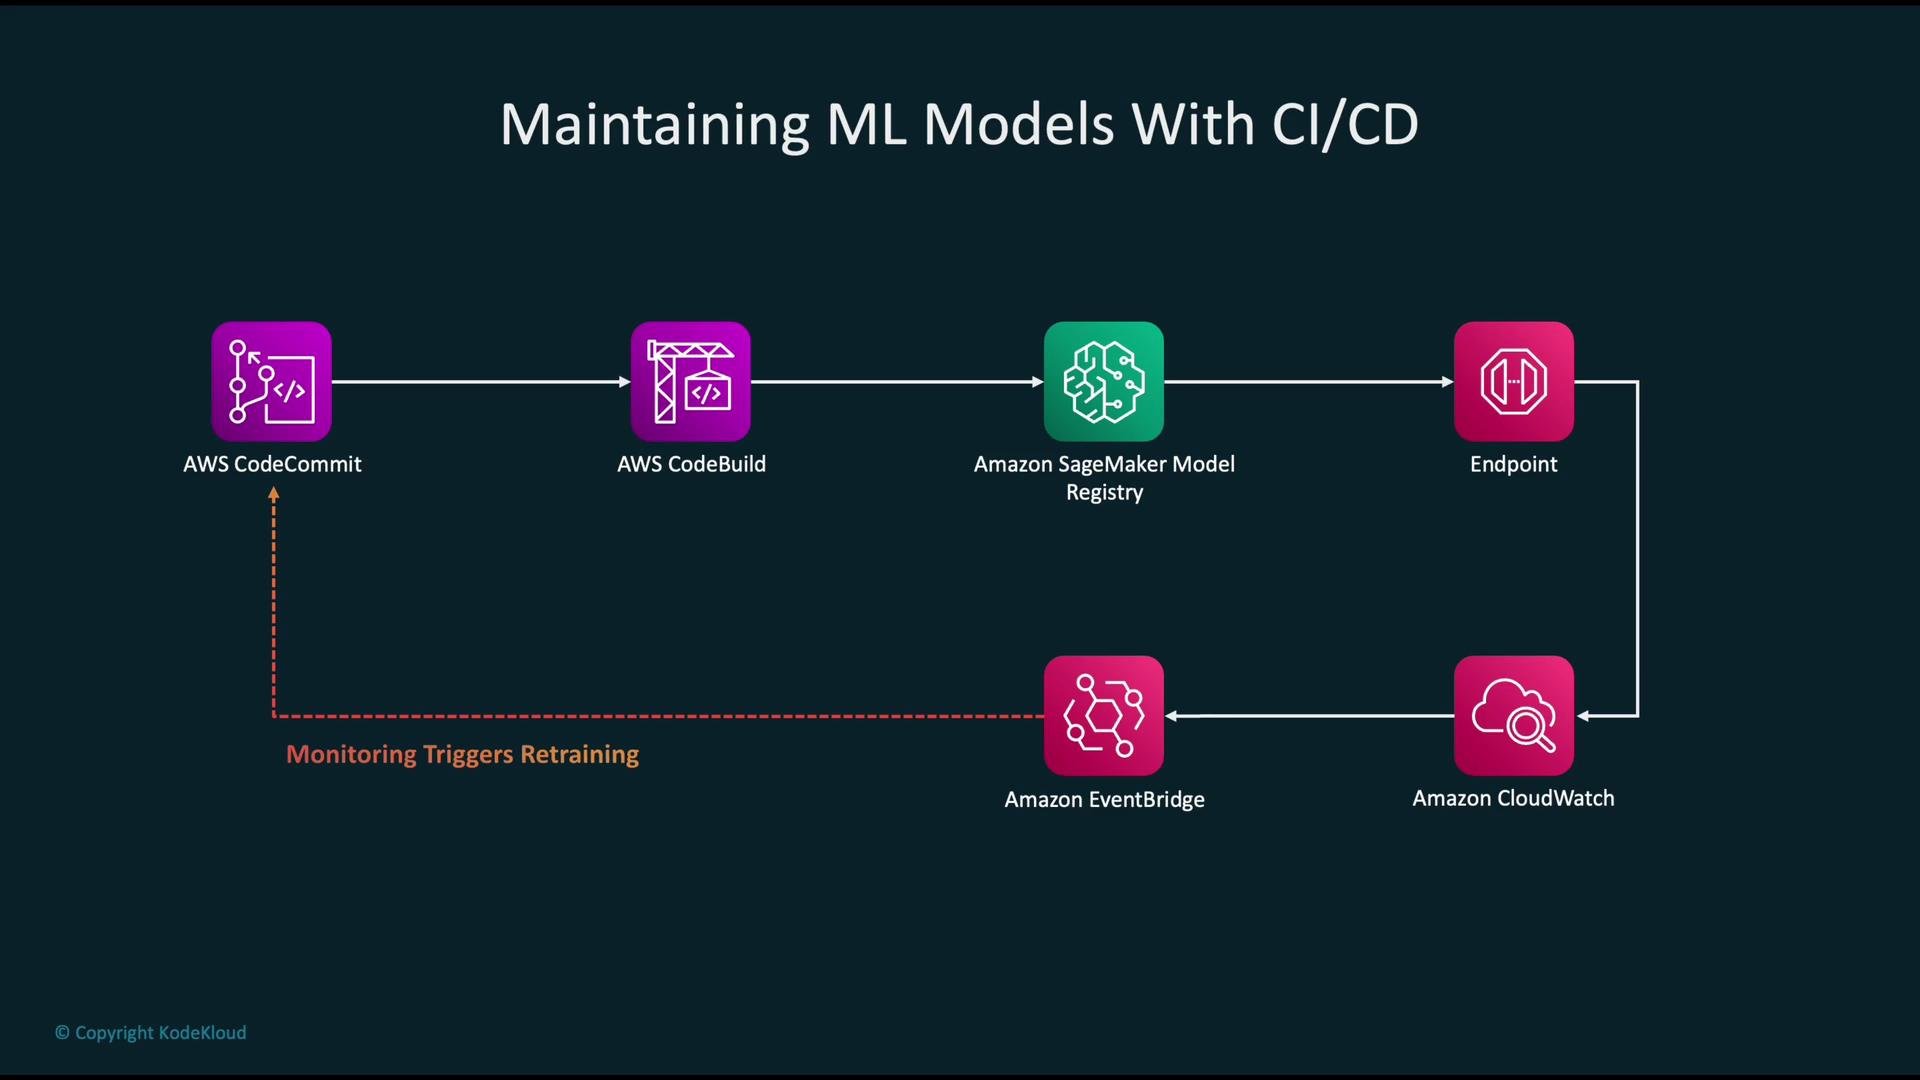
- Store model code and infrastructure-as-code in a source repo (CodeCommit, GitHub).
- Code changes or monitoring-triggered events start CodeBuild / CodePipeline executions to run retraining and evaluation (SageMaker training jobs can be orchestrated from the pipeline).
- When a model passes automated validation, register it in the SageMaker Model Registry.
- Promote approved model versions to production endpoints via the pipeline.
- Continuous monitoring of the live endpoint closes the loop: alarms and drift detections can automatically kick off the retraining/validation/deployment pipeline to produce a new model version.
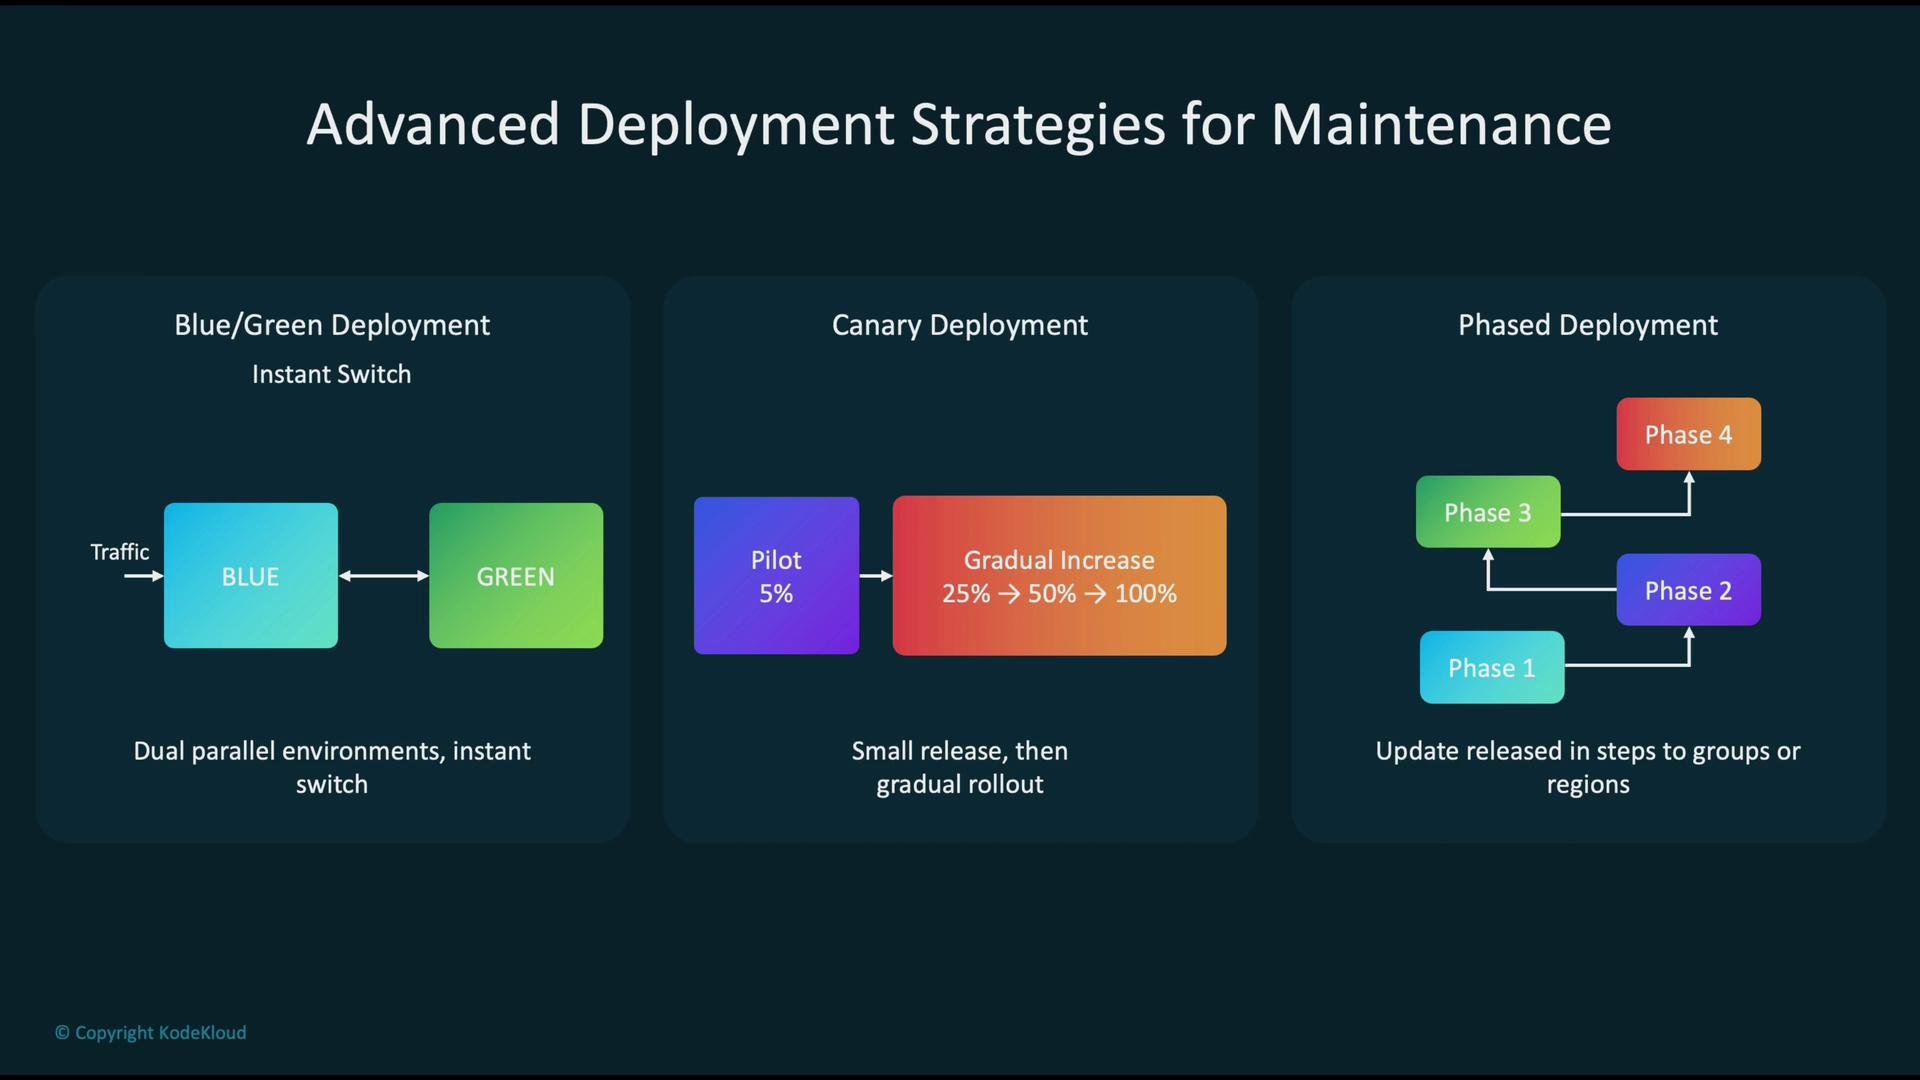
- Expansion — add instances (or increase capacity) as traffic rises.
- Fleet management — balance load, replace unhealthy instances, monitor overall health.
- Contraction — scale down when demand subsides to avoid overprovisioning.
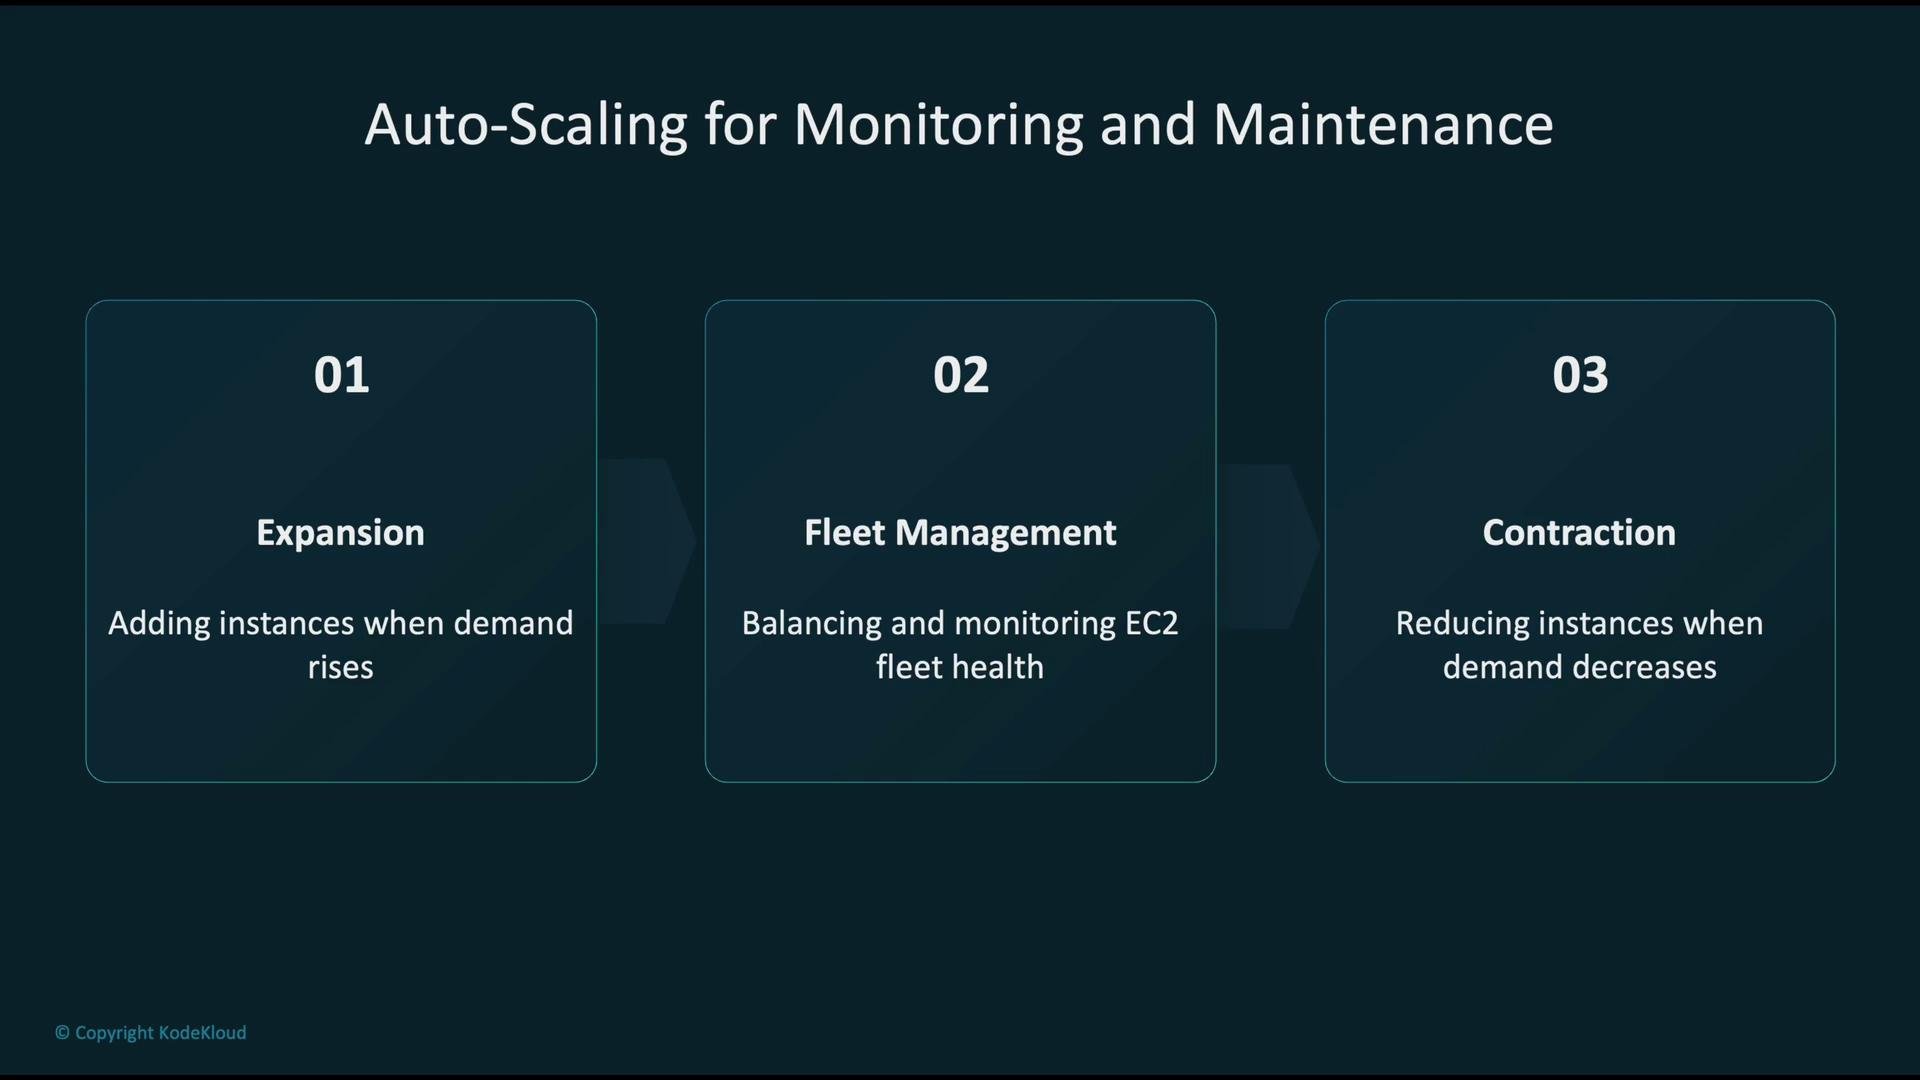
- Data protection — encrypt data at rest and in transit (AWS KMS, TLS).
- Access control — enforce least-privilege IAM policies and role separation.
- Network security — use VPCs, private endpoints, and security groups to avoid public exposure of monitoring traffic.
- Governance and compliance — centralize logs, enable audit trails, and automate compliance checks.
Secure your monitoring pipeline: unprotected logs, endpoints, or automation can expose sensitive data or allow unauthorized model promotions. Use VPC endpoints, strict IAM roles, and encrypted storage.
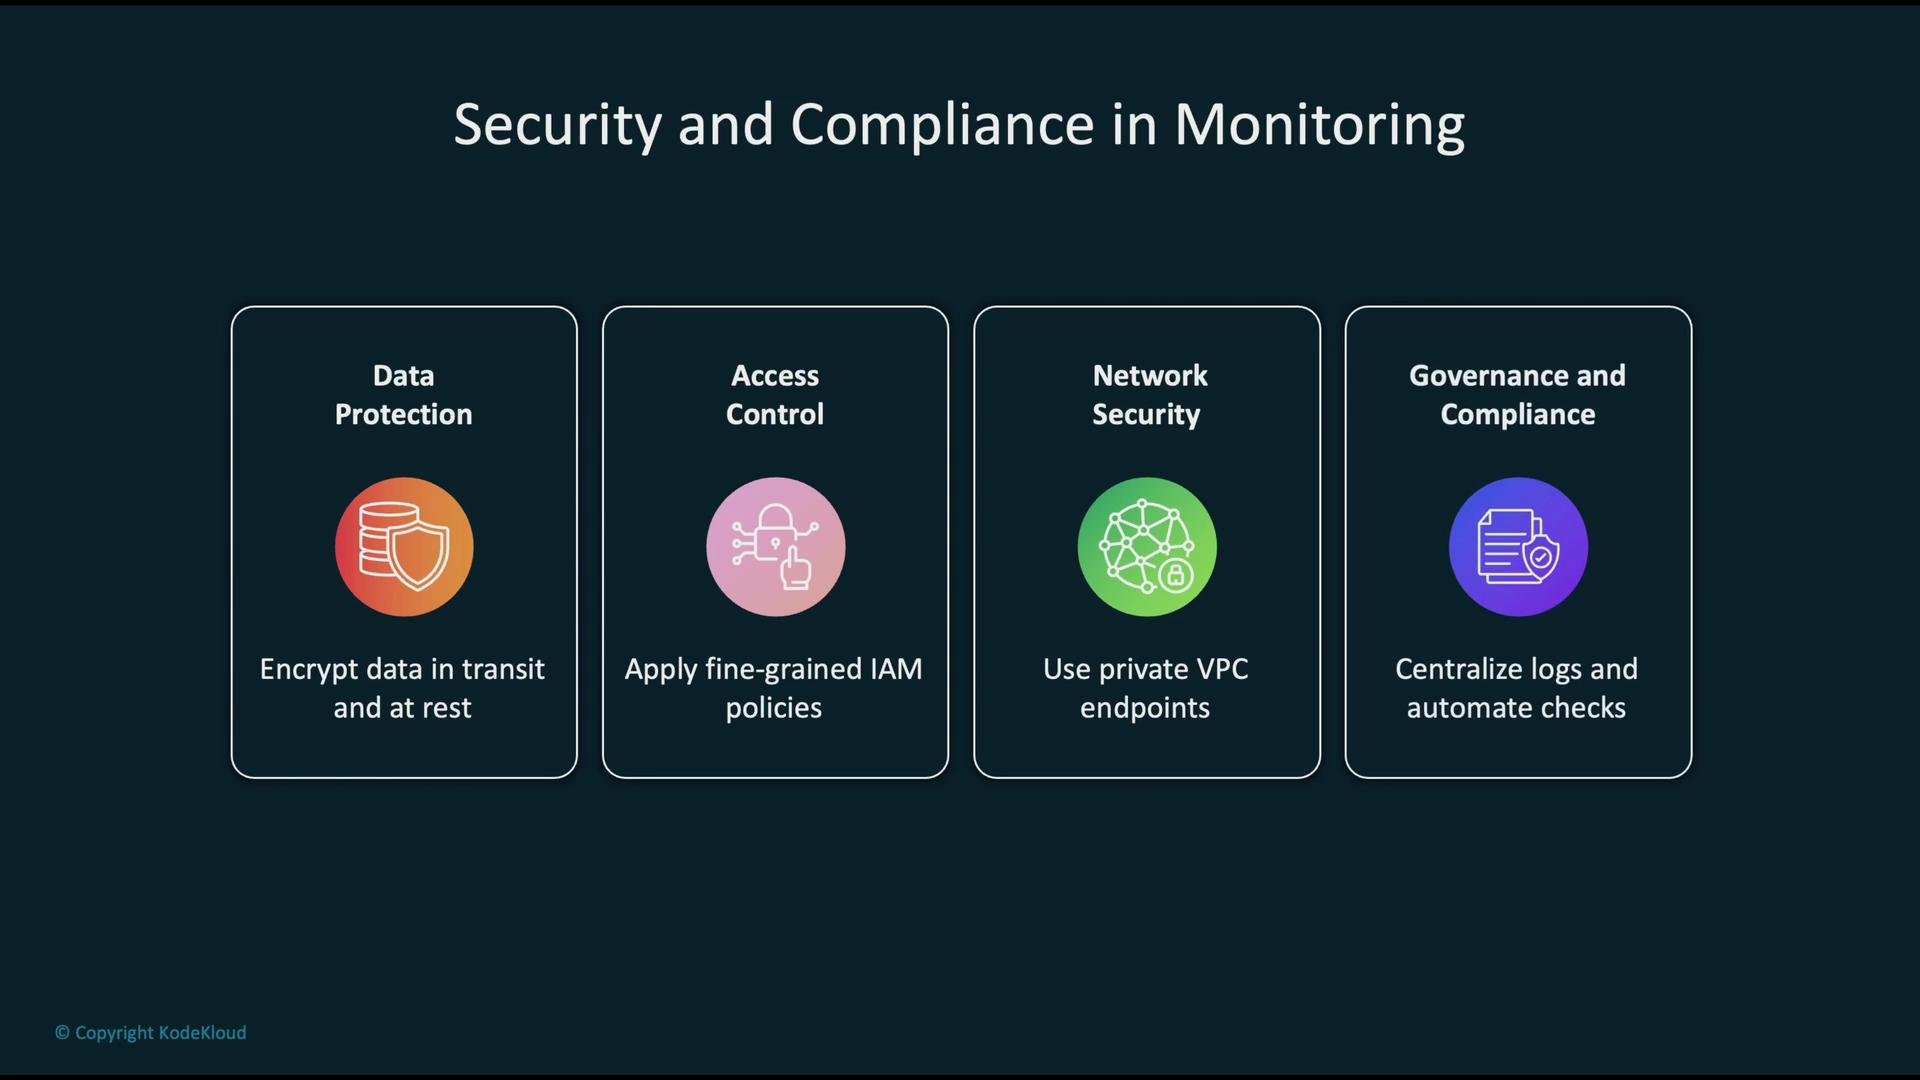
- Right-size SageMaker endpoints and other compute to match traffic patterns (use autoscaling rather than always-on overprovisioning).
- Prefer serverless orchestration (Lambda, EventBridge, Step Functions) for low-traffic automation tasks.
- Minimize custom CloudWatch metrics—use aggregates and efficient logging to reduce metric costs.
- Implement consistent tagging to attribute costs to teams, projects, or environments.
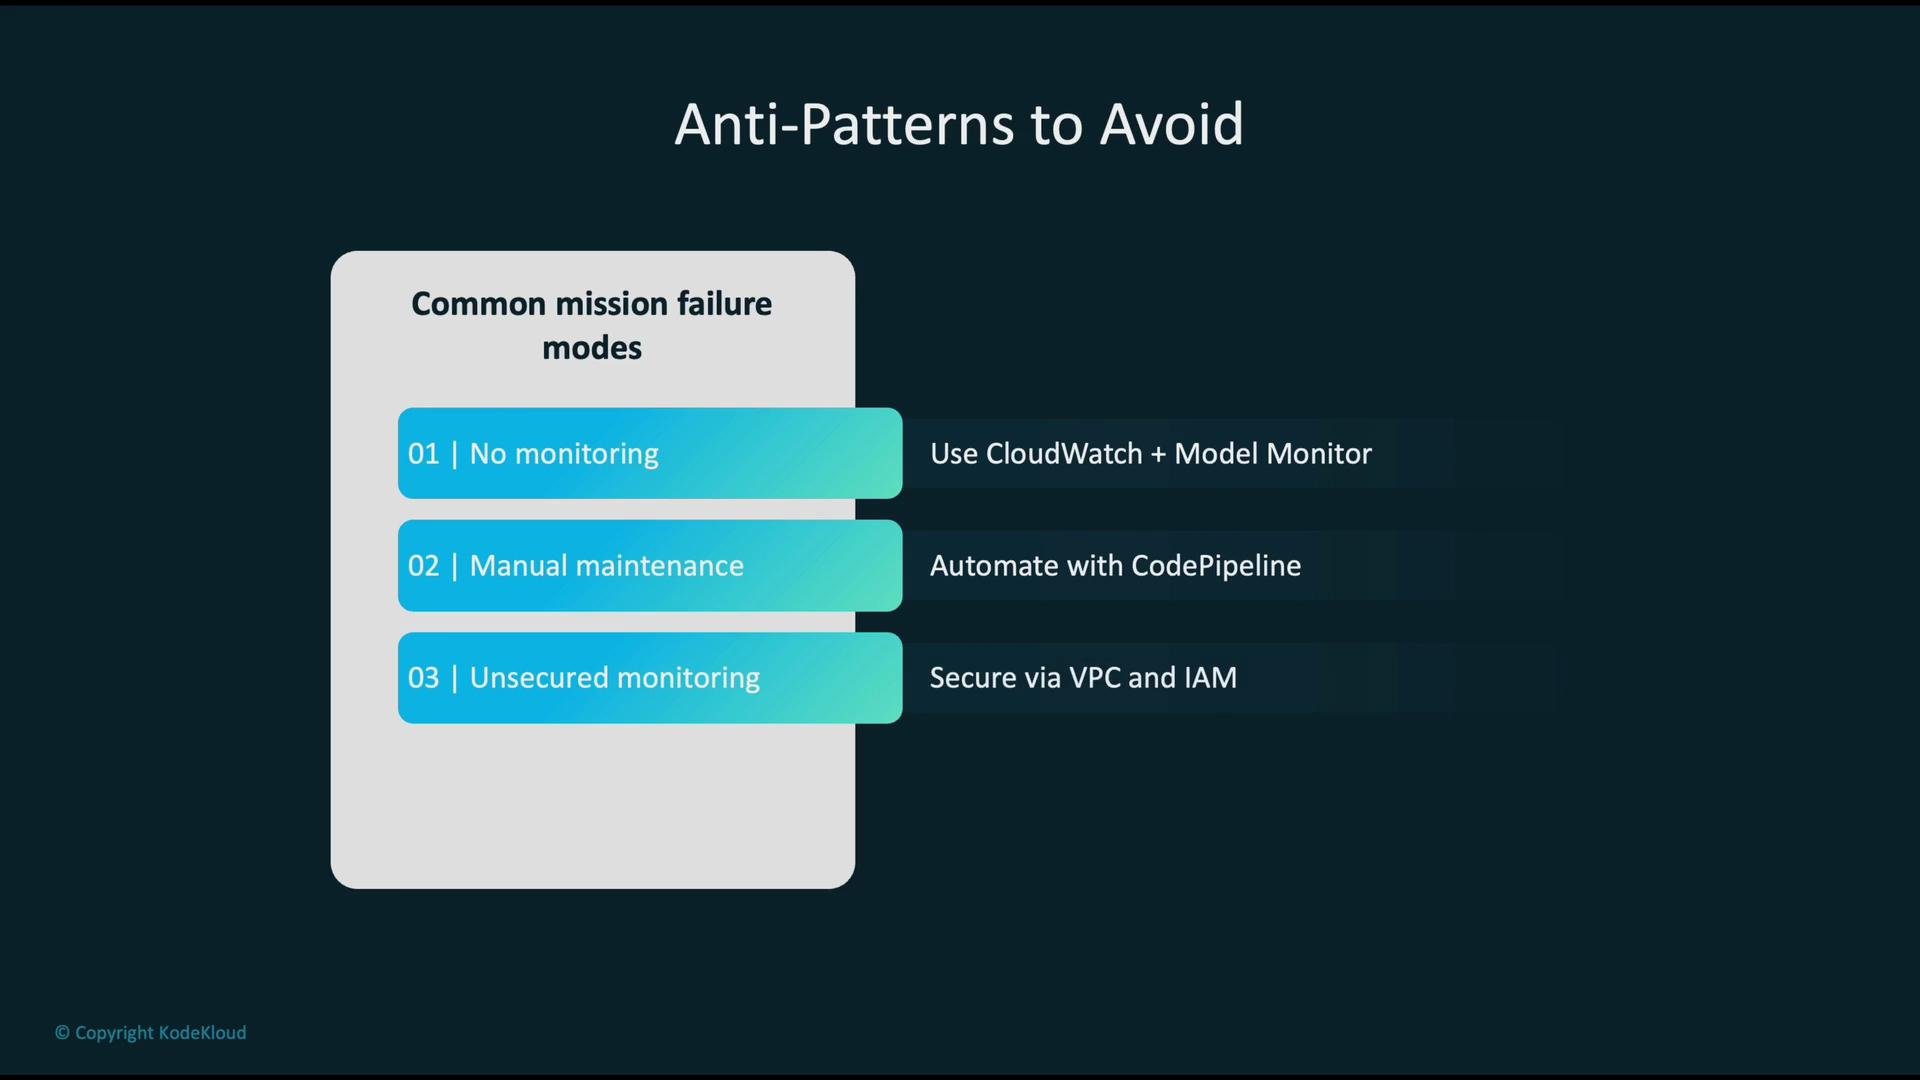
- No monitoring: Models left unobserved are high risk—use CloudWatch and SageMaker Model Monitor.
- Manual-only maintenance: Automate retraining and promotion with pipelines (CodePipeline + CodeBuild + SageMaker).
- Unsecured monitoring: Ensure VPC isolation, private endpoints, and strict IAM for monitoring systems.
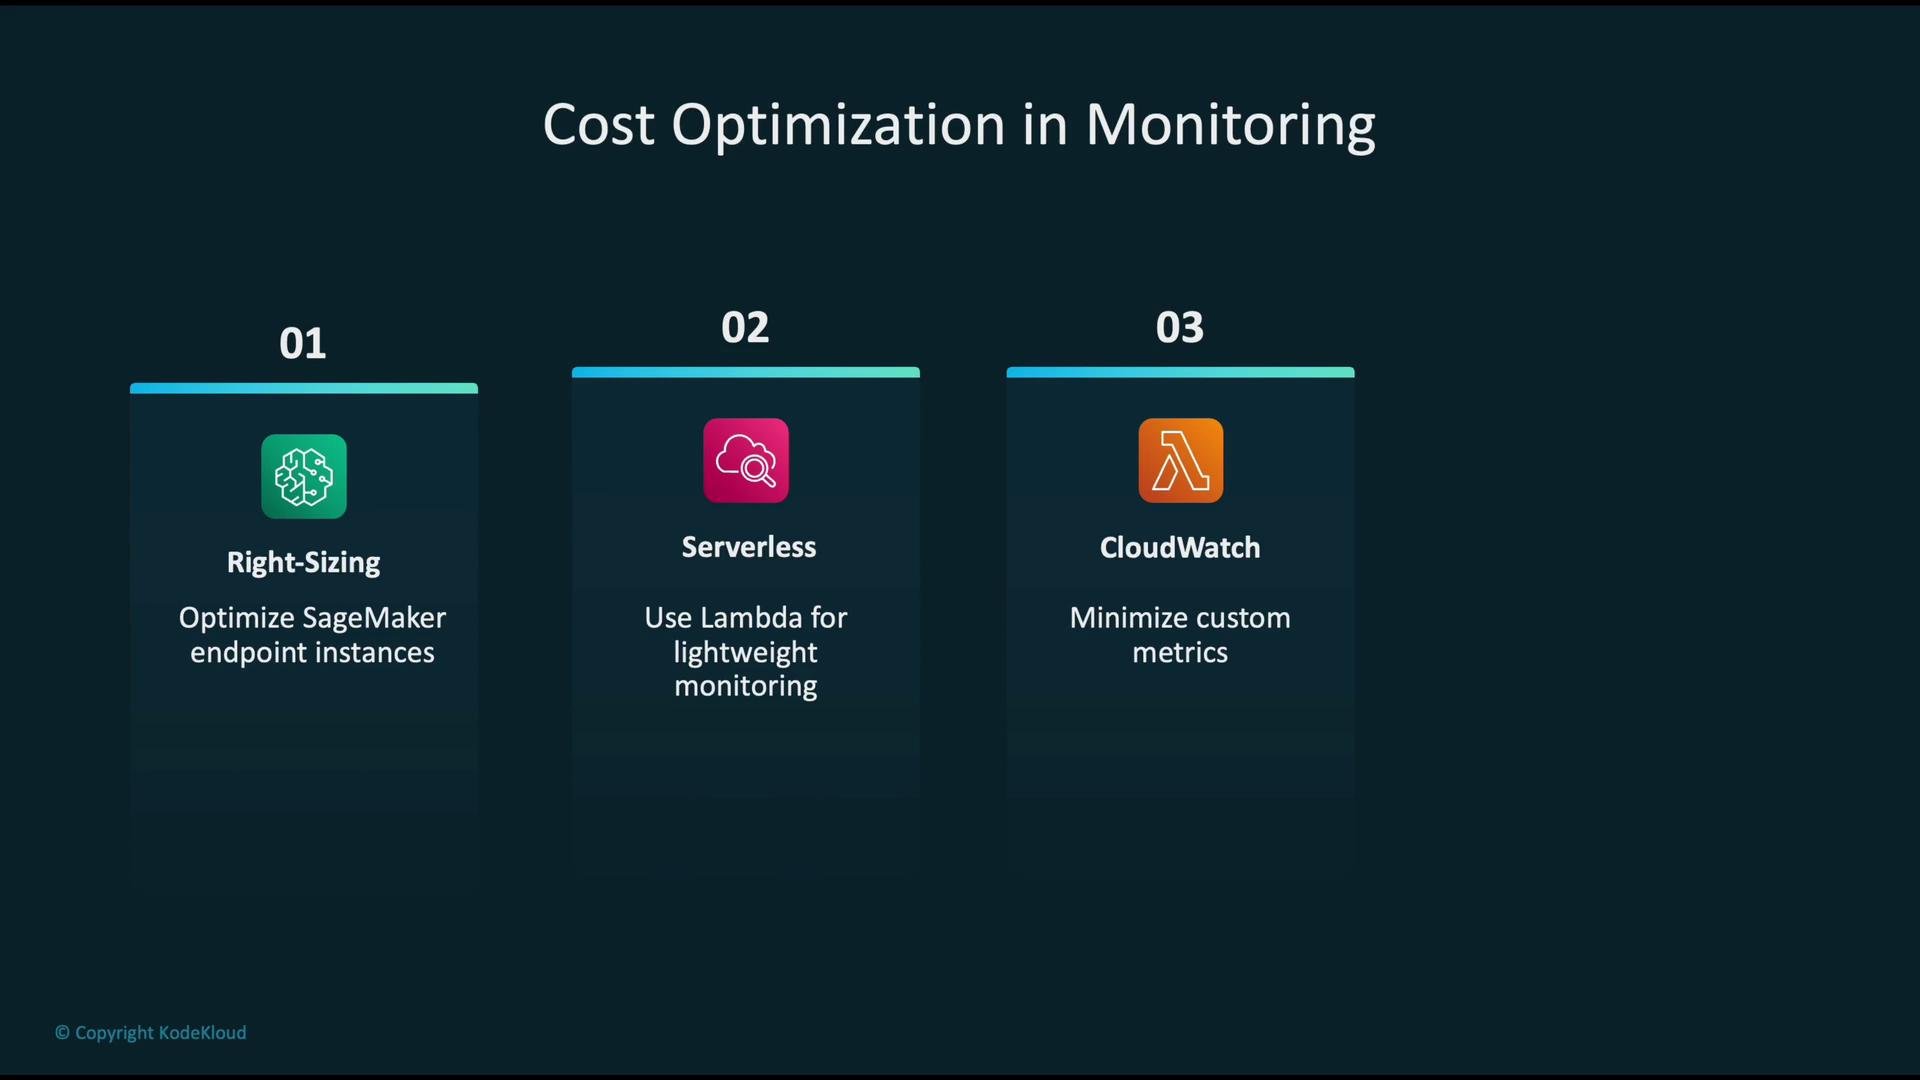
- Over-provisioning endpoints: Use autoscaling and phased rollouts to reduce cost and risk.
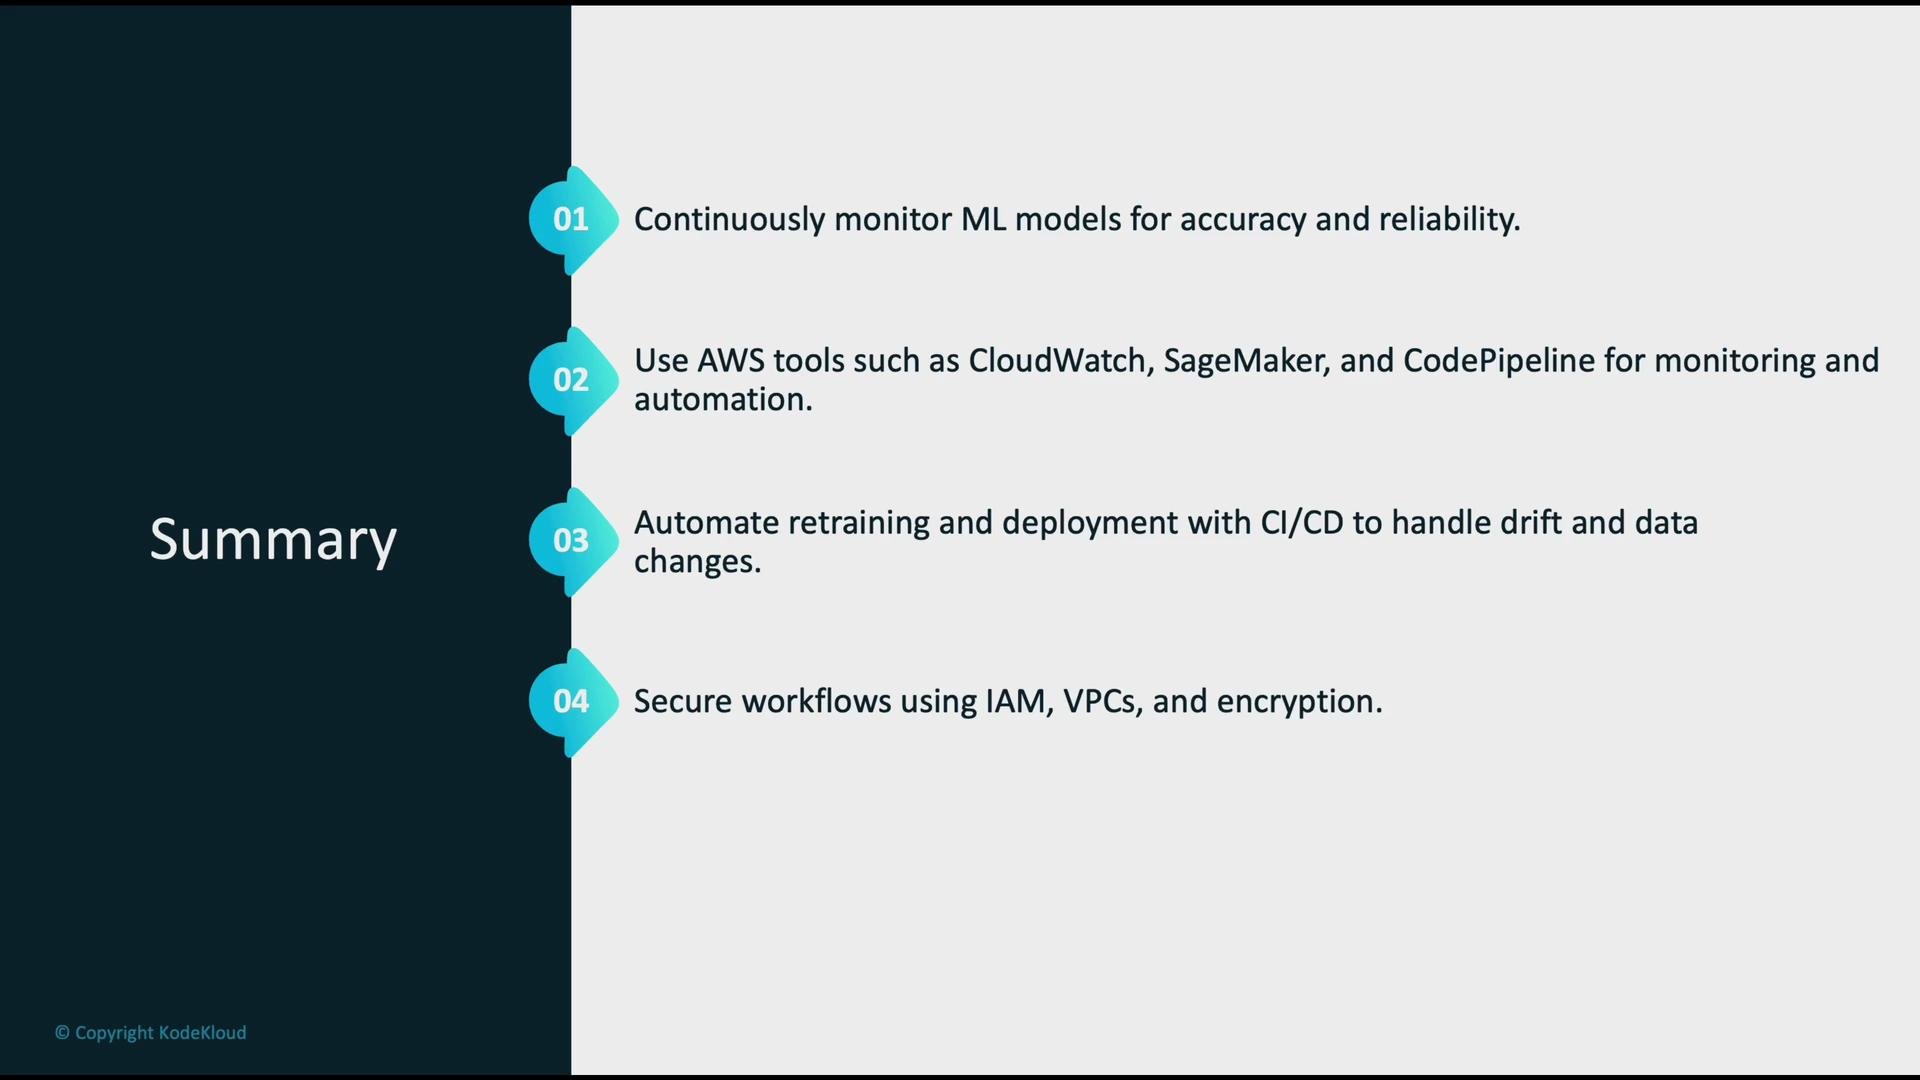
- Monitor ML models in production to detect drift and performance degradation early.
- Use AWS services—SageMaker (Model Monitor & Model Registry), CloudWatch, EventBridge, and CodePipeline—to build an observable, automated maintenance workflow.
- Automate retraining, validation, and deployments via CI/CD to reduce manual effort and accelerate recovery from degradation.
- Protect the monitoring pipeline with strong IAM, VPC isolation, and encryption for data at rest and in transit.
- Amazon SageMaker documentation: https://docs.aws.amazon.com/sagemaker/latest/dg/whatis.html
- Amazon CloudWatch documentation: https://docs.aws.amazon.com/cloudwatch/
- Amazon EventBridge documentation: https://docs.aws.amazon.com/eventbridge/
- SageMaker Model Monitor: https://docs.aws.amazon.com/sagemaker/latest/dg/model-monitor.html
- CI/CD for ML on AWS: https://aws.amazon.com/solutions/implementations/mlops/