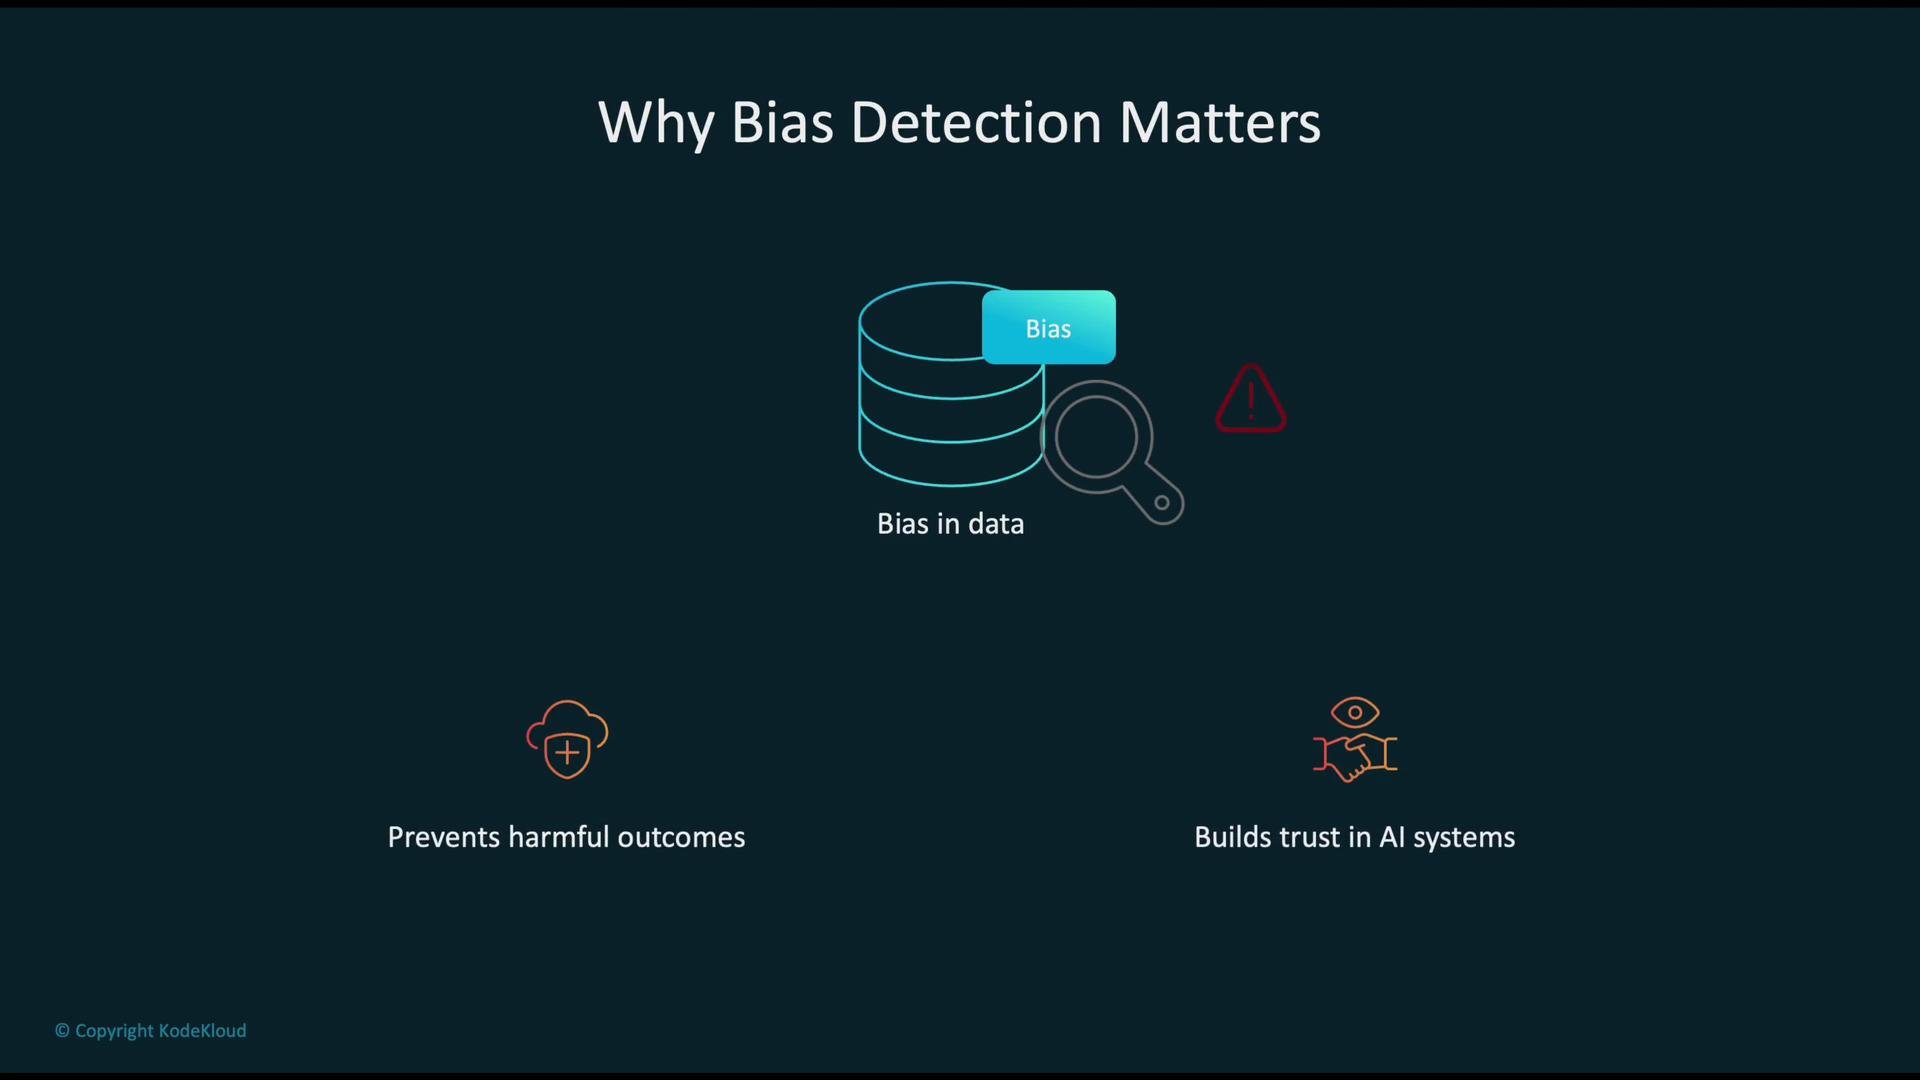
Bias in data produces unfair or discriminatory model predictions. When training data reflects historical or sampling biases, models can learn and amplify those patterns—affecting outcomes in hiring, lending, healthcare, and other high-stakes domains. Detecting bias early reduces harm and increases trust in AI systems.
Use bias detection as an early, repeatable step in your ML pipeline. Combining dataset-level checks with model explainability helps teams find root causes and prioritize remediation.
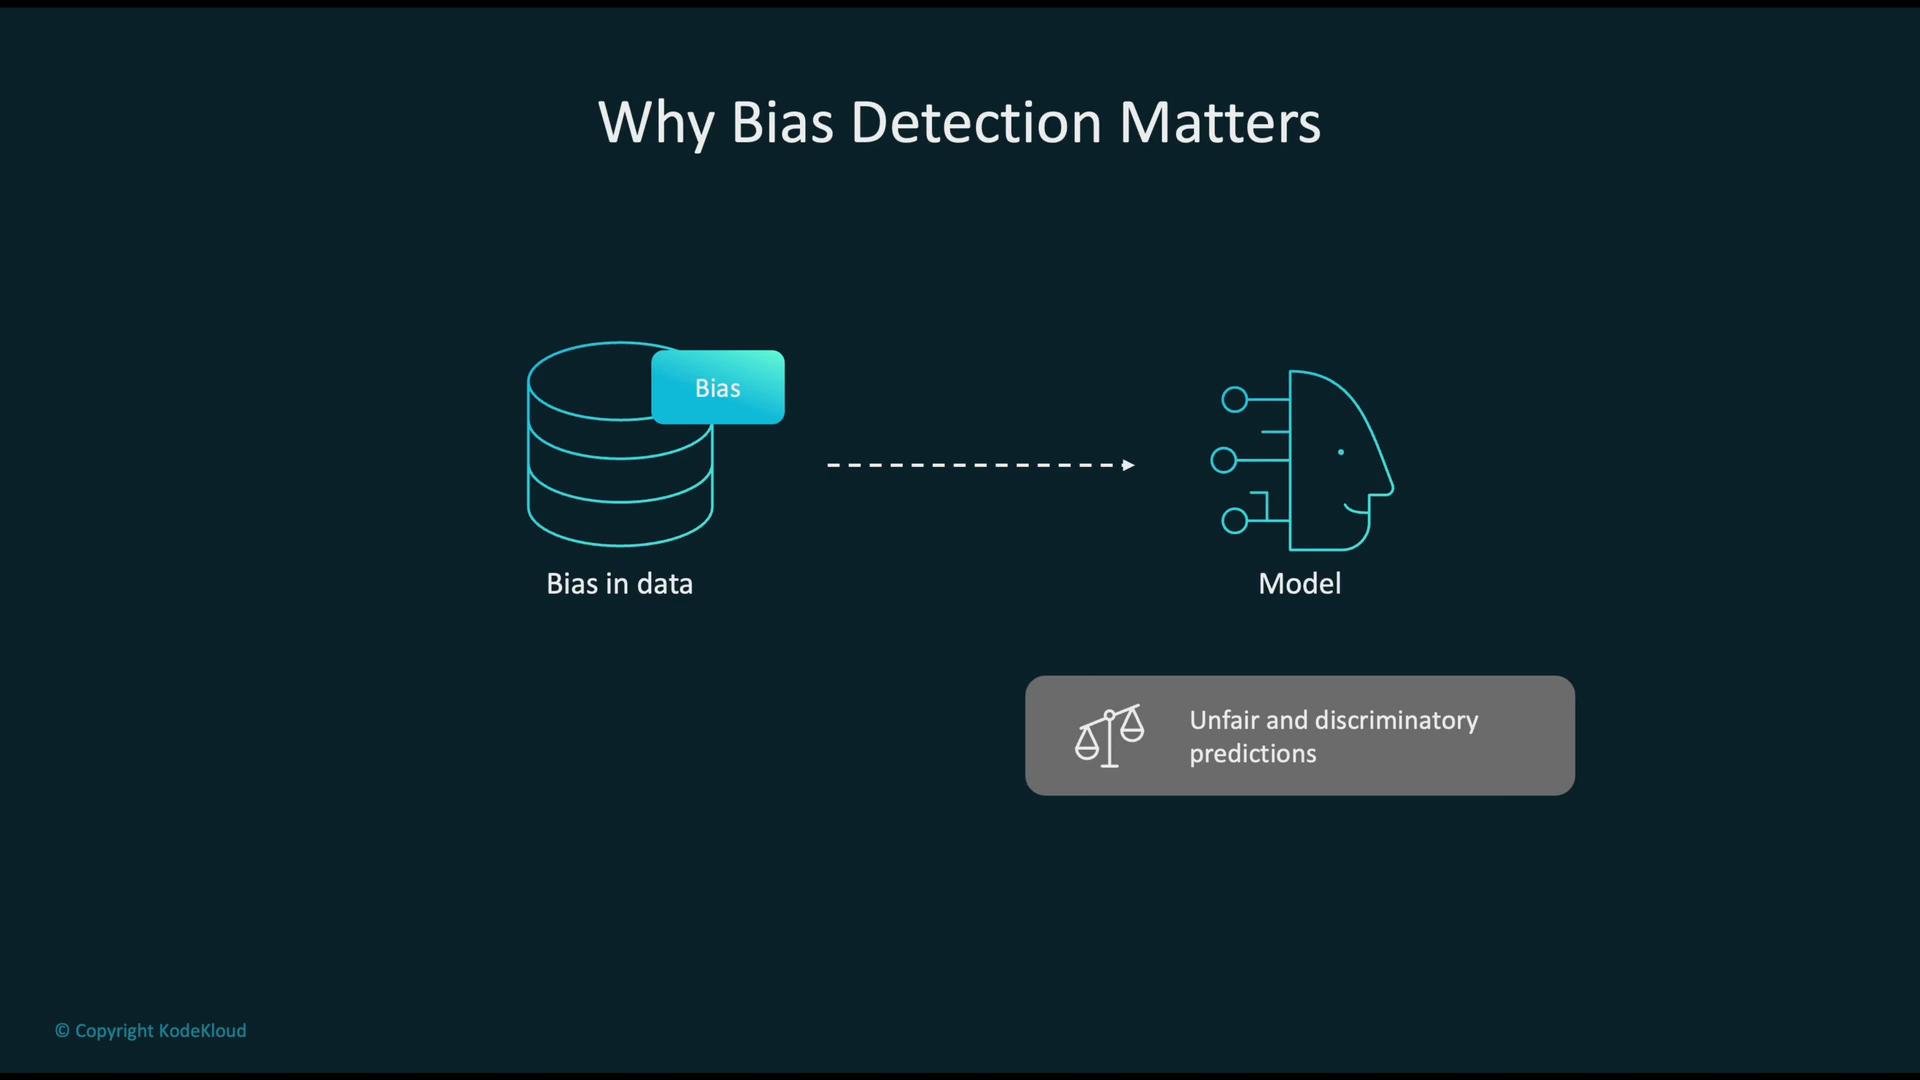
The image explains the impact of bias in data on models, leading to unfair and discriminatory predictions.
Why this matters: bias left unchecked can lead to systematic harm and regulatory or reputational risk. Detecting and addressing bias helps ensure more equitable outcomes and supports compliance efforts.
The image explains why bias detection matters, highlighting the importance of identifying bias in data to prevent harmful outcomes and build trust in AI systems.
High-level workflow
  • Data with bias → model training learns those patterns → downstream applications surface biased results.
  • SageMaker Clarify provides automated analysis at both pre-training (dataset) and post-training (model/prediction) stages to detect, measure, and explain bias.
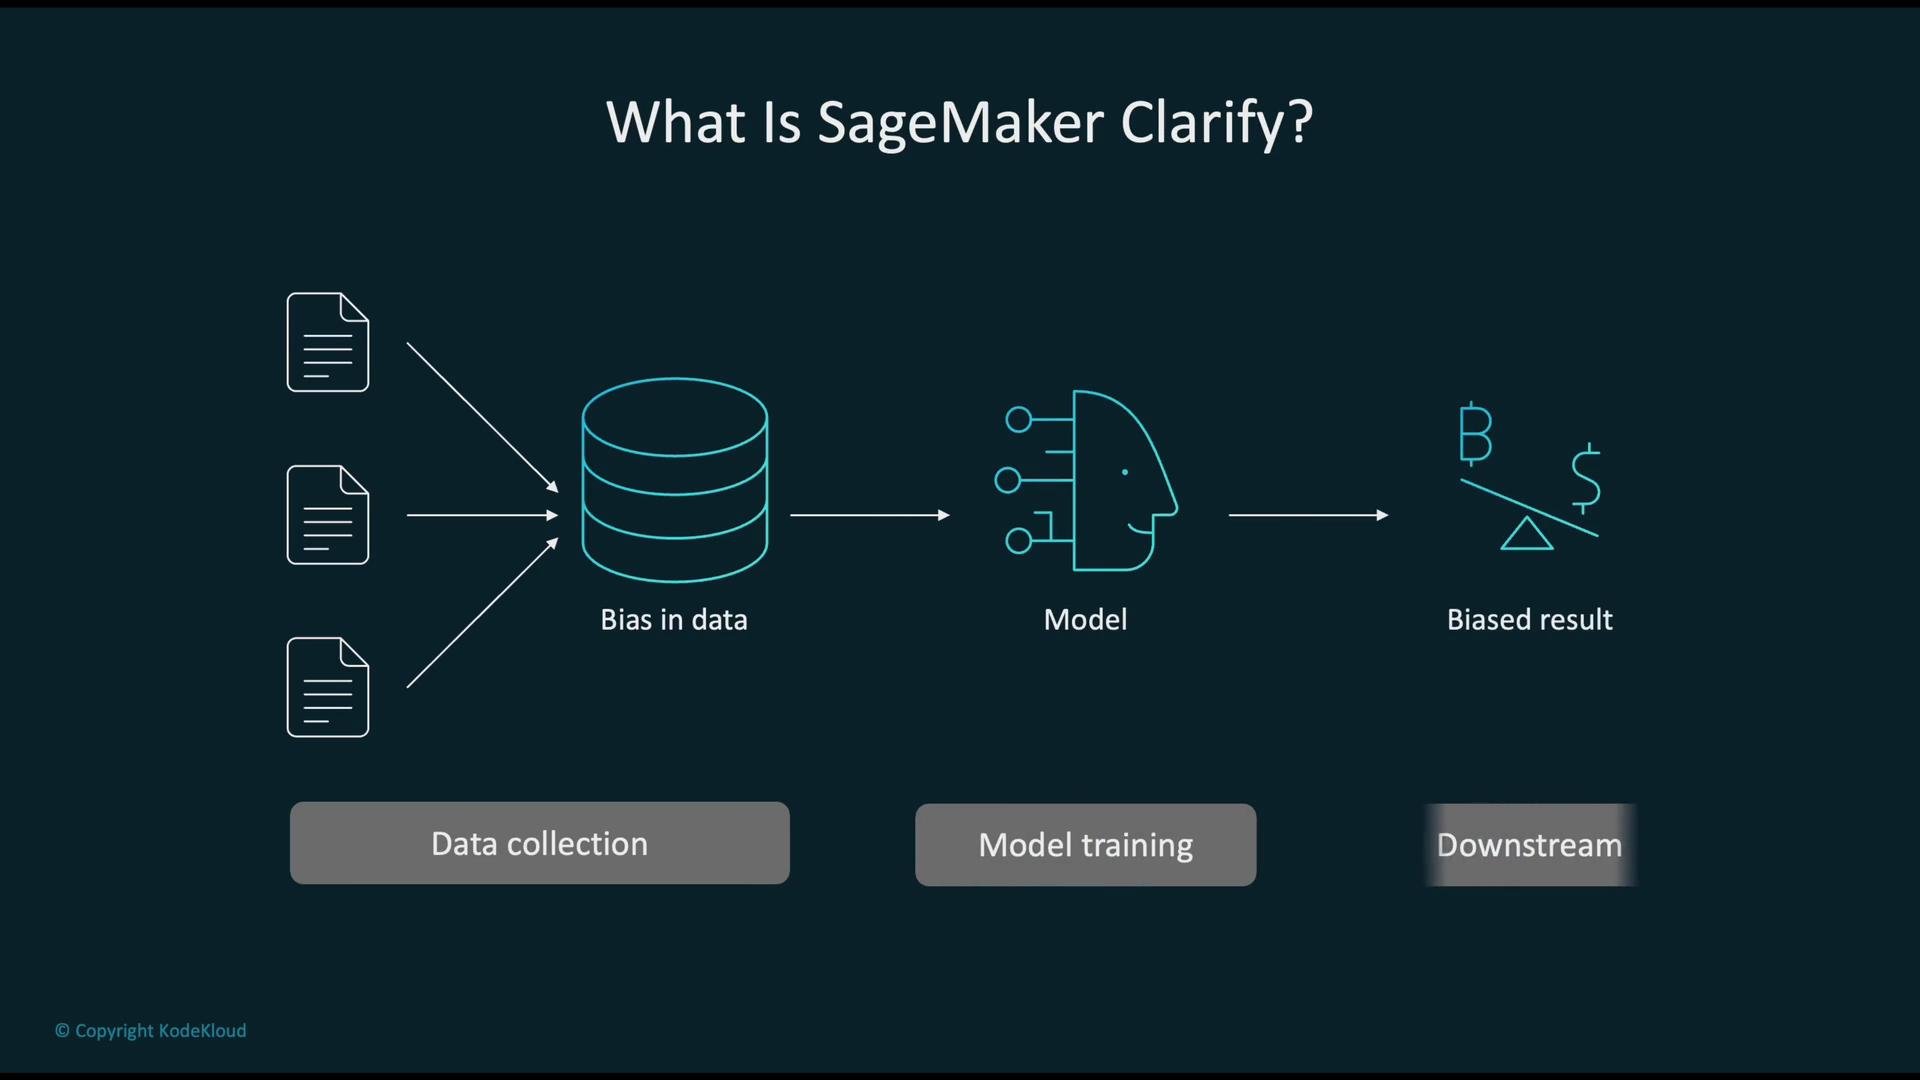
The image is a flowchart explaining SageMaker Clarify, demonstrating how bias in data leads to biased results through model training, specifically highlighting data collection, model training, and downstream impacts.
Key capabilities
  • Pre-training bias detection: analyze datasets for representation imbalances before training.
  • Post-training bias detection: evaluate model outputs and fairness across subgroups after training.
  • Explainability: use SHAP (Shapley) values to interpret model decisions and identify influential features.
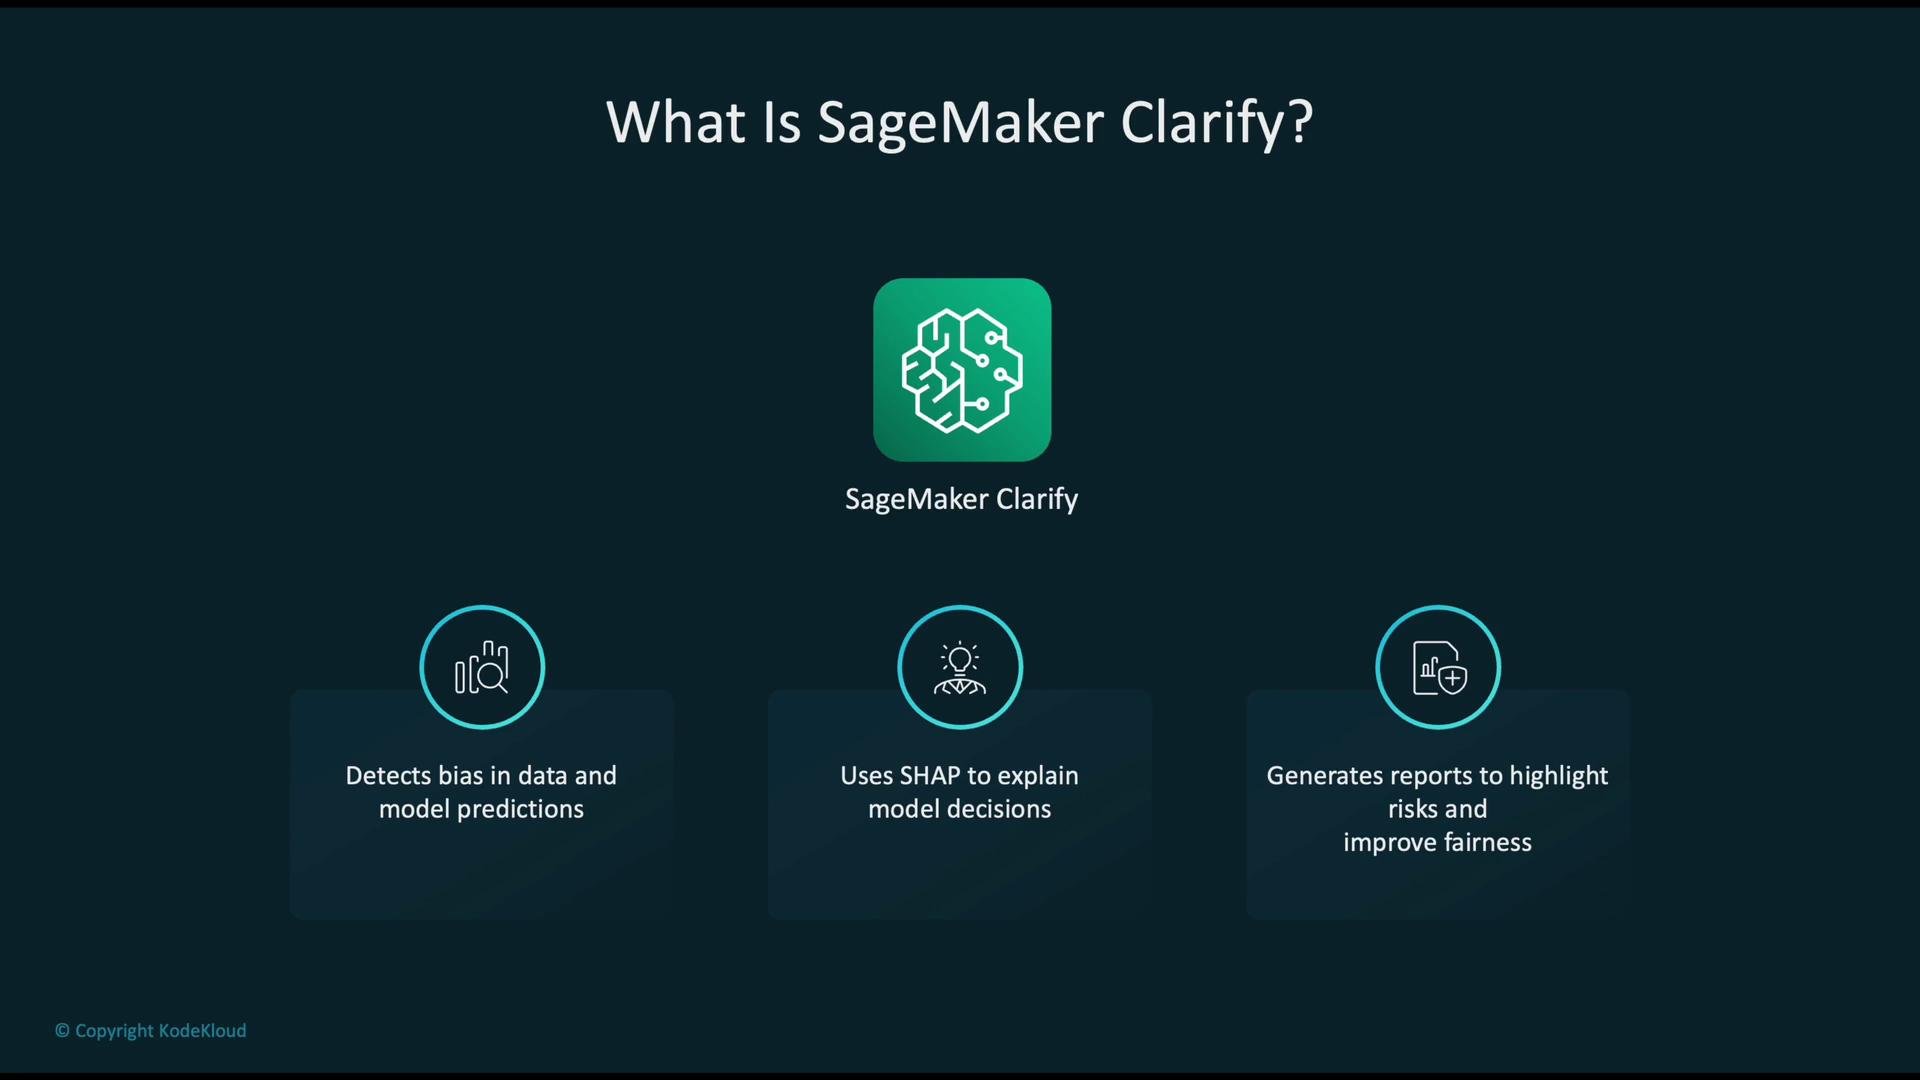
These capabilities are packaged into reports and visualizations to help ML teams iterate on data and model choices.
The image describes SageMaker Clarify, highlighting its ability to detect bias in data and model predictions, use SHAP to explain model decisions, and generate reports to improve fairness.
Where Clarify integrates
  • Pre-training checks: run on raw or preprocessed datasets to surface class imbalances, label skews, or distribution drift.
  • Post-training checks: run on model predictions to measure disparities in accuracy, precision, recall, and other performance metrics across protected or relevant subgroups.
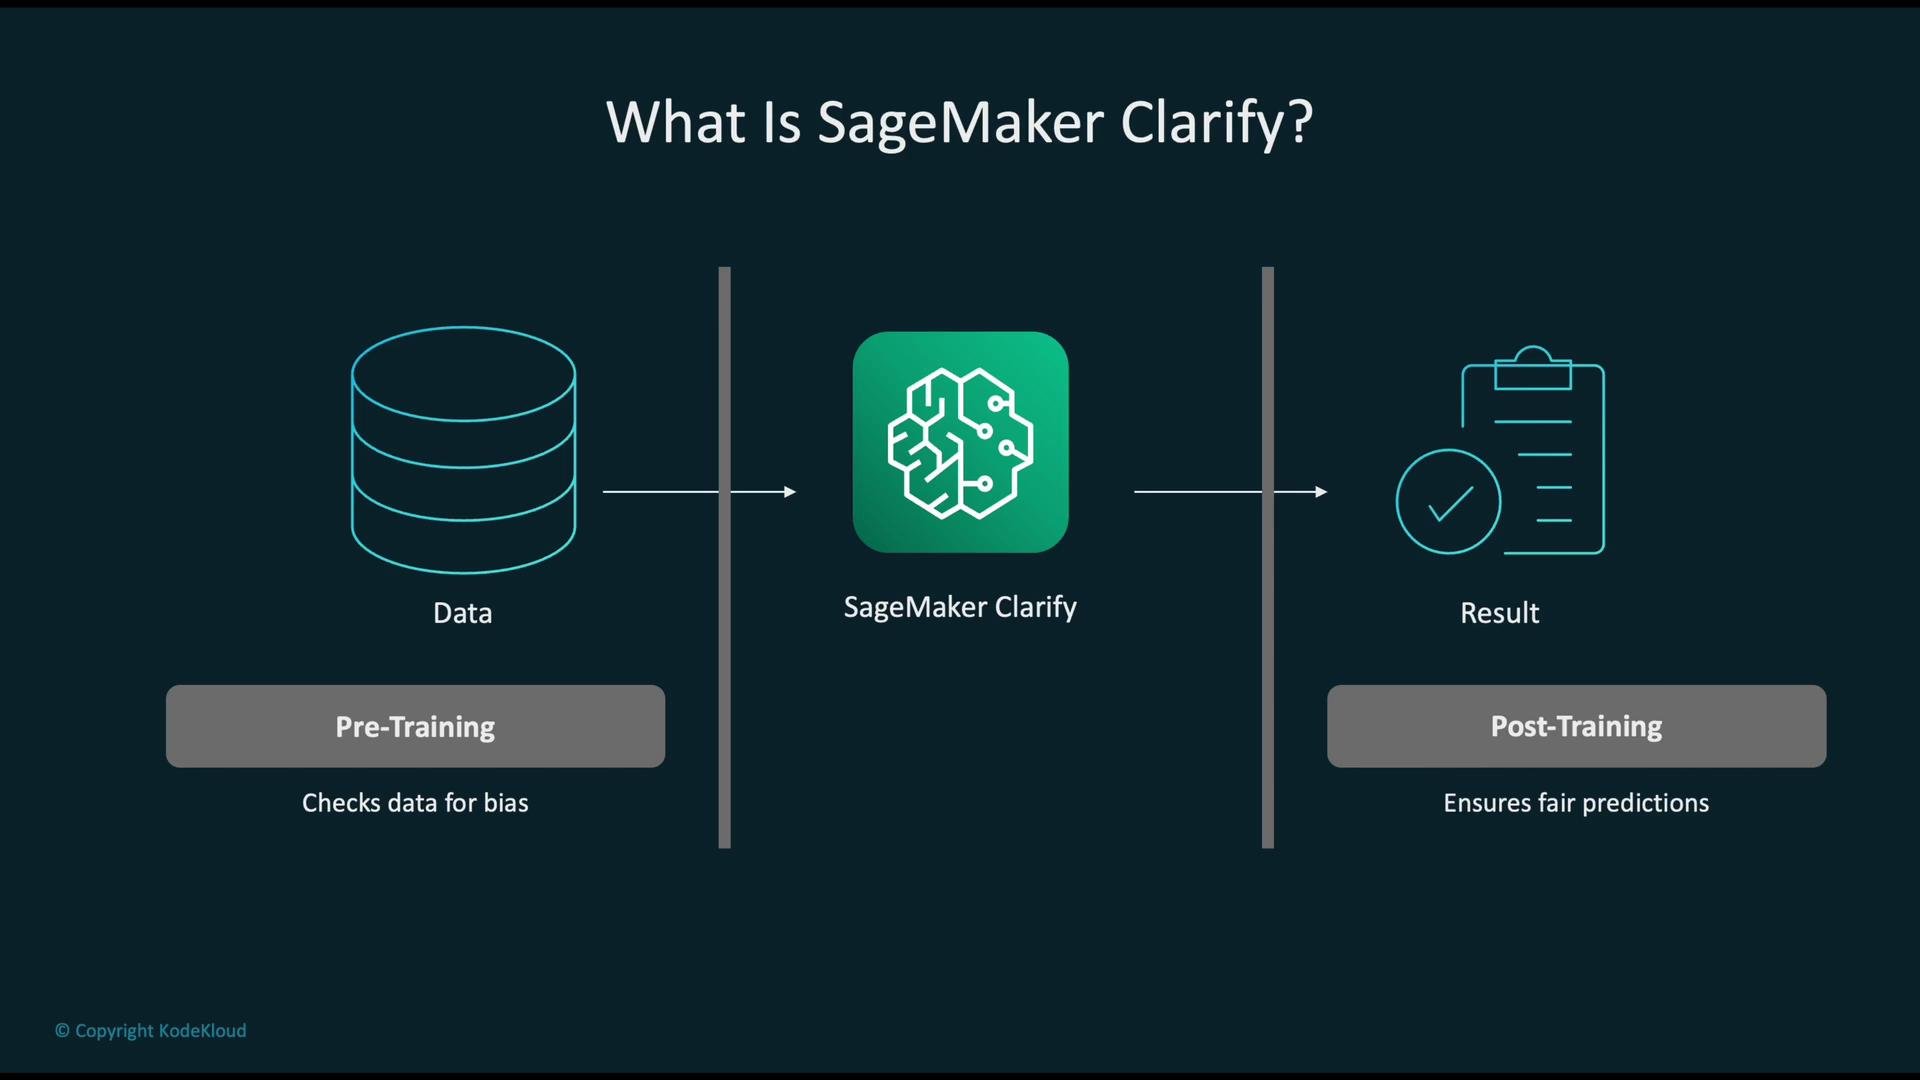
The image explains SageMaker Clarify, a tool for detecting bias in pre-training data and ensuring fair predictions in post-training results. It illustrates the process flow from data input to result verification.
Clarify supports four primary tasks
  • Pre-training bias detection: inspect feature and label distributions for under/over-representation.
  • Post-training bias detection: quantify fairness across model outputs and subgroups.
  • Model explainability: identify features that drive predictions (global and local).
  • Reporting: export bias and explainability reports for governance and audits.
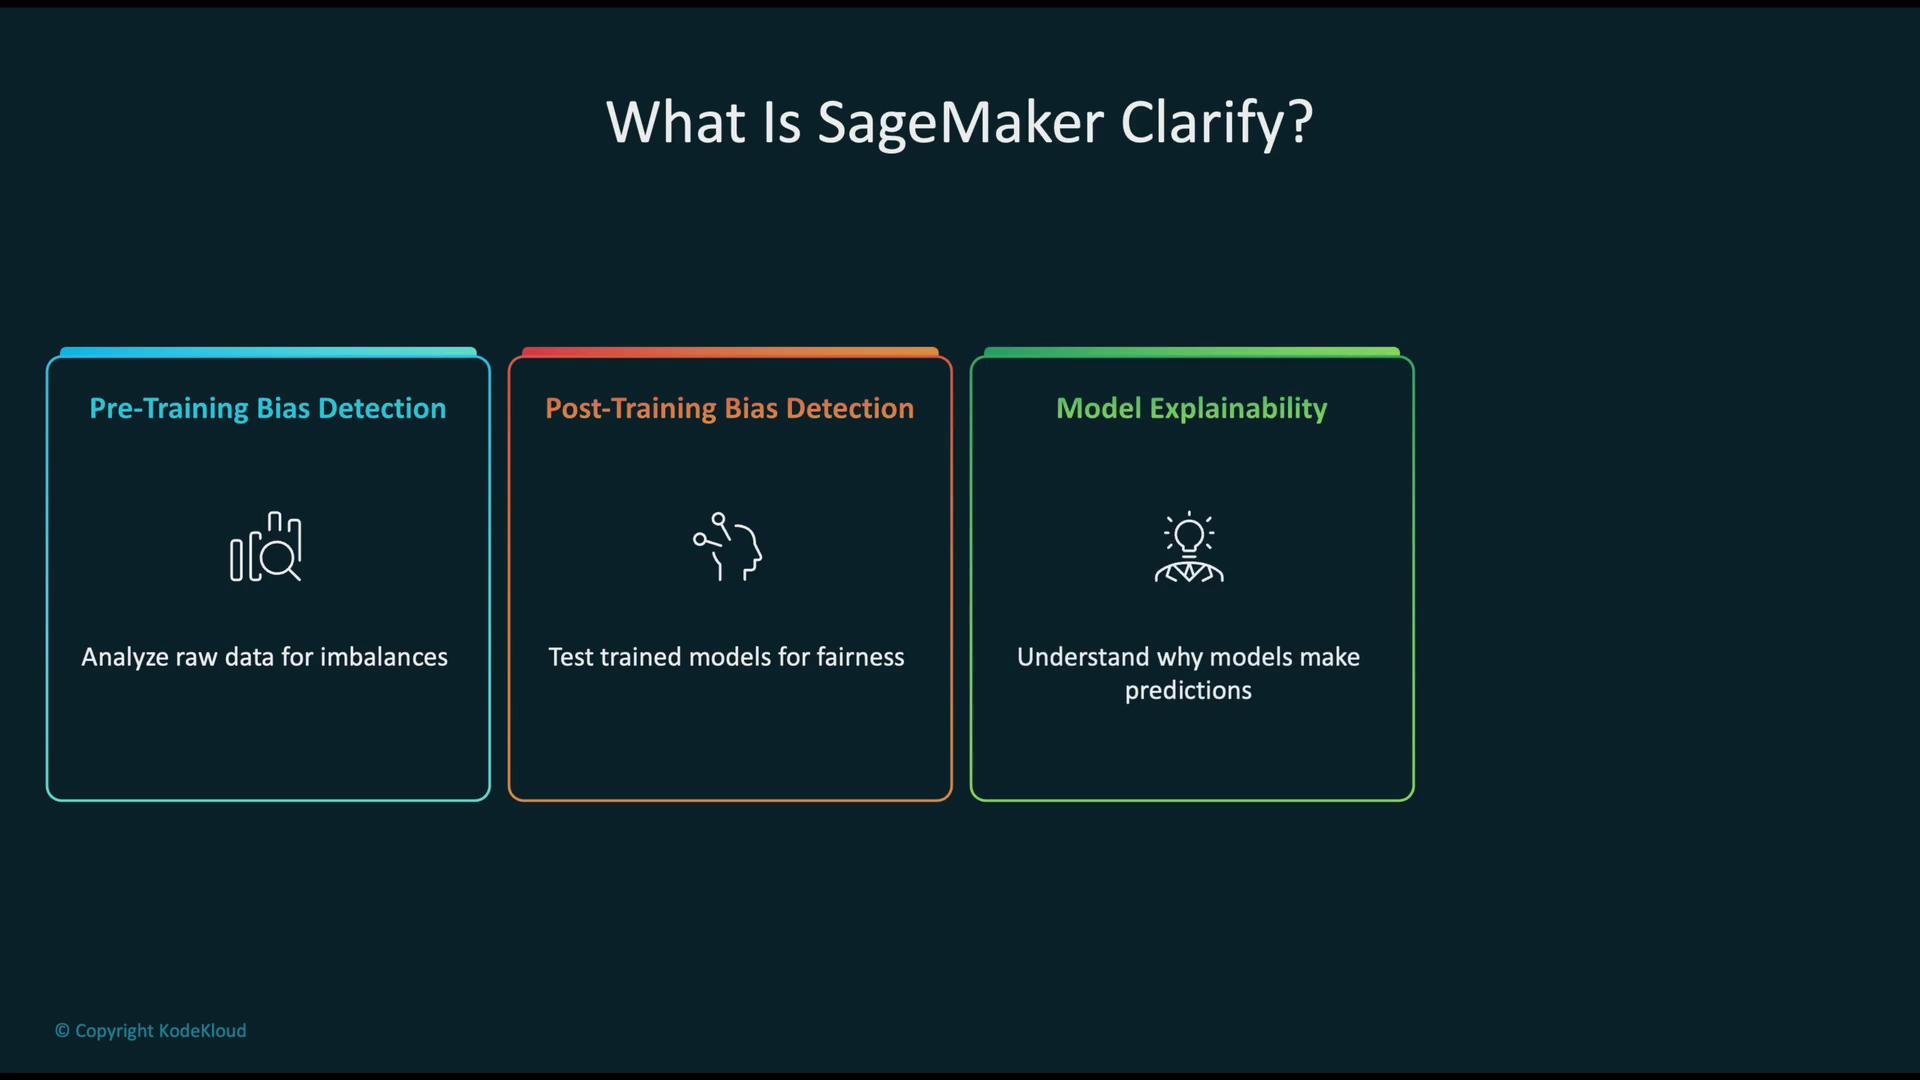
The image describes SageMaker Clarify, highlighting its features: pre-training bias detection, post-training bias detection, and model explainability.
Pre-training bias metrics Pre-training checks reveal problems in the dataset itself that warrant remediation (resampling, reweighting, or feature engineering). Examples include: These dataset-level insights guide cleaning, collection augmentation, and rebalancing before training.
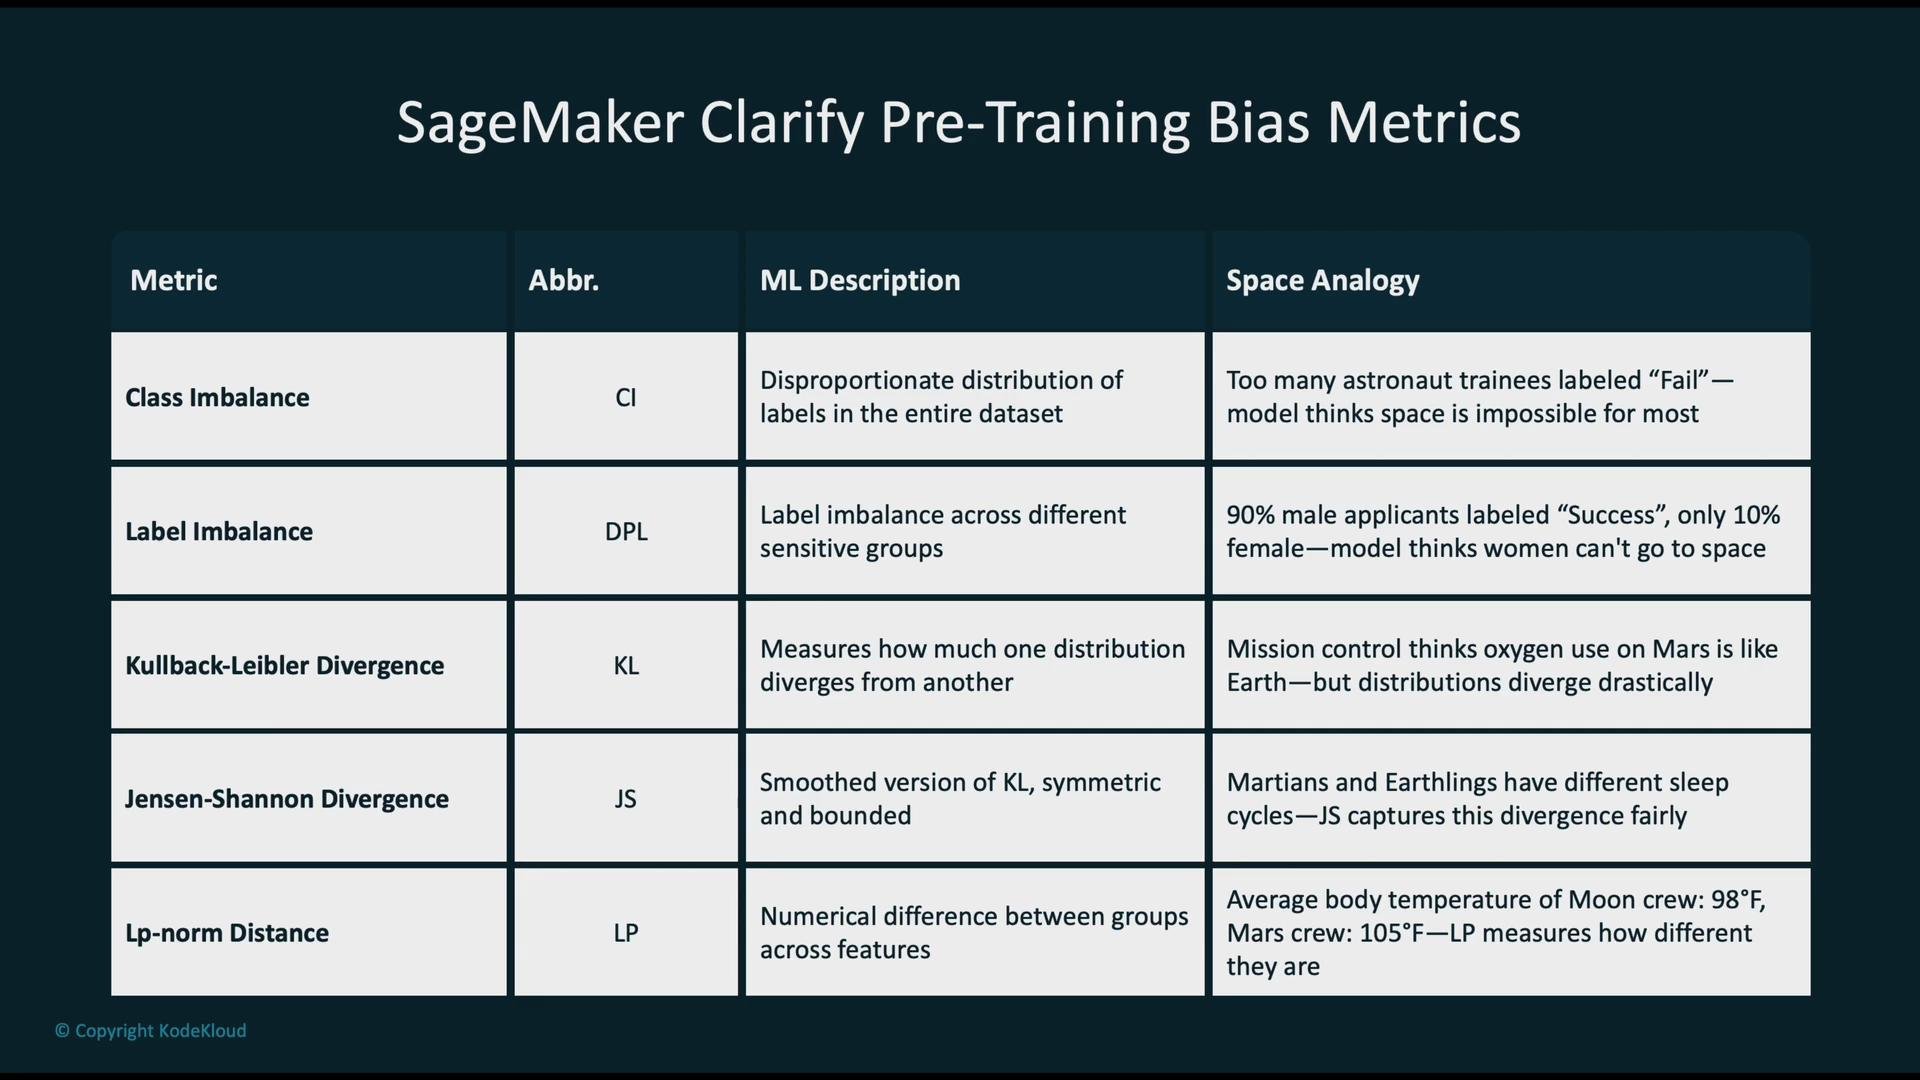
The image is a table detailing SageMaker Clarify pre-training bias metrics with columns for metrics, abbreviations, machine learning descriptions, and space analogies. Metrics include Class Imbalance, Label Imbalance, Kullback-Leibler Divergence, Jensen-Shannon Divergence, and Lp-norm Distance.
Post-training bias metrics After training, Clarify evaluates model behavior across groups. These metrics help detect potential unfair treatment in production and guide remediation such as threshold tuning, model retraining, or post-processing. Use these metrics to prioritize where to take action and to quantify improvements over iterations.
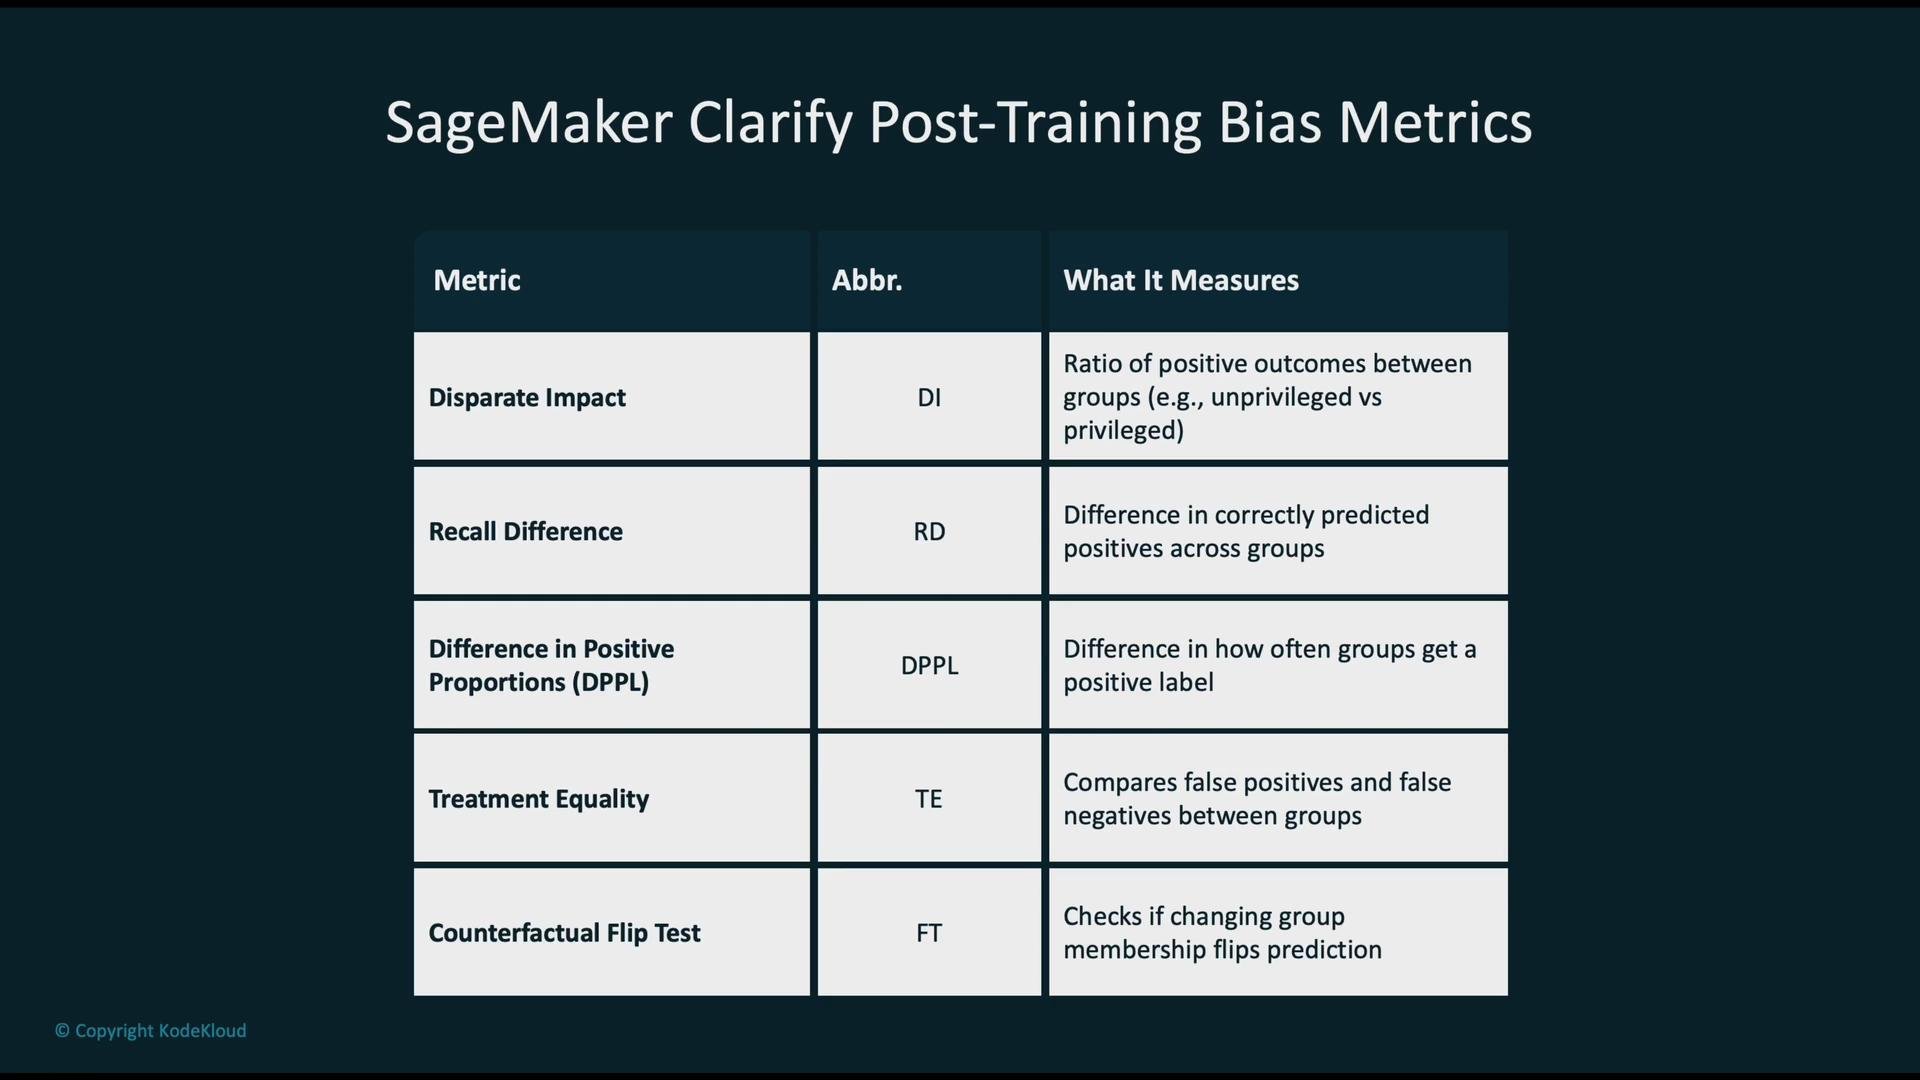
The image is a table outlining SageMaker Clarify post-training bias metrics, including metric names, abbreviations, and what each one measures, such as Disparate Impact, Recall Difference, and Treatment Equality.
Explainability (SHAP) Explainability complements fairness metrics by attributing model behavior to input features:
  • Global explanations: identify features that most influence model outputs across the dataset.
  • Local explanations: explain why the model produced a specific prediction for an individual instance.
Using SHAP values helps uncover features or correlations that lead to disparate outcomes—enabling targeted fixes such as feature removal, transformation, or reweighting. Clarify combines explainability with bias metrics to produce comprehensive reports for governance, audits, and cross-functional review. These reports document where bias exists, why it may be occurring, and what remediation steps were taken or recommended. Additional resources
Automated metrics guide action but don’t replace domain expertise. Always combine statistical checks with stakeholder review and legal/regulatory guidance where needed.

Watch Video