

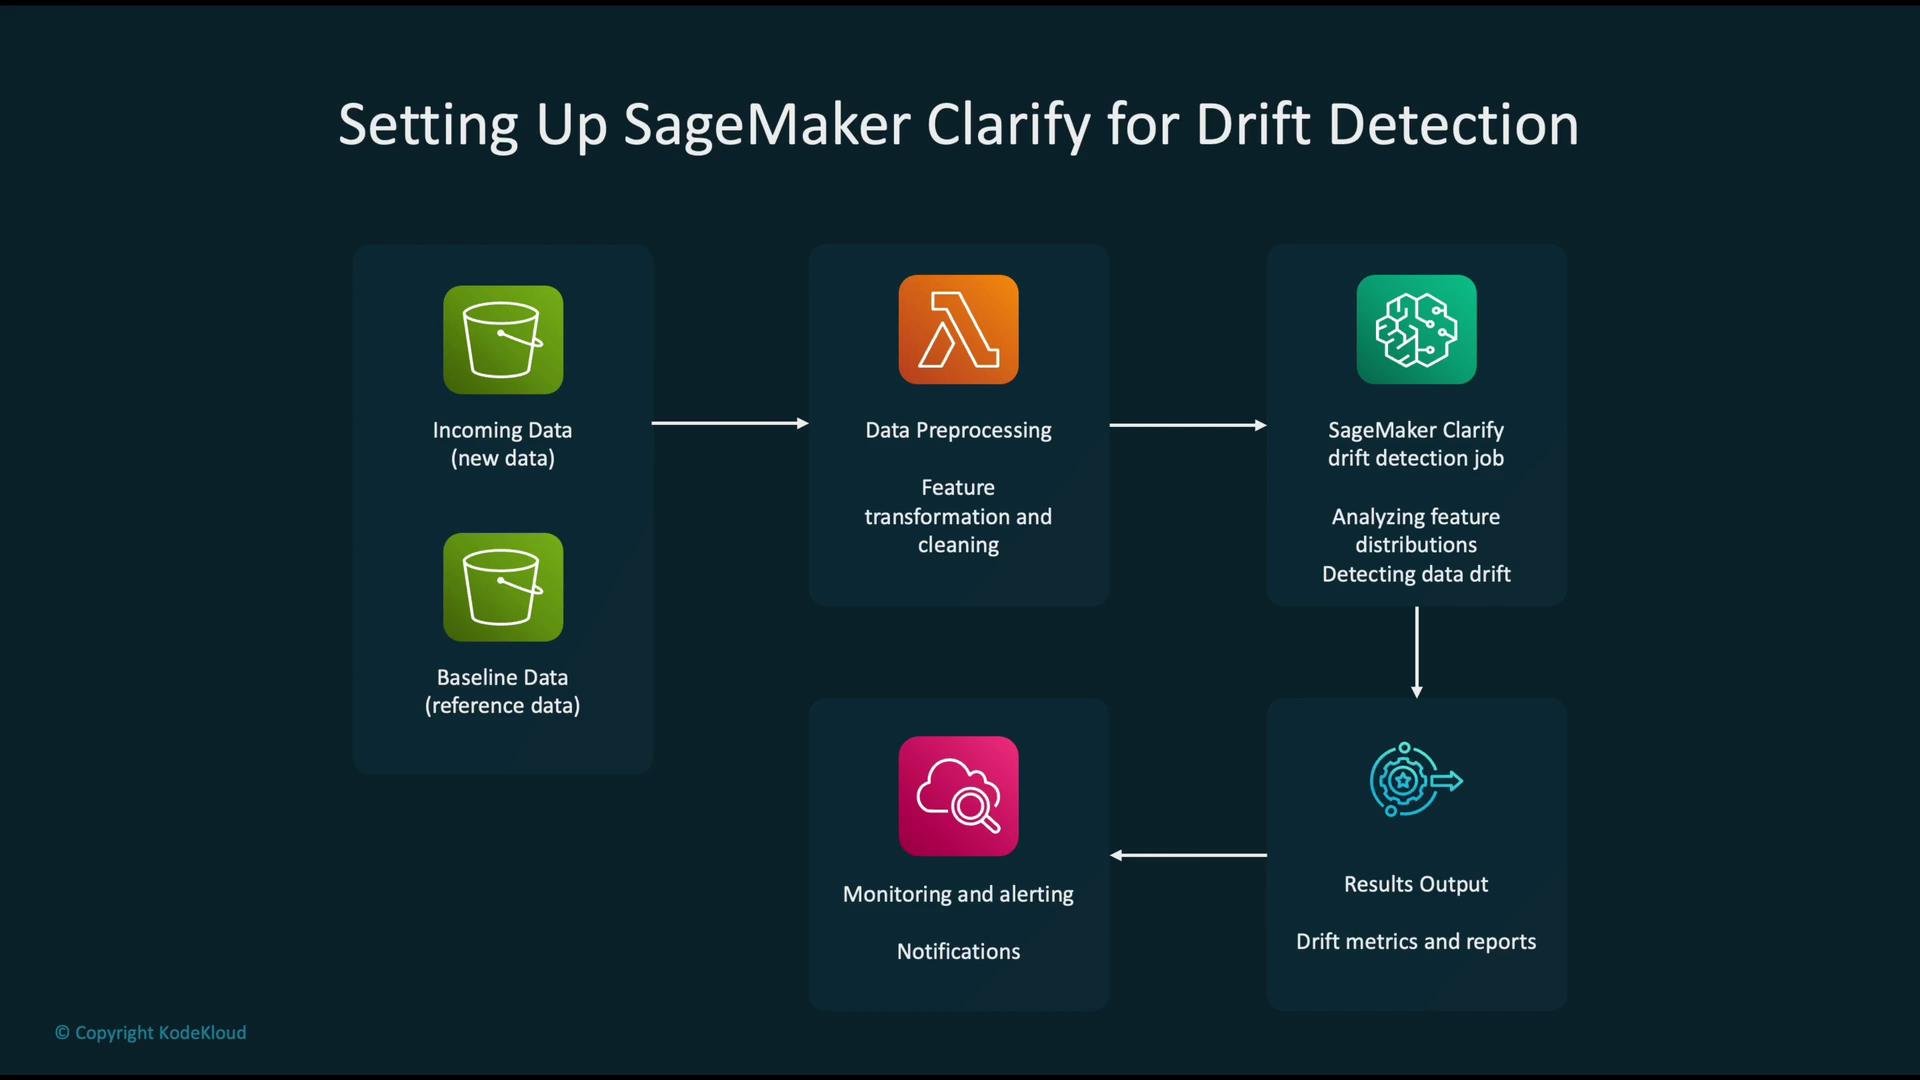
- Clarify compares production data to a baseline (for example, the training dataset).
- Clarify emits drift metrics to Amazon CloudWatch and writes detailed reports to Amazon S3.
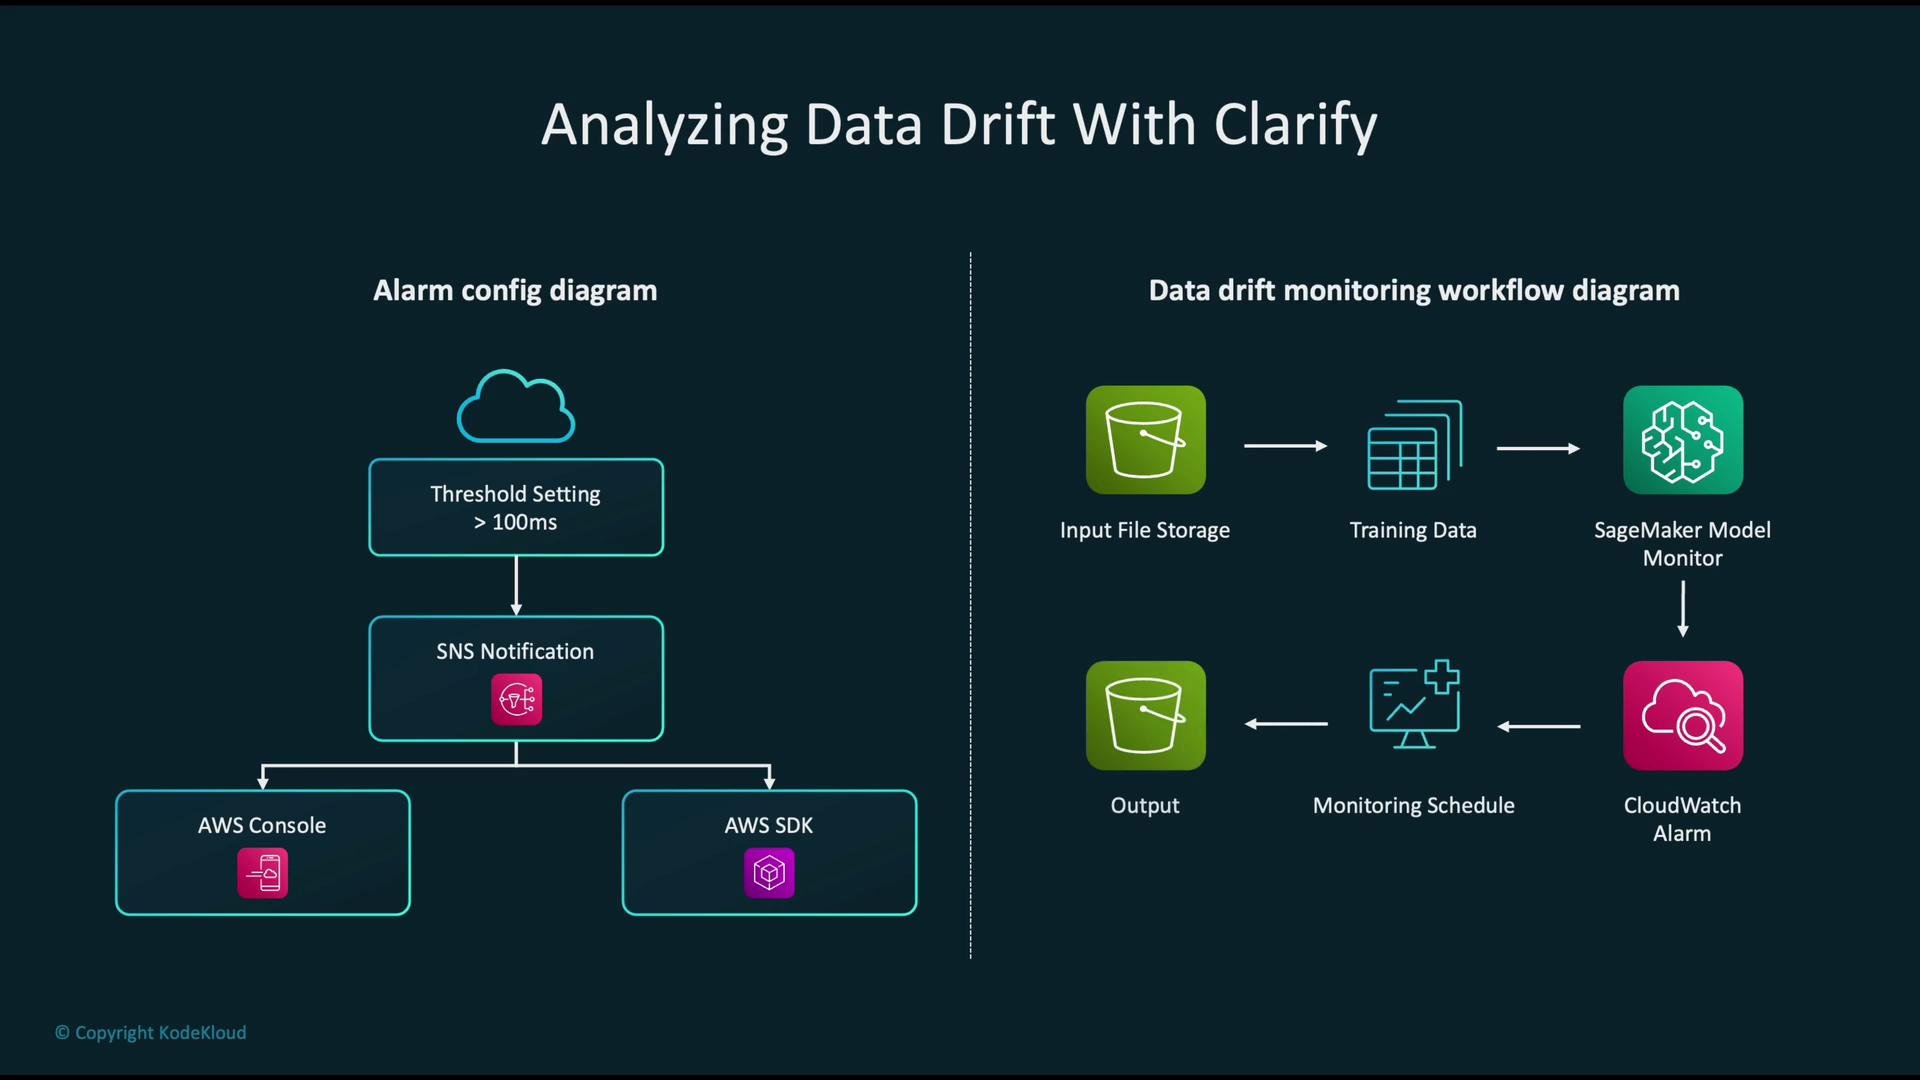
- CloudWatch Alarms detect threshold breaches and notify downstream systems.
- Notifications can trigger AWS Lambda for lightweight automation or a CI/CD pipeline (AWS CodePipeline or other tools) for retraining and redeployment.
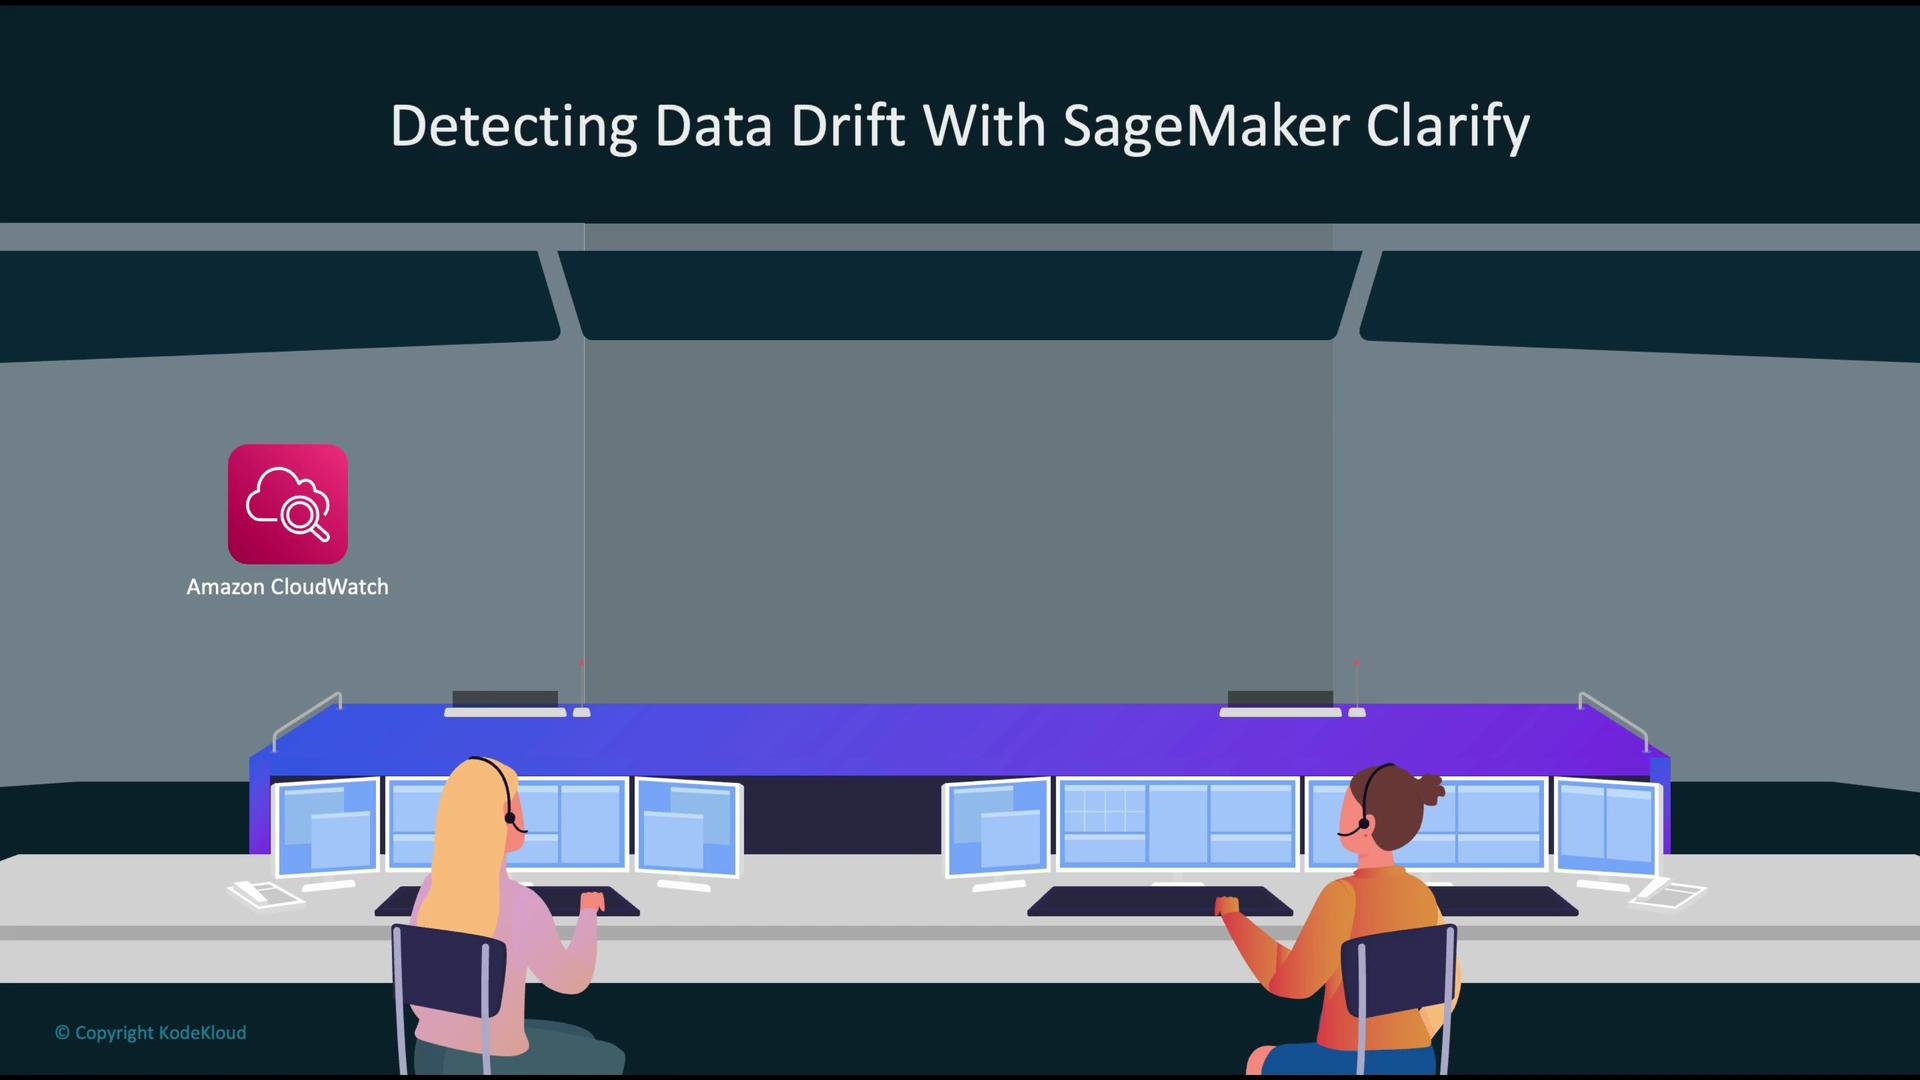
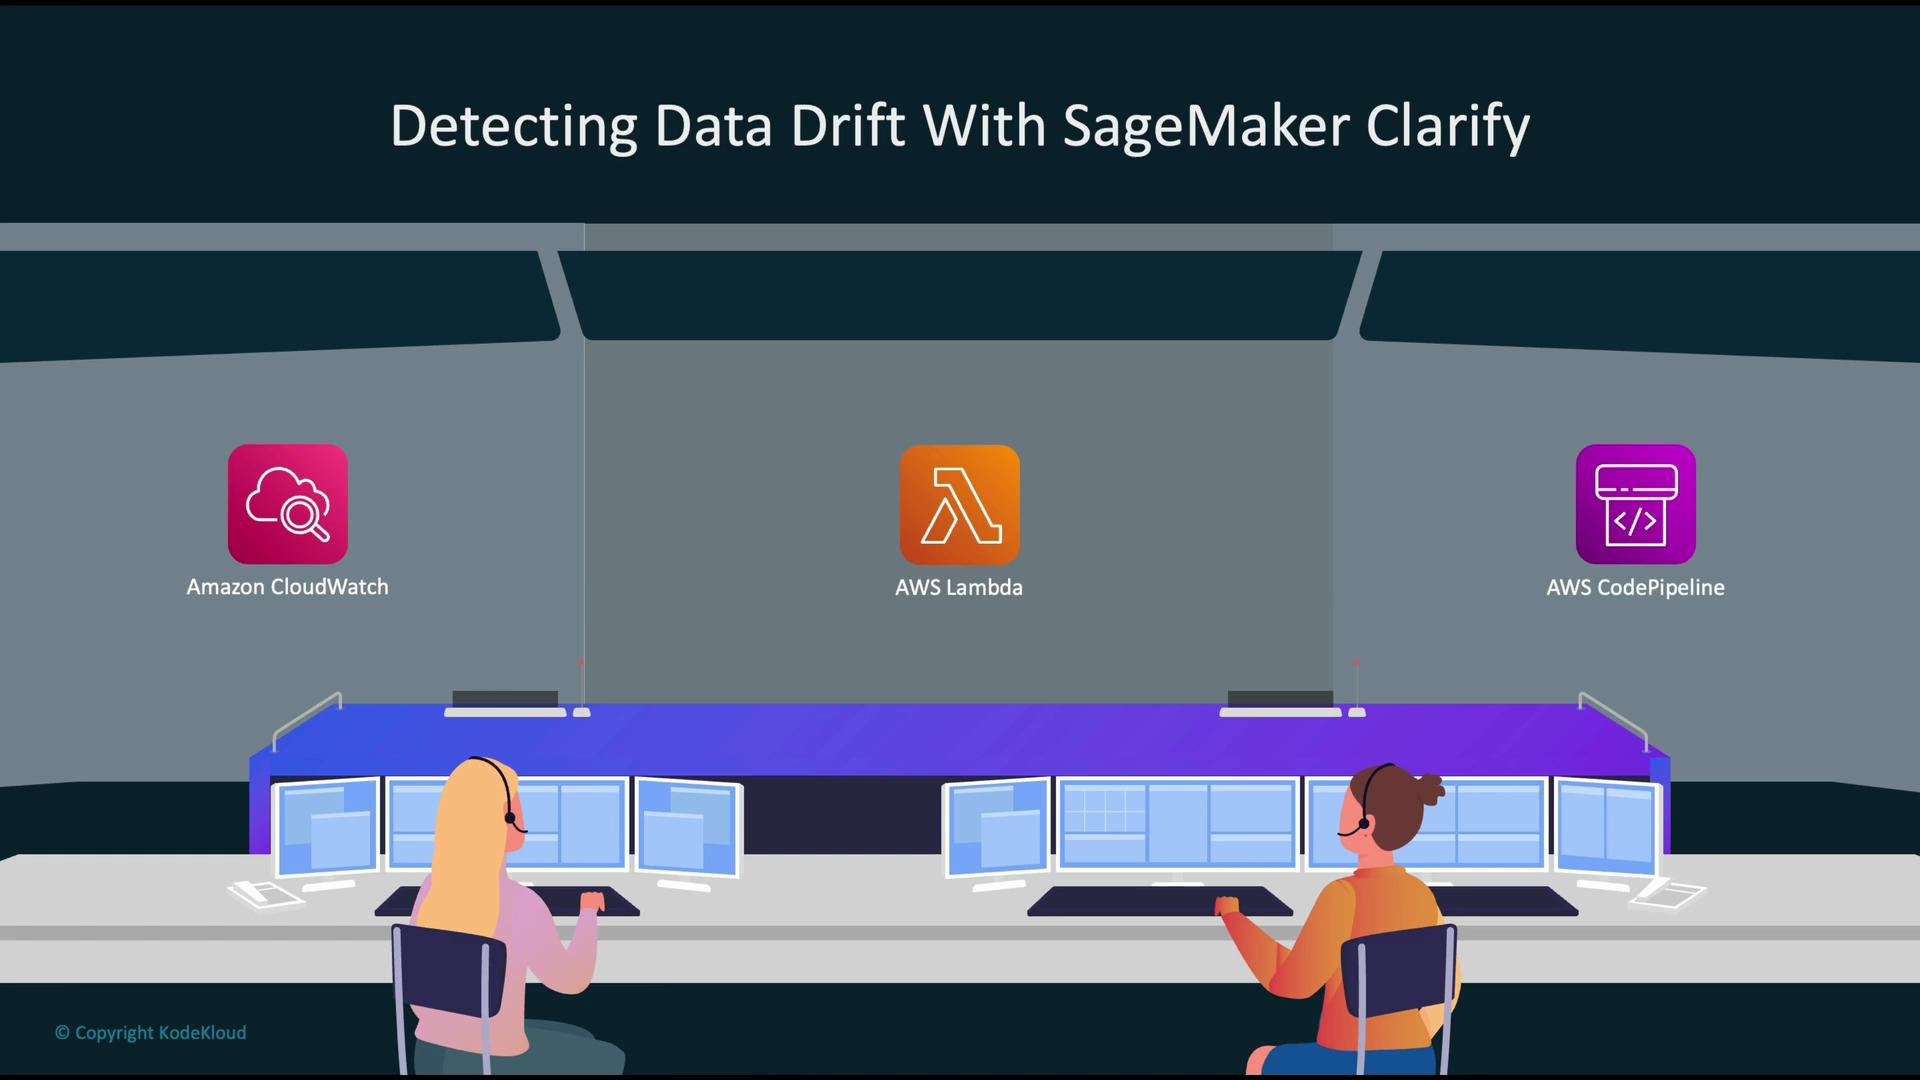
A common automation chain is CloudWatch → Lambda → CodePipeline. Use CloudWatch for alerting, Lambda for custom remediation logic, and CodePipeline (or your CI/CD tool) for full retrain-and-deploy workflows.
- CloudWatch monitors Clarify (or Model Monitor) metrics and raises Alarms.
- Alarms can publish to SNS, invoke Lambda, or trigger a pipeline.
- Lambda can run quick validation or orchestration tasks and then call a pipeline to perform retraining, validation, and deployment.
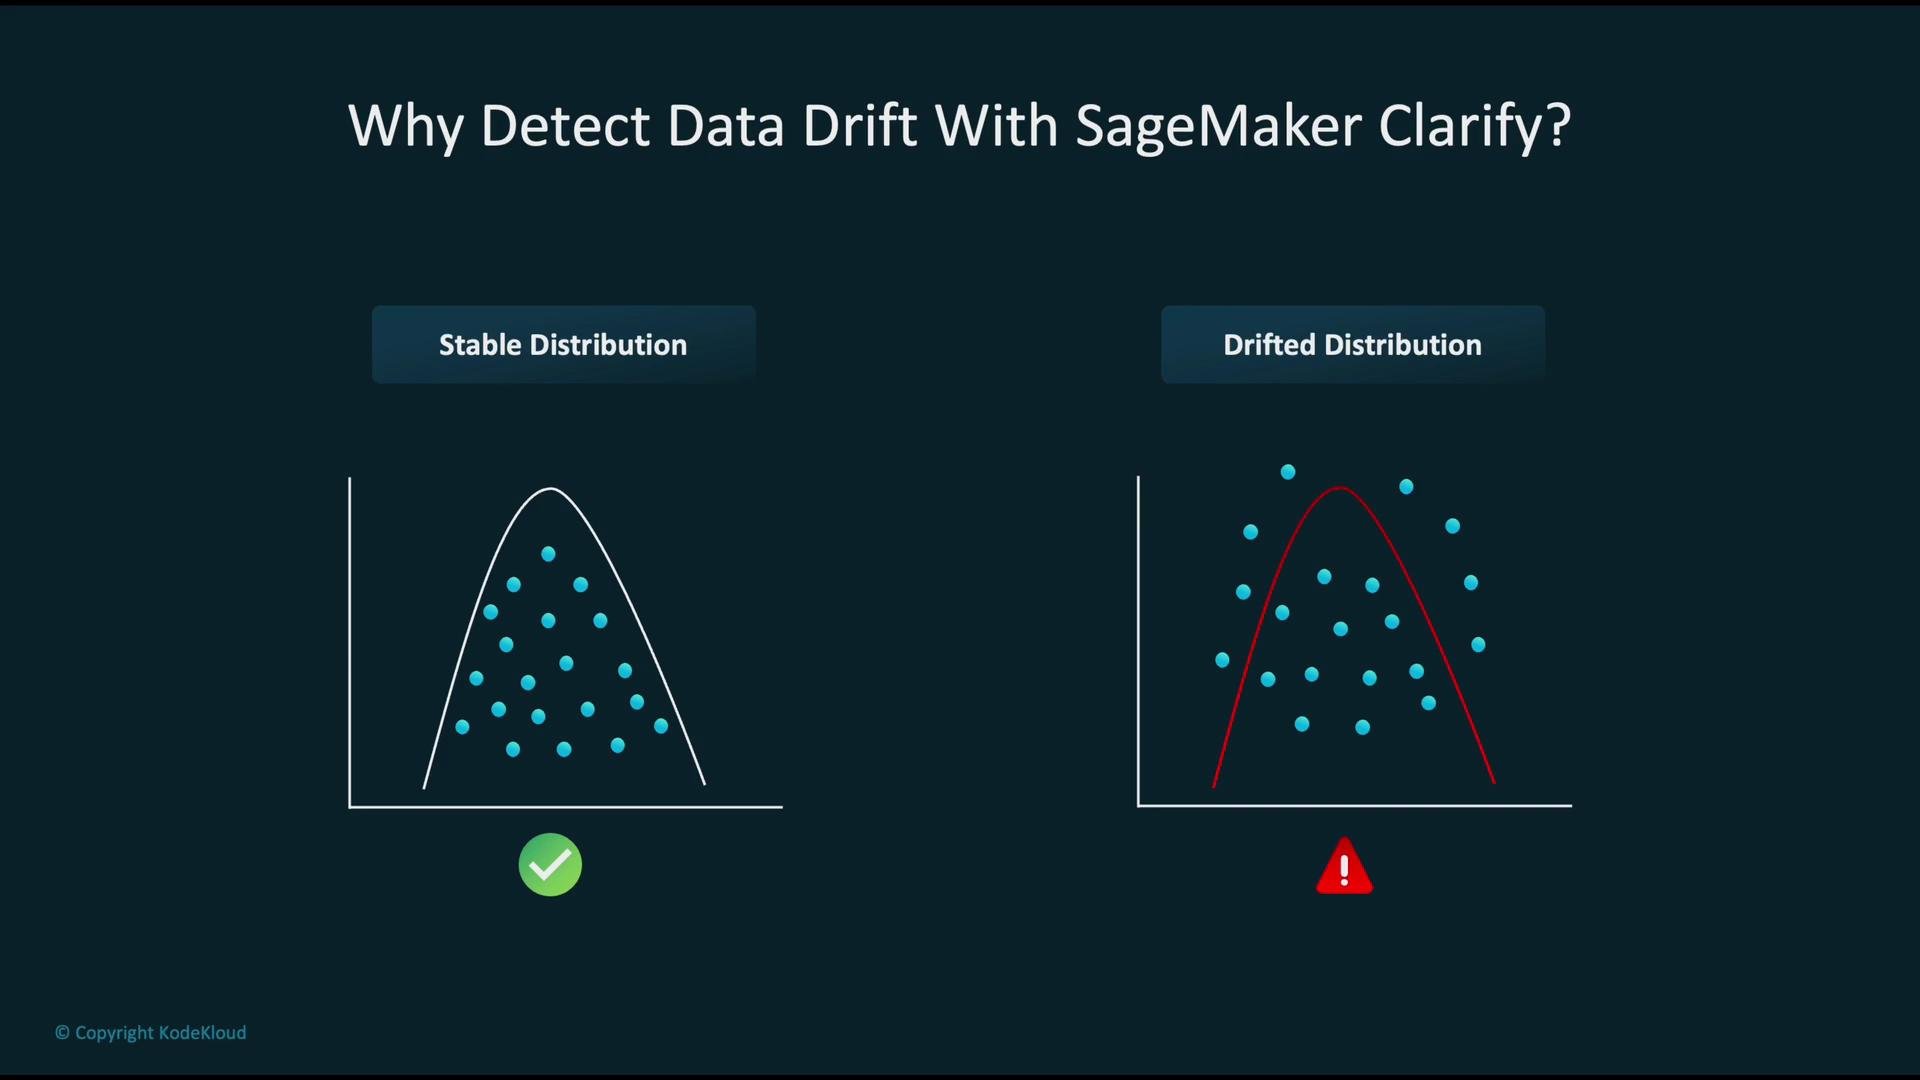
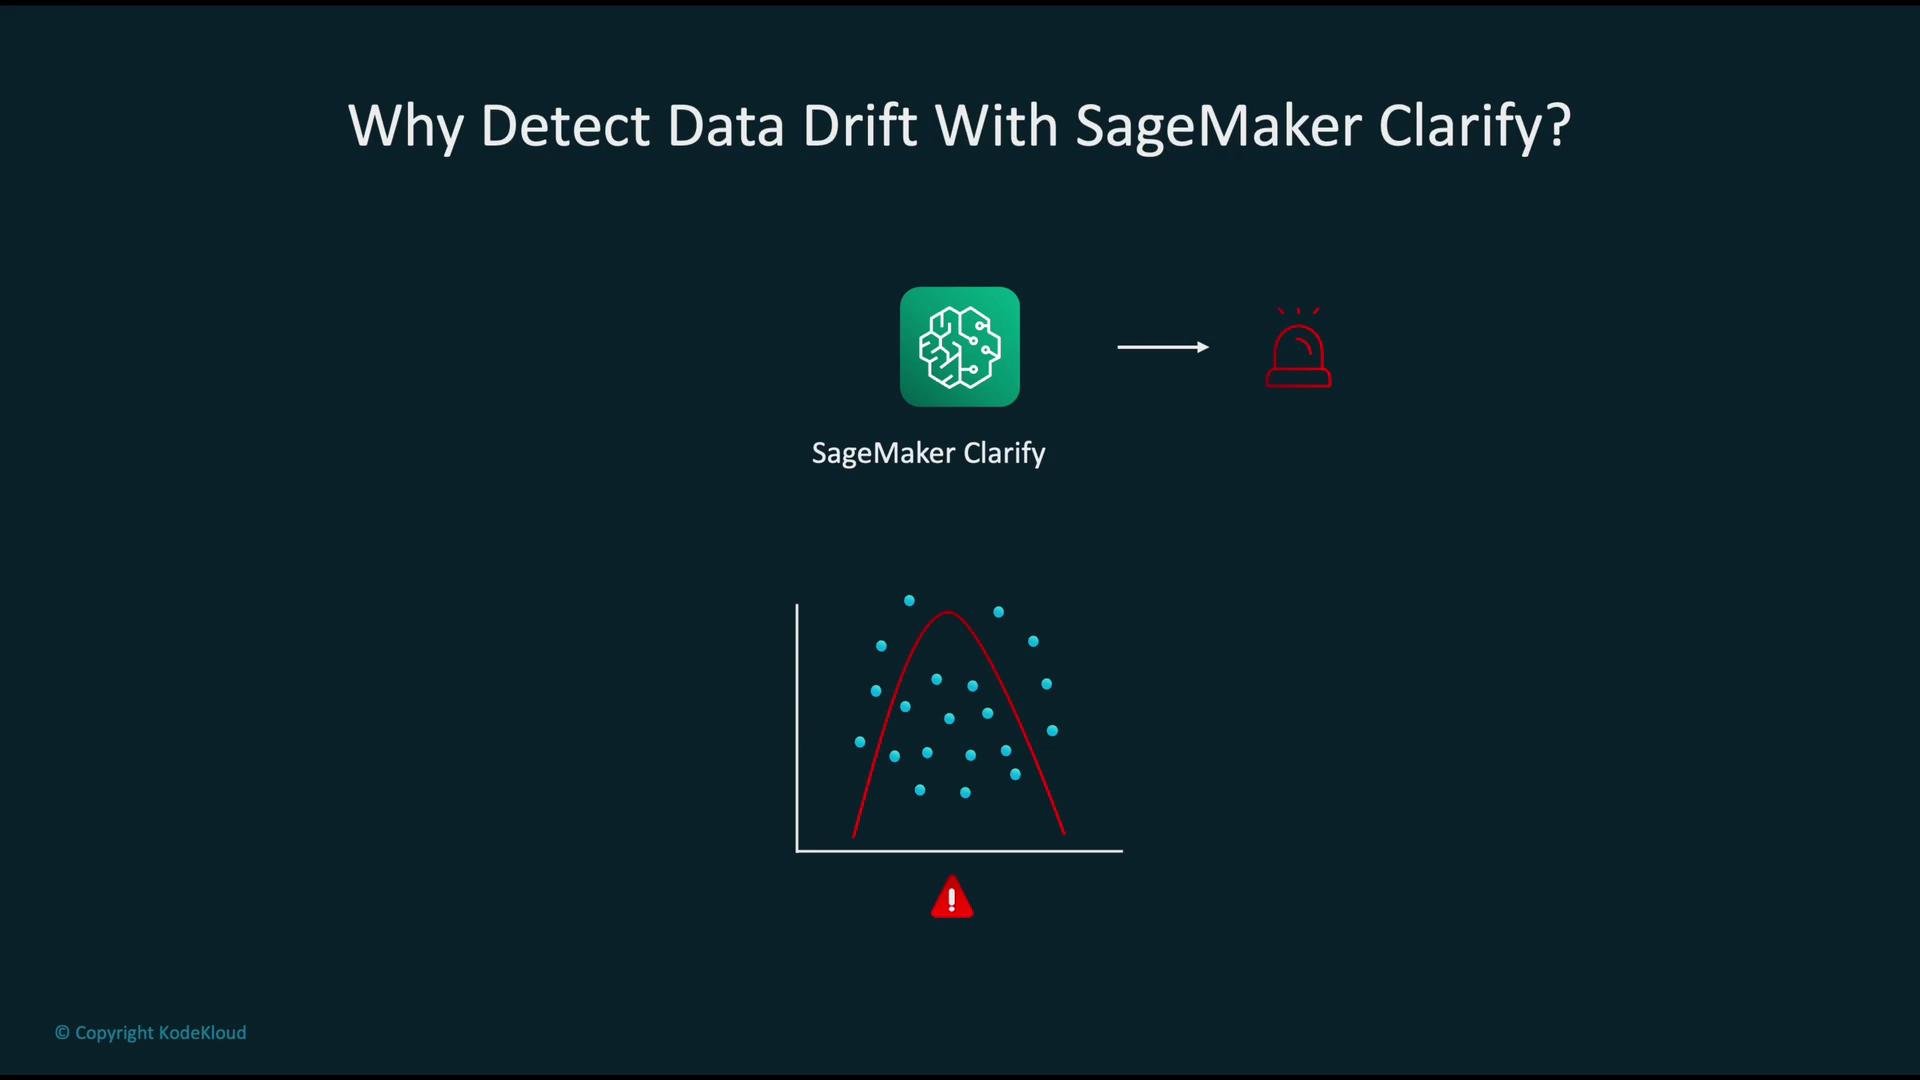
- Production data distributions can diverge from training data over time — this is data drift.
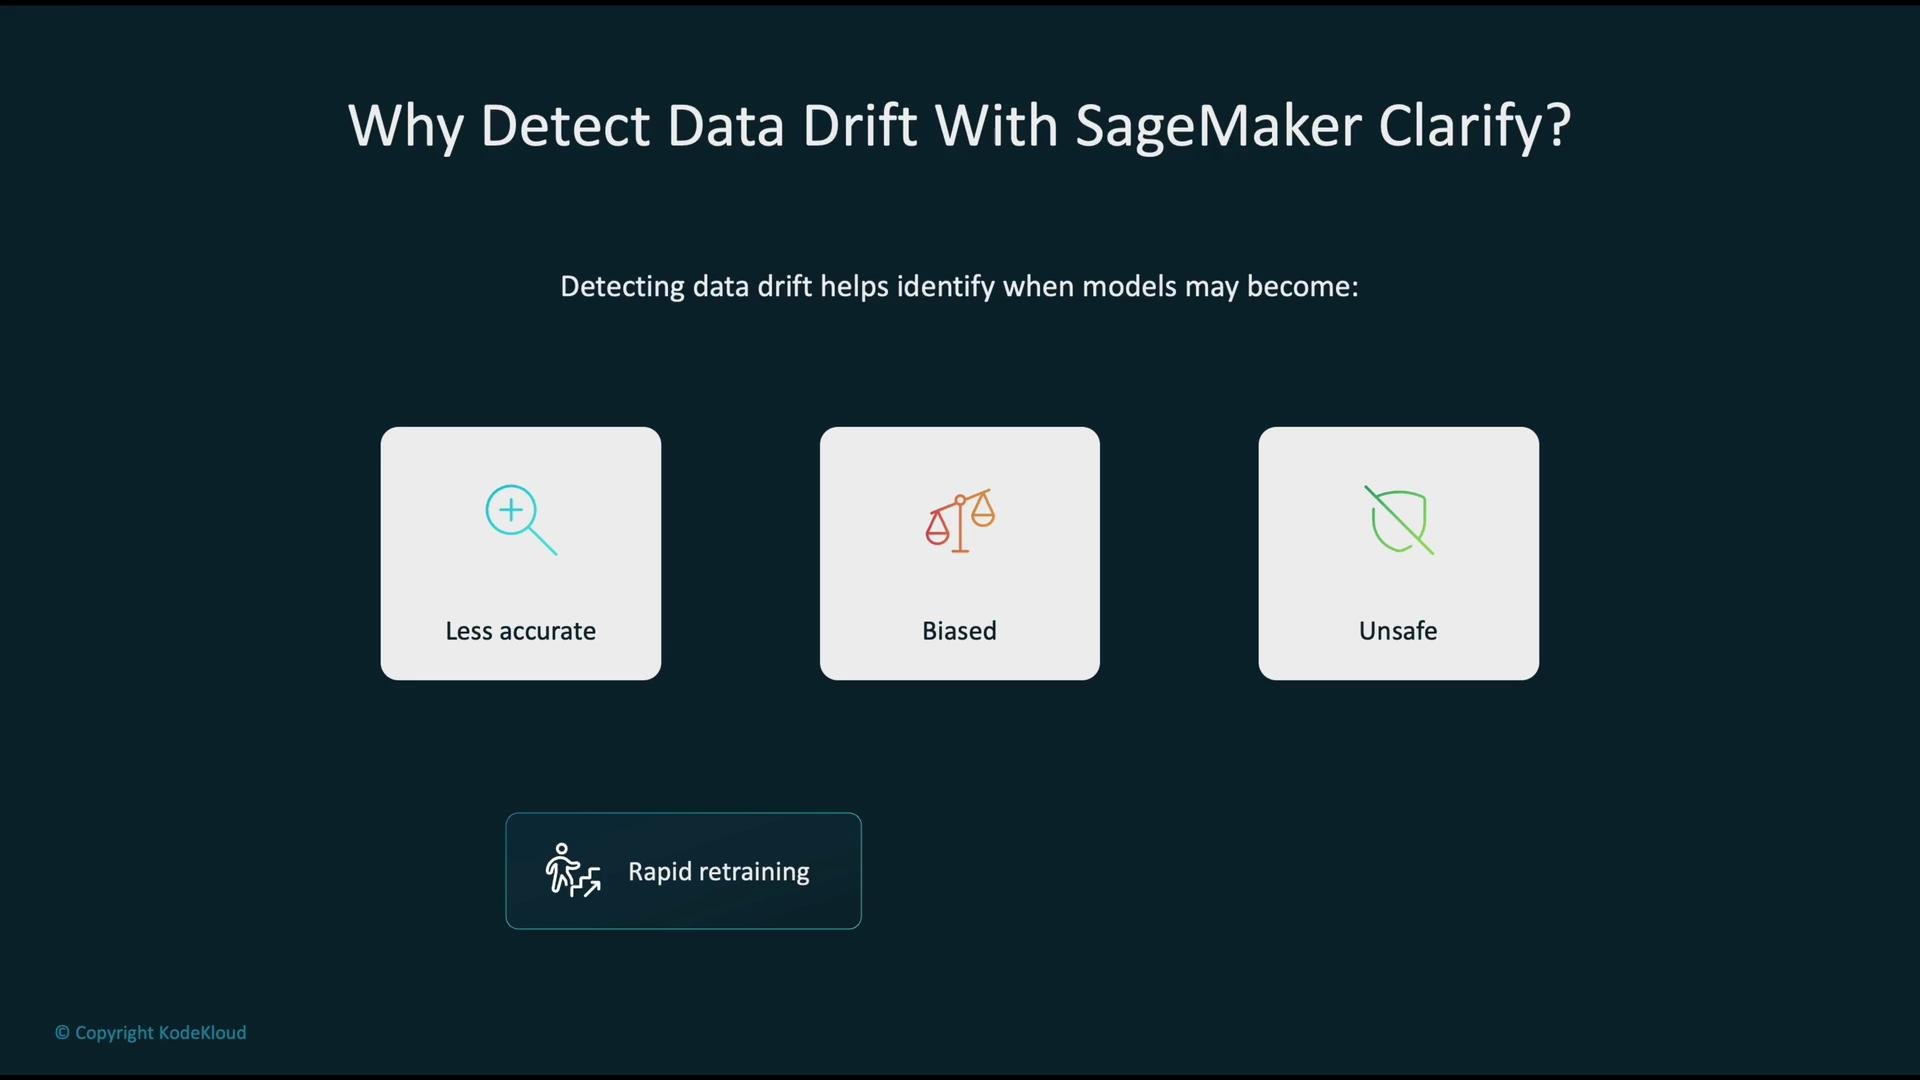
- Drift may reduce model accuracy, introduce bias, or produce unsafe/unintended outcomes.
- Early detection allows fast investigation and remediation: retrain, recalibrate, rollback, or adjust features.
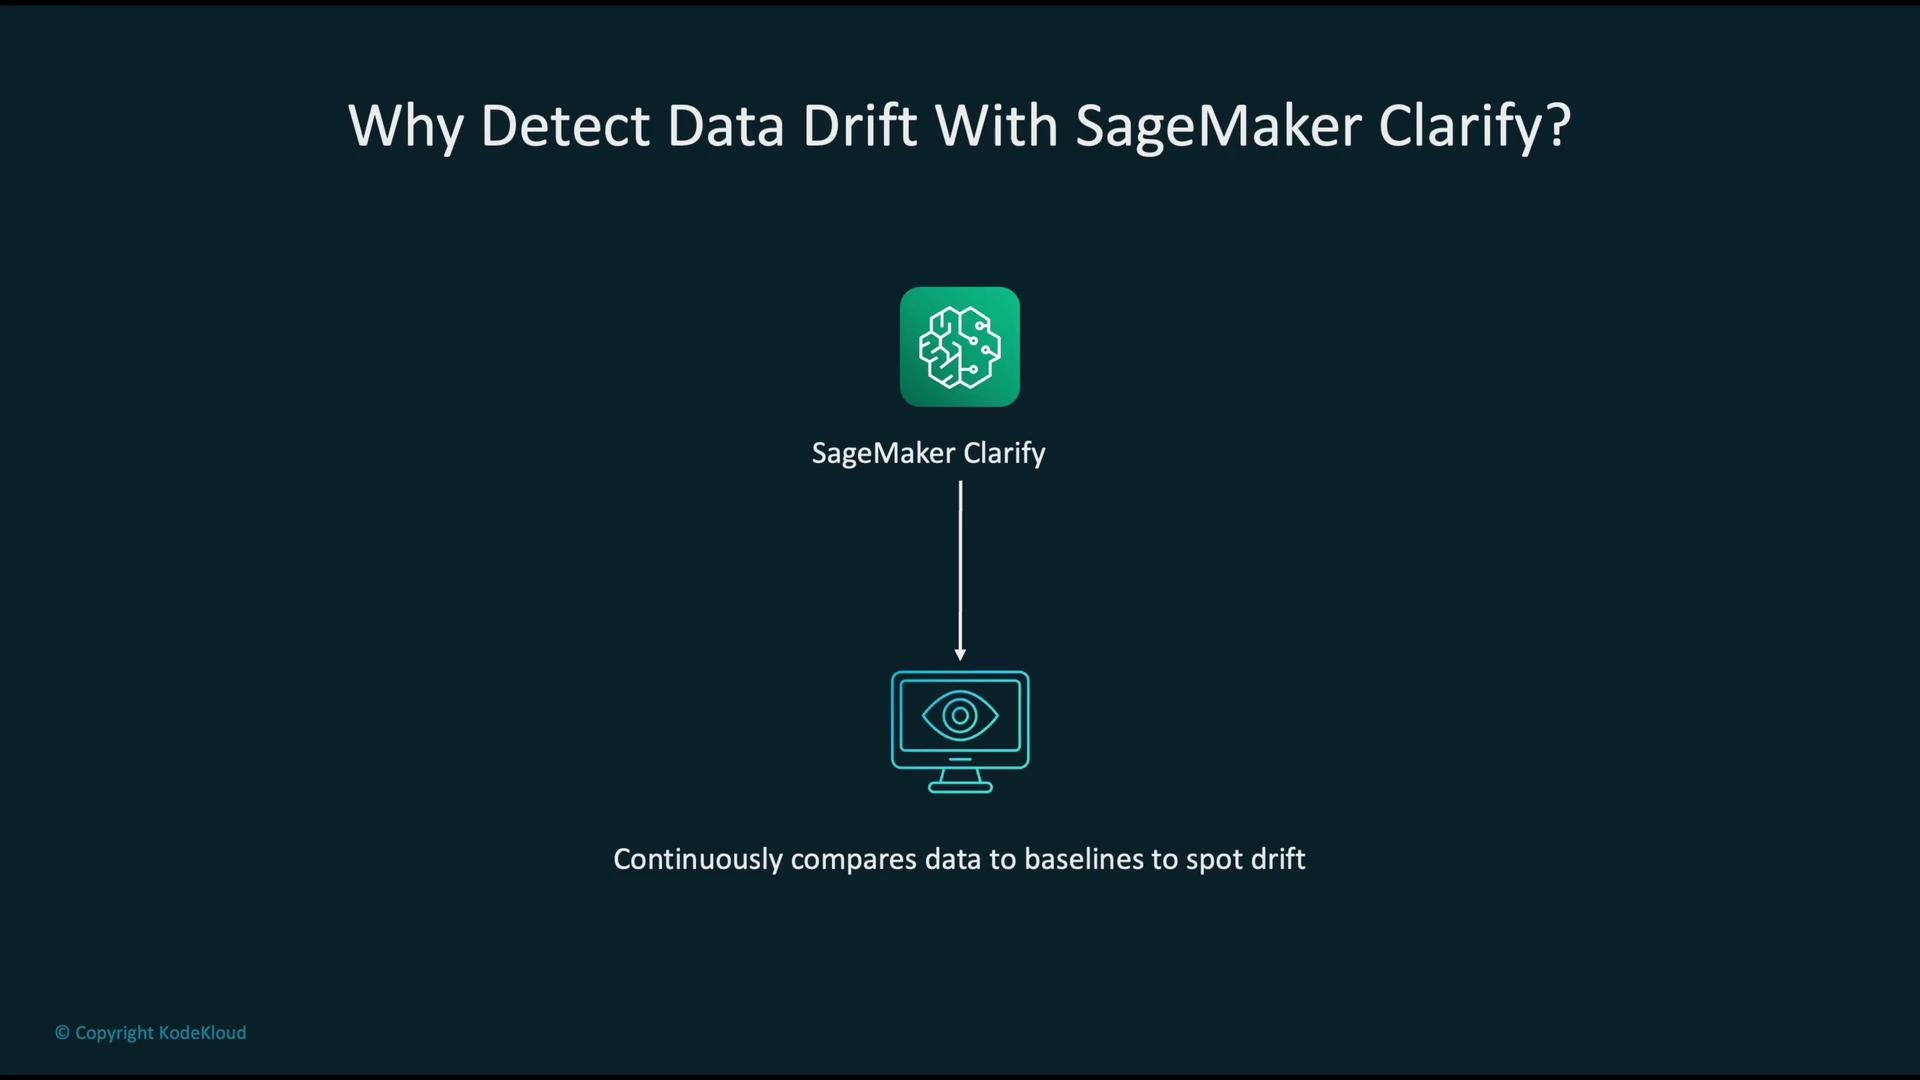
- Clarify compares live production records against a defined baseline dataset (commonly training or validation data).
- It calculates distributional statistics and drift scores per feature (e.g., population stability index, KS statistic).
- Clarify emits numeric metrics (to CloudWatch) and detailed reports (to S3) that monitoring and incident systems can consume.
Helpful references:
Example monitoring flow
- Baseline: store a baseline dataset (training/validation) in S3.
- Preprocess: format production data to match the baseline.
- Clarify Job: run Clarify to compute per-feature drift metrics.
- Output: Clarify writes numeric metrics + HTML/JSON reports to S3 and sends metrics to CloudWatch.
- Alerting: CloudWatch Alarms fire on thresholds and notify via SNS or invoke Lambda for automated action.
- Schedule Clarify or Model Monitor jobs at intervals that match your data velocity (hourly, daily, etc.).
- Select meaningful metrics and thresholds (balance sensitivity vs. false positives).
- Persist Clarify reports and raw inputs for forensic analysis and compliance.
- A manual review channel (email, ticketing system, or chat ops for ML engineers), or
- An automated remediation pipeline that retrains, validates, and deploys a new model, or
- A hybrid approach: auto-run diagnostics with human approval before deploy.
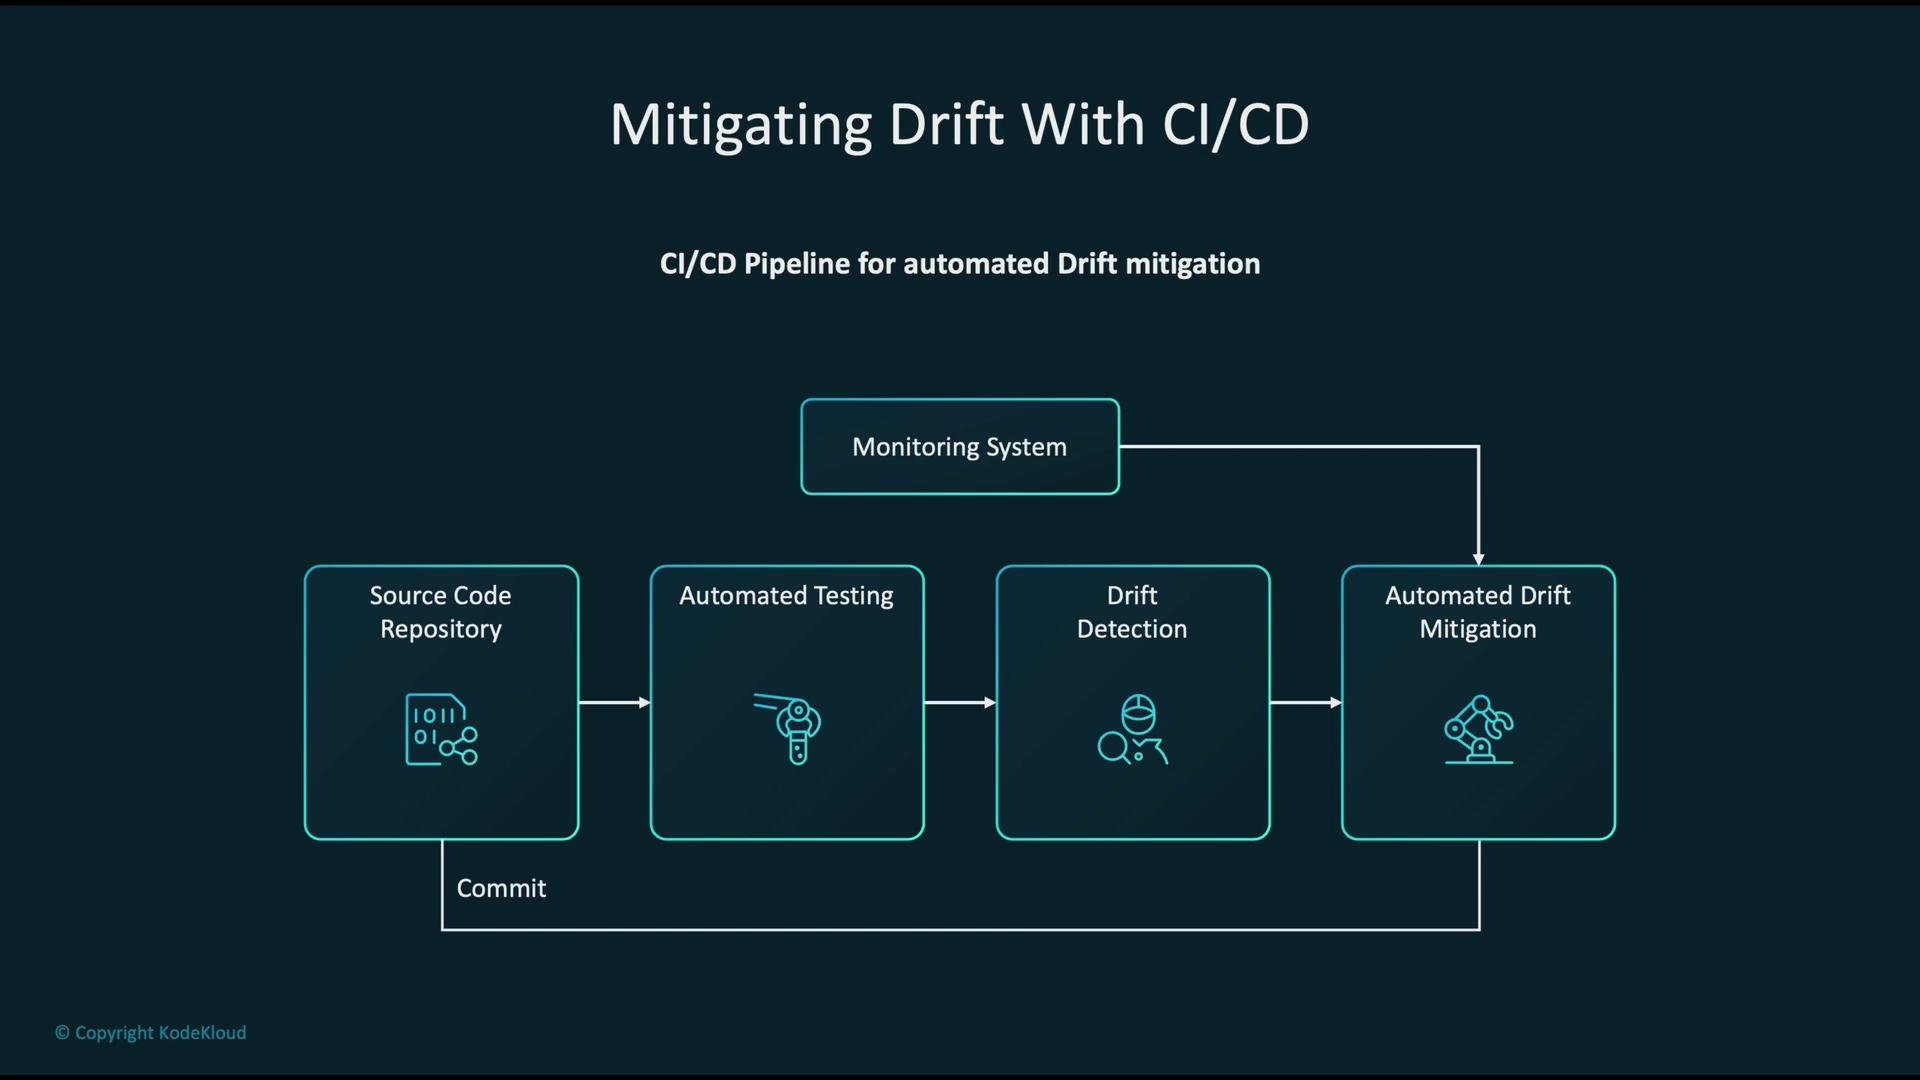
- Desired state in source control (model code, infra-as-code).
- Automated tests and validation guardrails (unit tests, integration, data checks).
- Drift detection logic confirms degradation with metrics and validation runs.
- If confirmed, pipeline performs retraining, validation, and deploys to staging/production based on policy.
- Commit any corrective code/data updates back to the repository to keep the source of truth current.
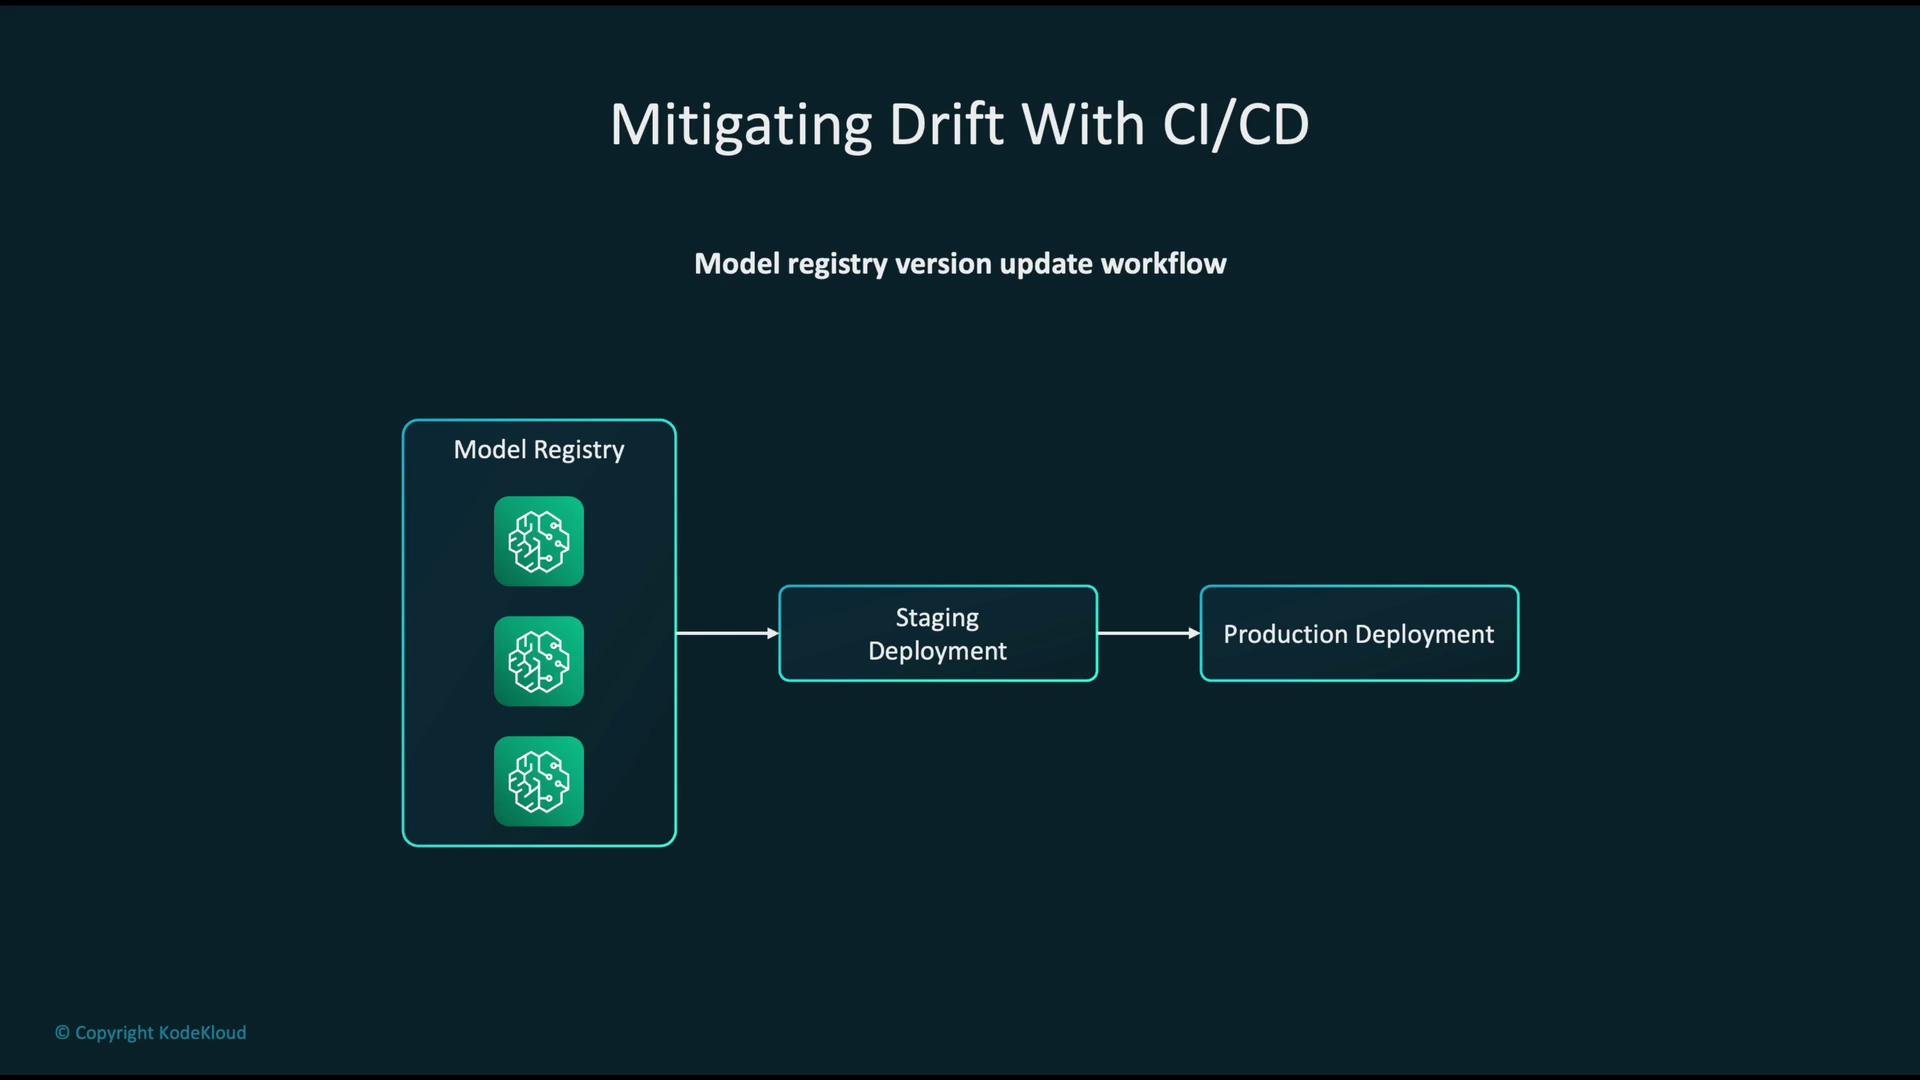
- Use a model registry (SageMaker Model Registry or similar) to store versioned models and metadata.
- Deploy candidates to staging for validation tests (including drift and performance checks).
- Promote to production only after passing validation and maintain rollback capability to revert quickly if regressions occur.
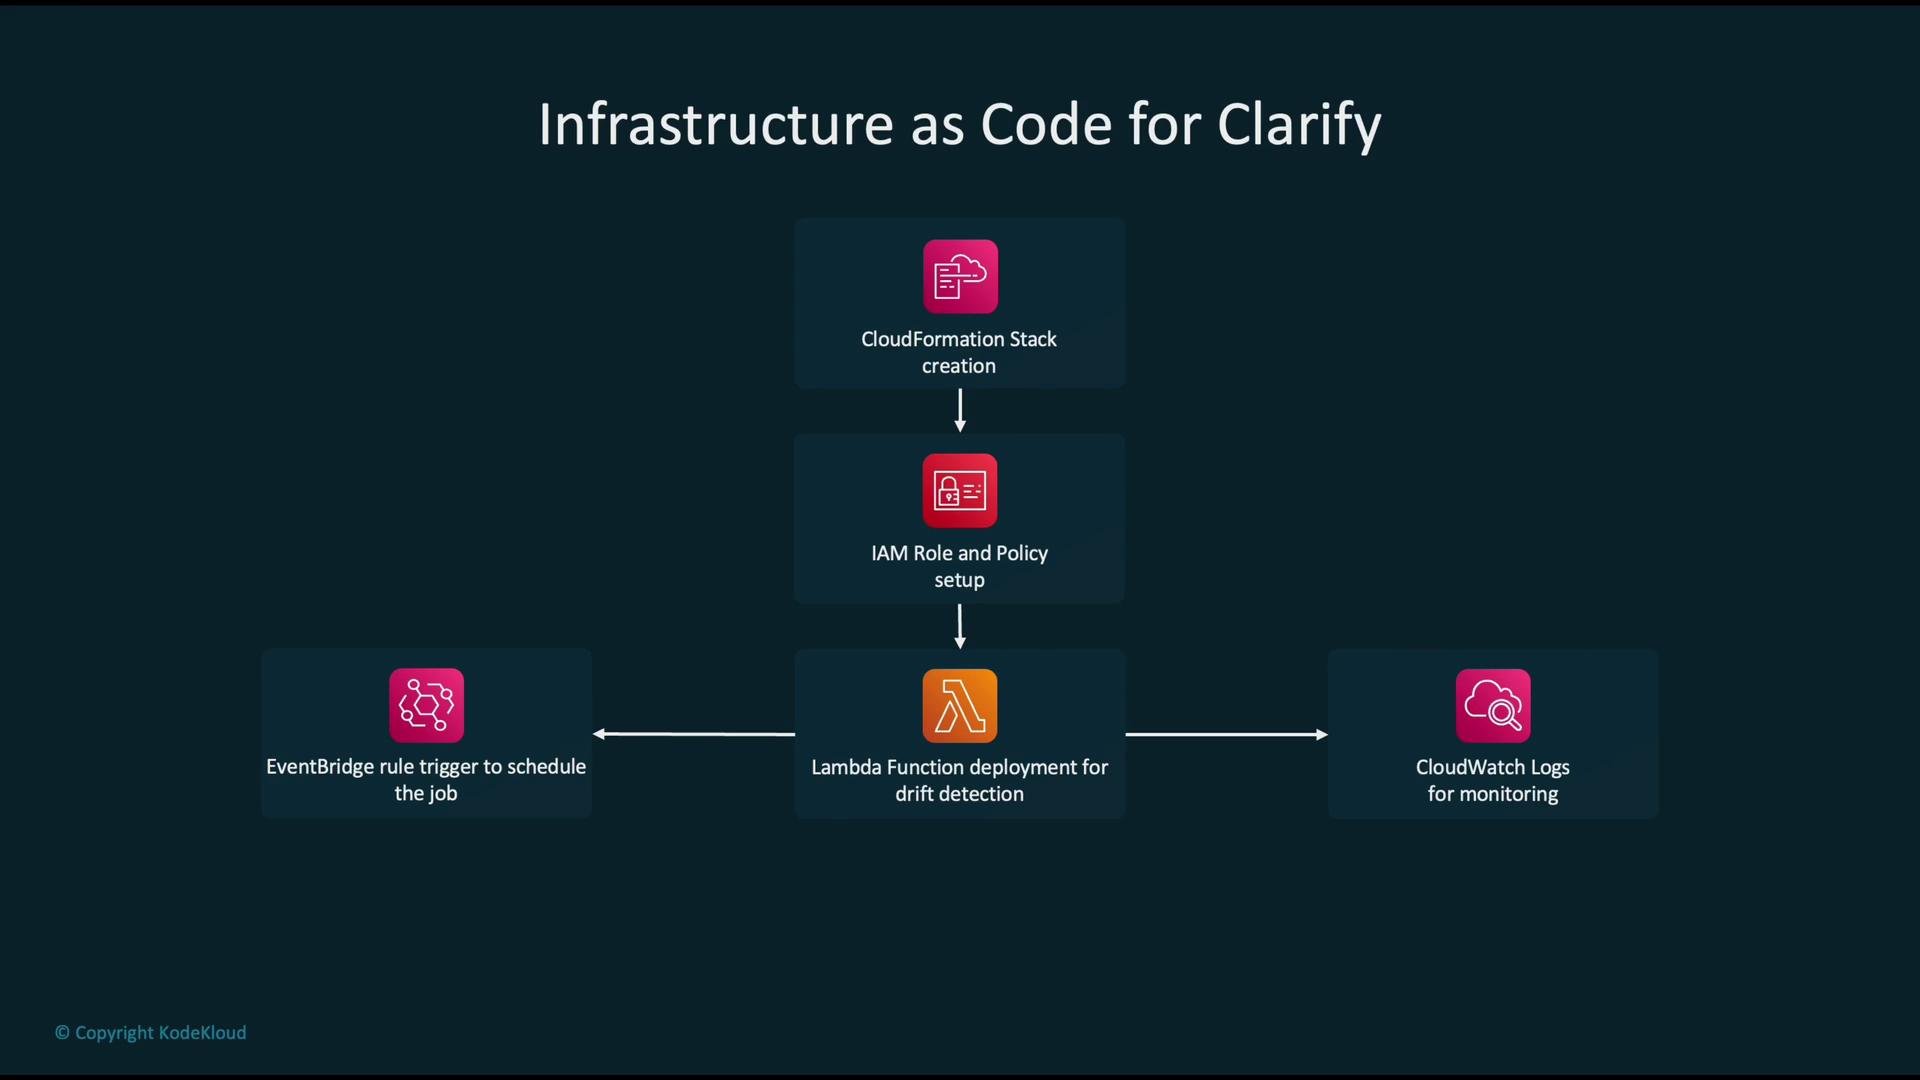
- Provision monitoring infrastructure (IAM roles, Lambda, EventBridge, S3, CloudWatch log groups) using CloudFormation, AWS CDK, or Terraform.
- Use EventBridge schedules to trigger Clarify jobs or Lambda orchestrators.
- Ensure runtime activities and detections are logged to CloudWatch for audit and troubleshooting.
- When drift is detected, notify via SNS and optionally kick off retraining pipelines.
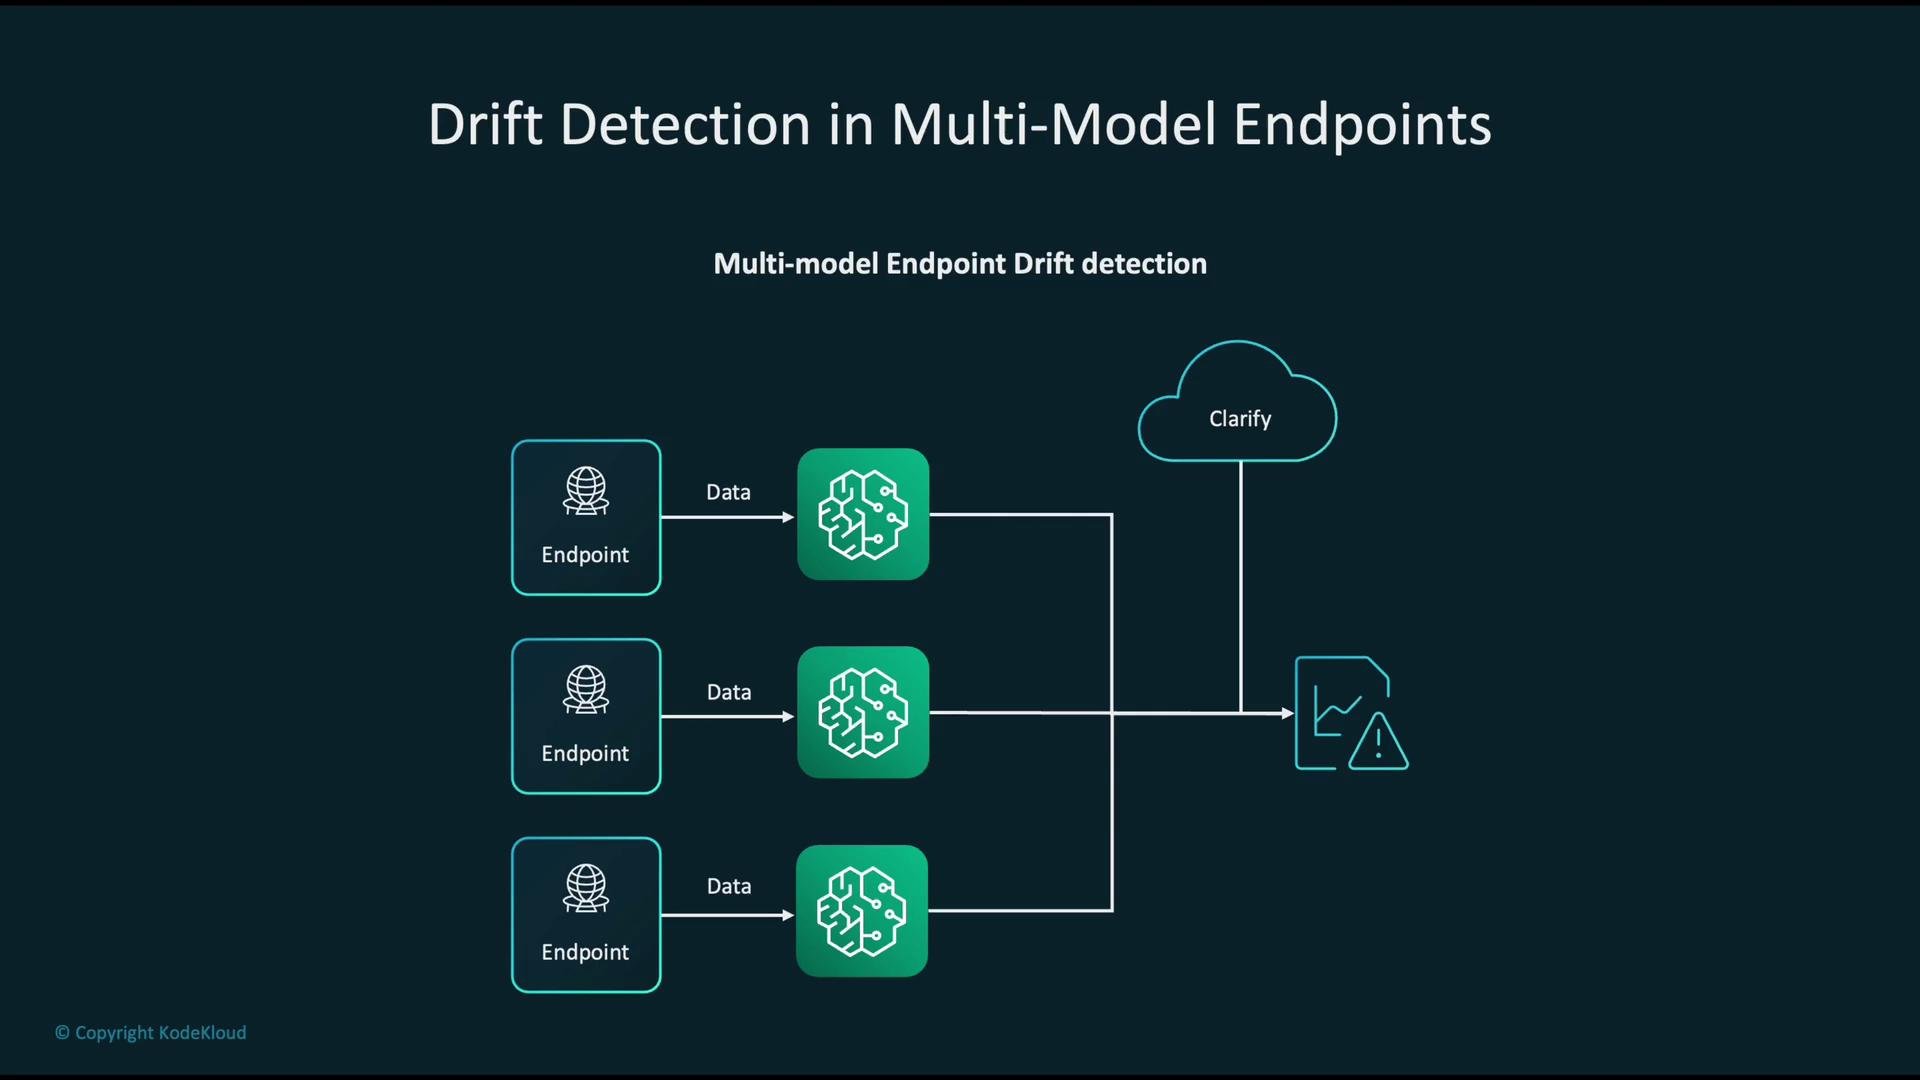
- For many endpoints or multi-model endpoints, collect per-endpoint metrics and prediction logs.
- Centralize predictions and input features for aggregate drift analysis with Clarify.
- This helps identify which endpoints or models are drifting so remediation can target the correct scope.
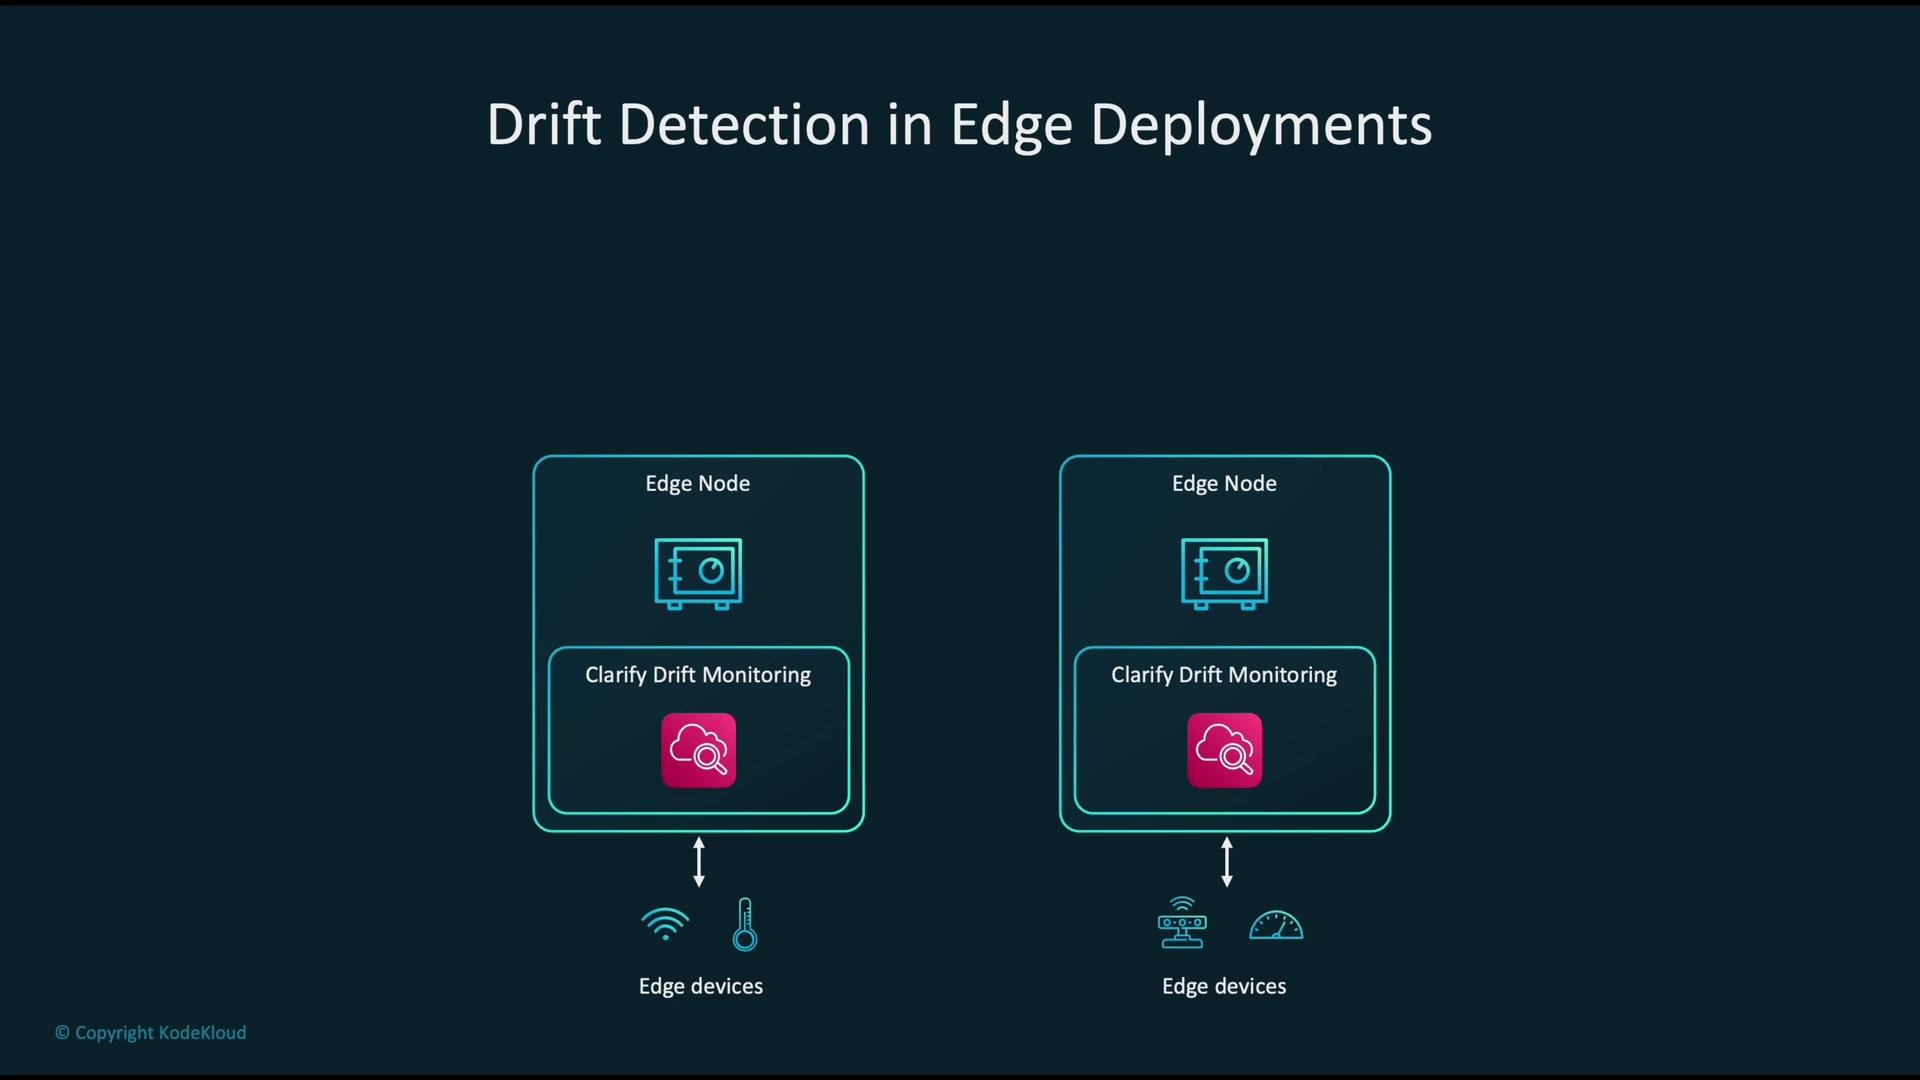
- Sync models and baseline data from cloud to edge nodes.
- Run lightweight local drift monitoring at the edge to detect anomalies close to the data source.
- Aggregate and send summarized drift metrics back to cloud for centralized analysis and coordinated remediation.
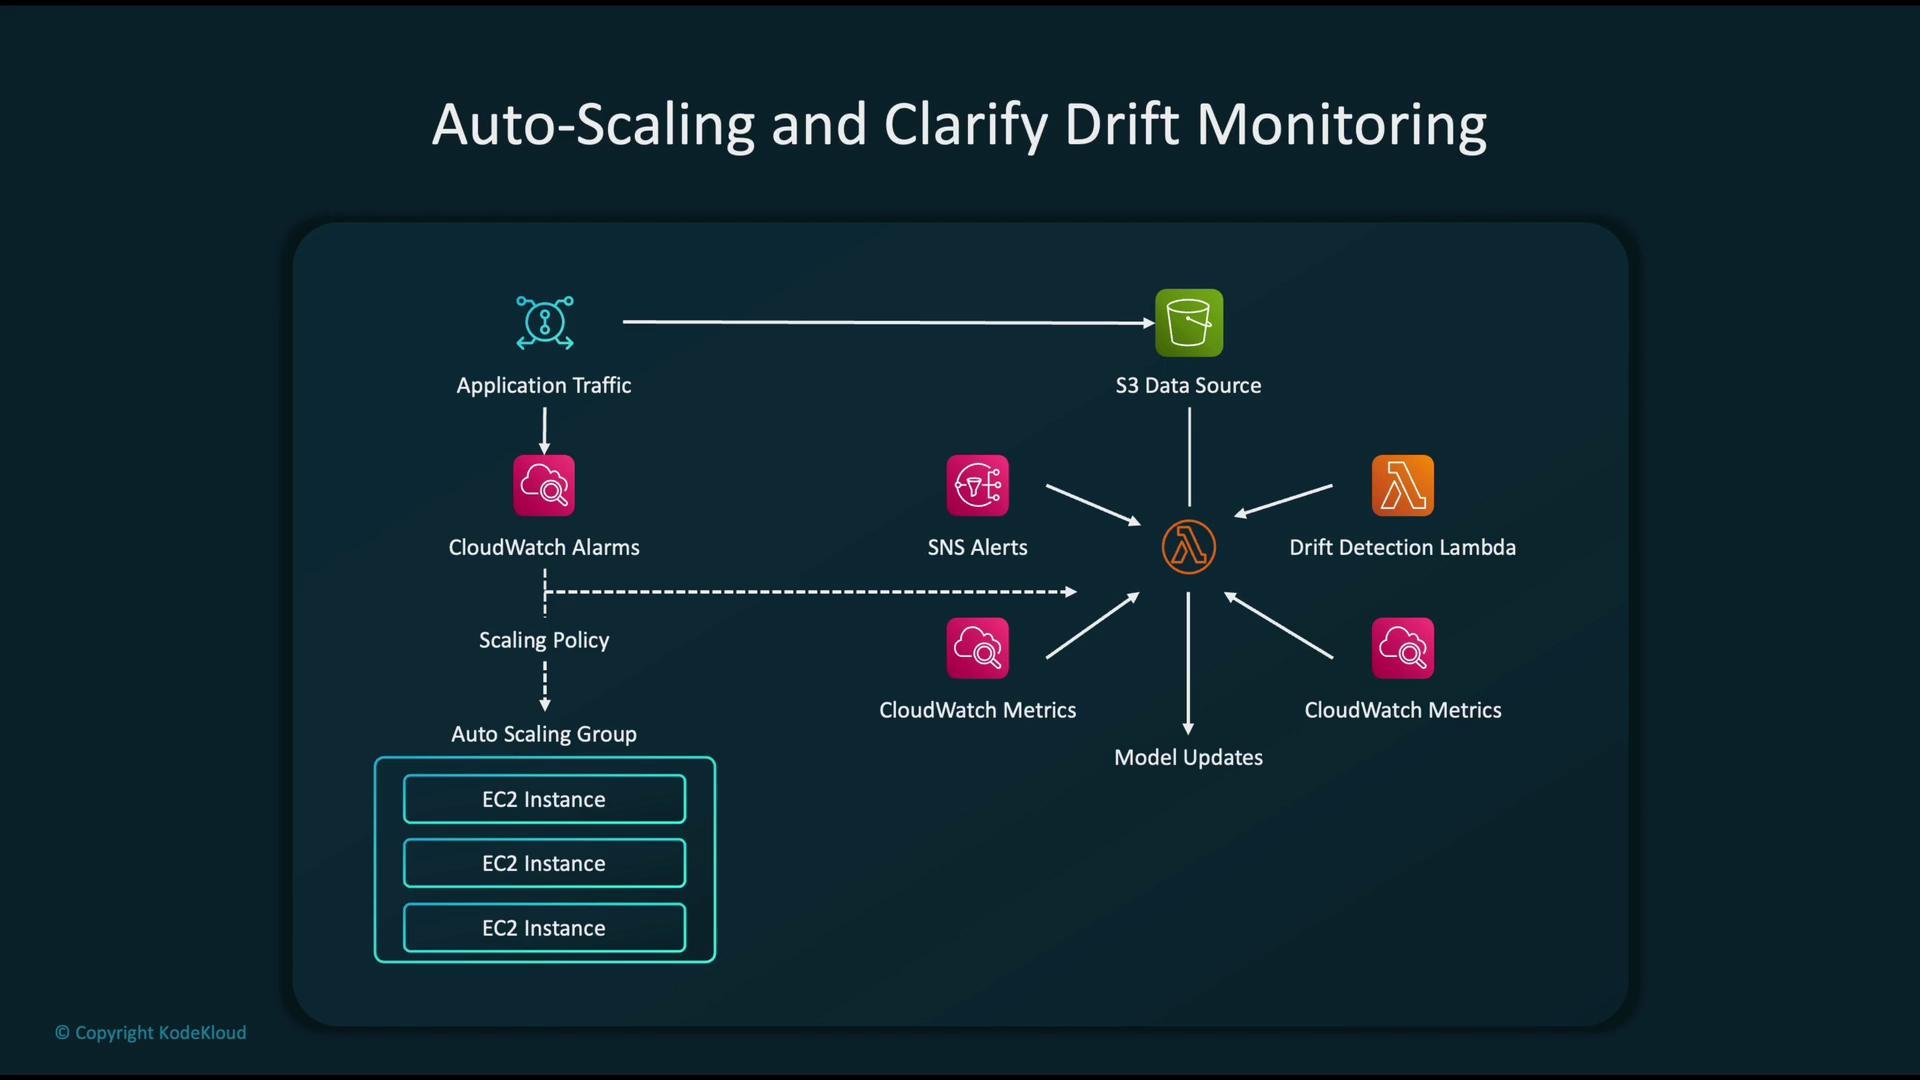
- Use CloudWatch application and traffic metrics to drive Auto Scaling policies.
- Persist prediction logs and application logs in S3 for historical drift analysis.
- Lambda functions can periodically analyze logs and trigger retraining/model updates when drift or performance degradation is detected, while Auto Scaling manages capacity.
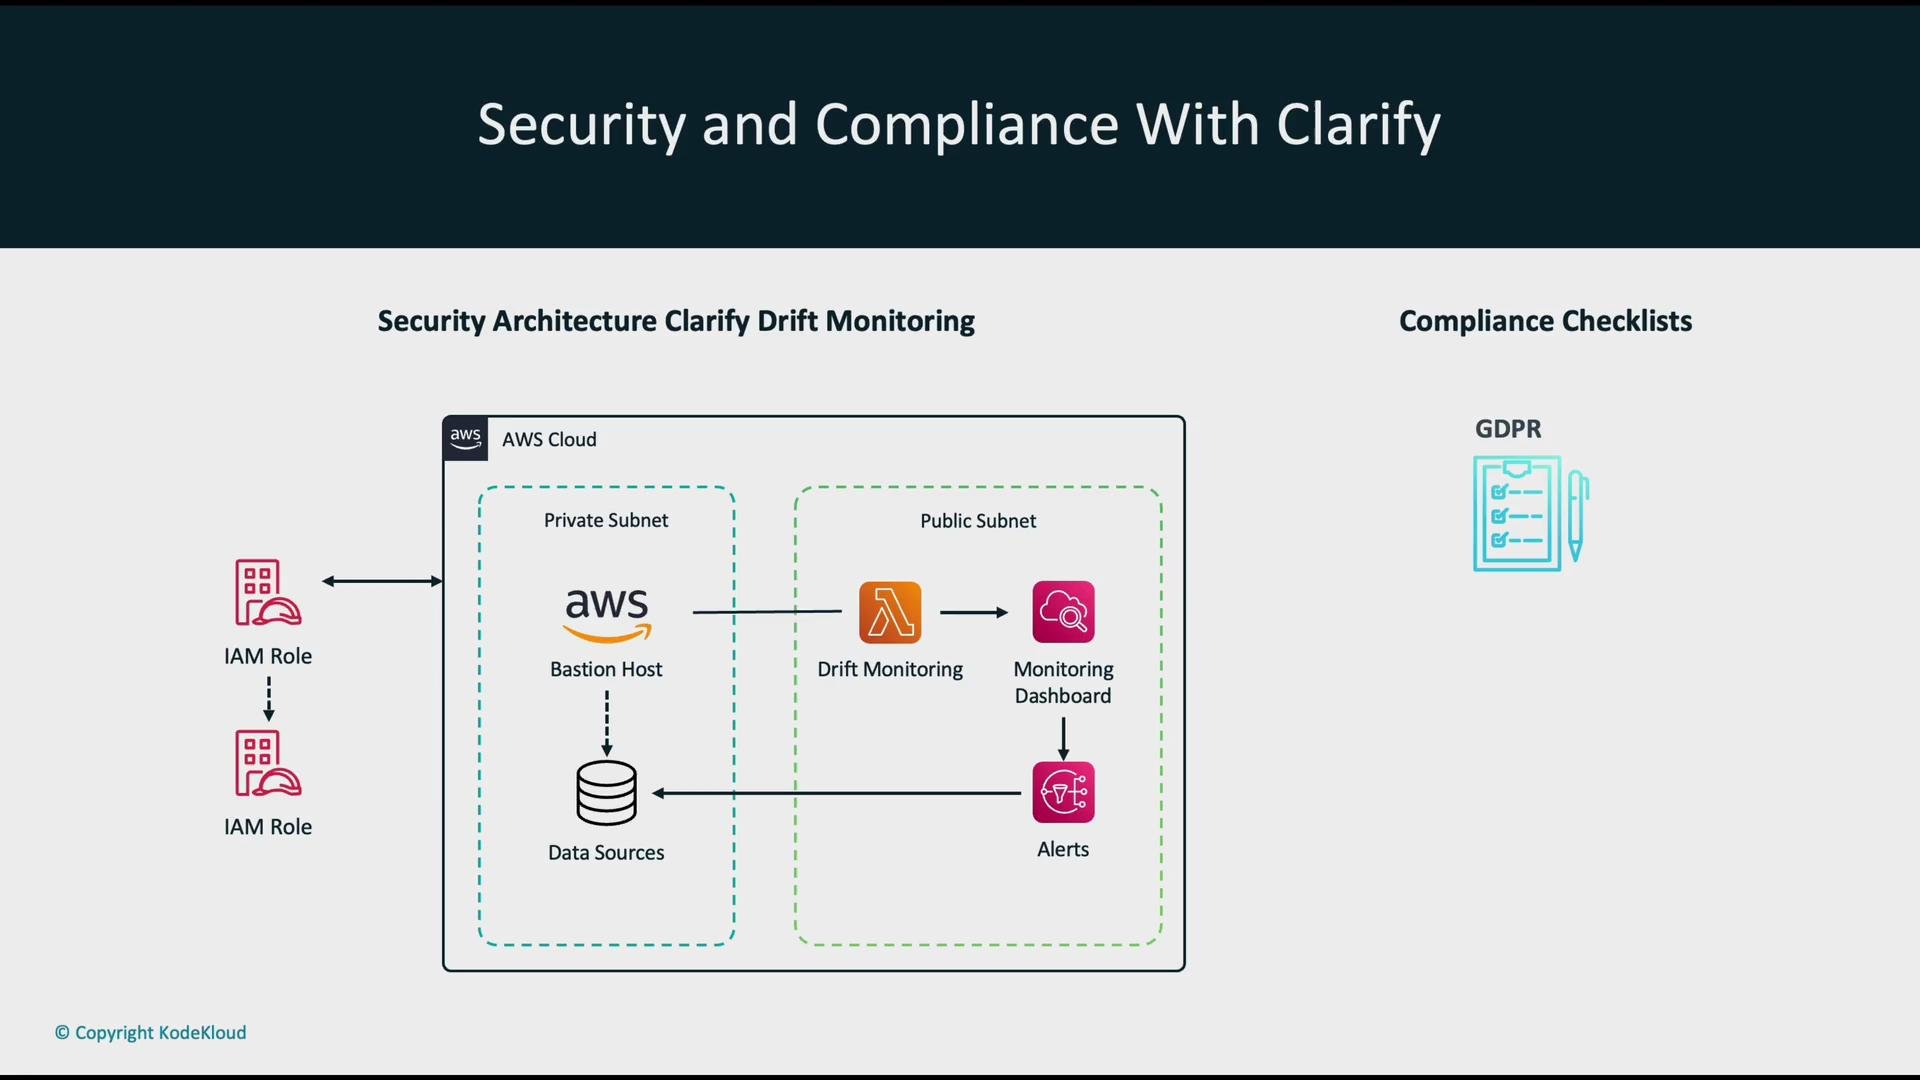
- Grant least-privilege IAM roles for Clarify, Model Monitor, Lambda, and pipeline components.
- Use a bastion host or secure admin paths in private subnets and isolate critical data sources.
- Ensure logging, encryption (in transit and at rest), and fine-grained access controls.
- Persist Clarify reports and audit trails for regulatory compliance (GDPR, HIPAA, PCI DSS).
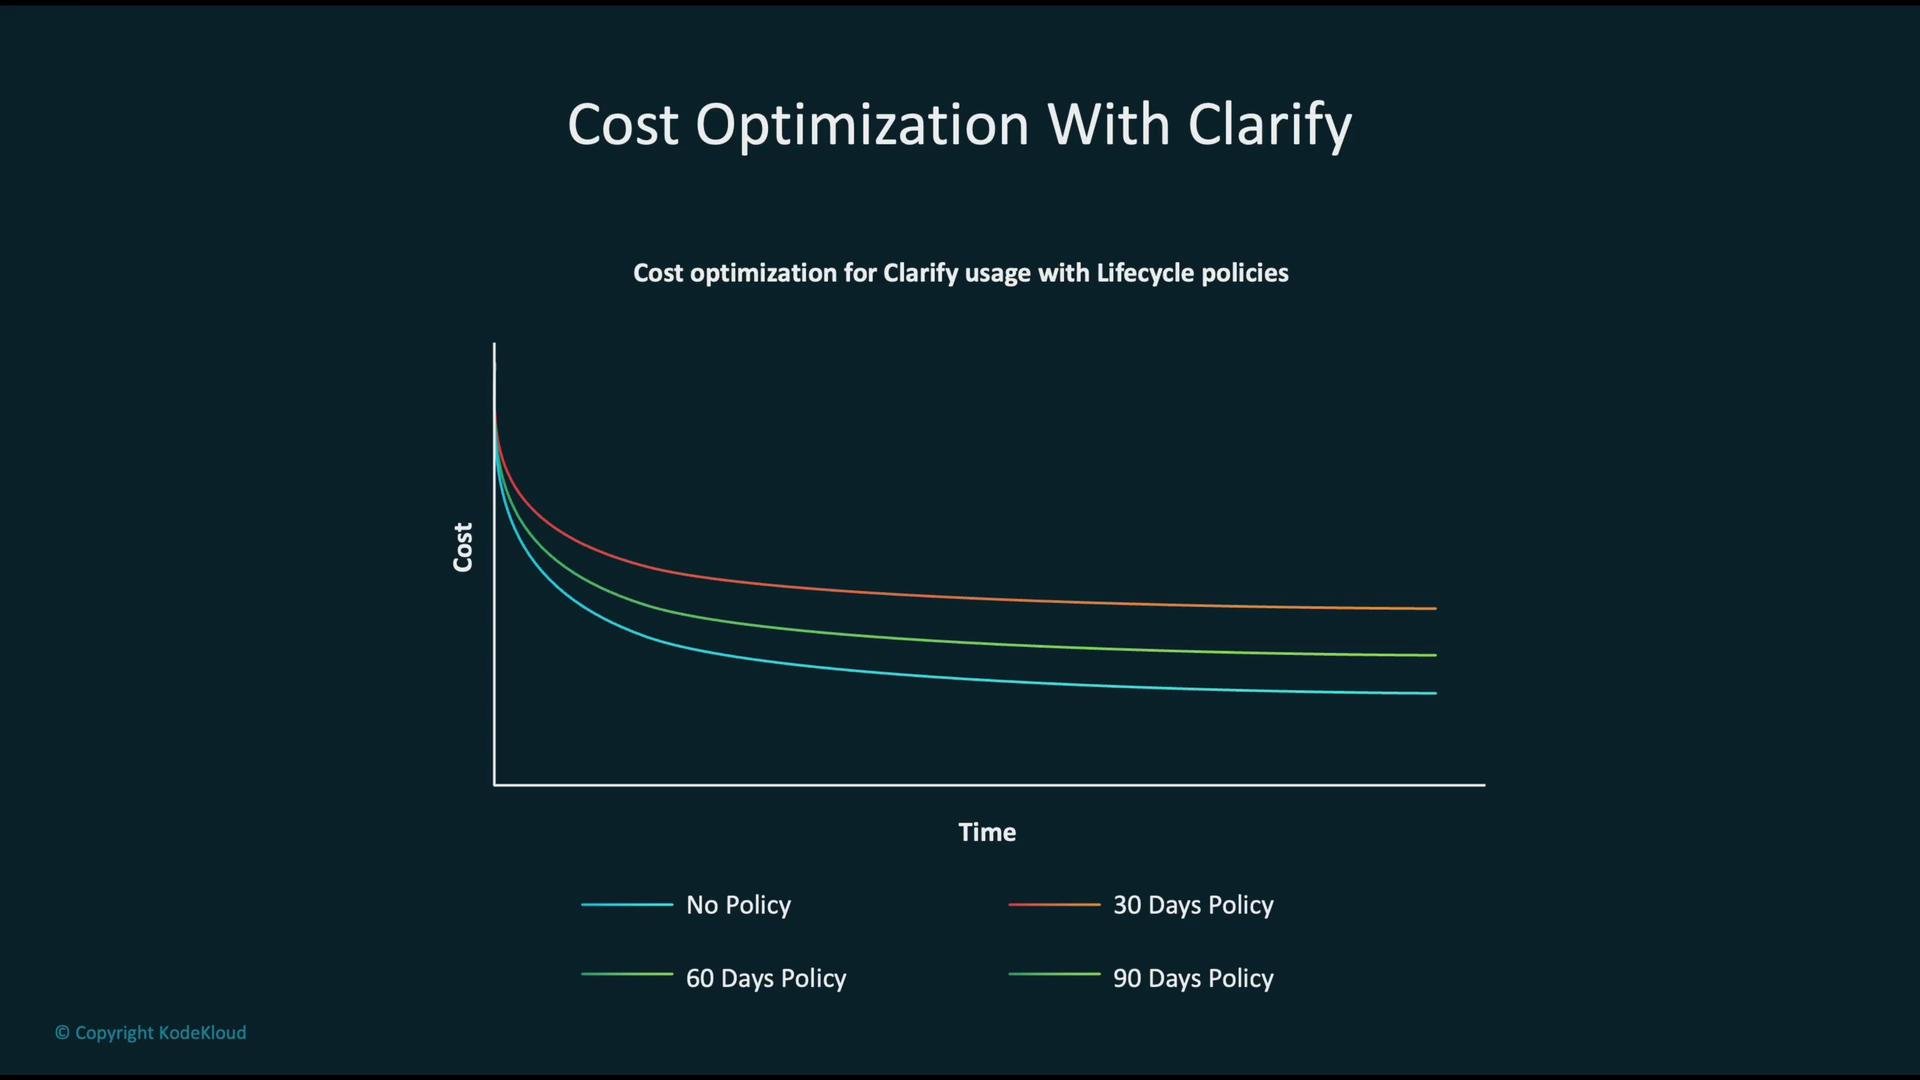
- Store Clarify reports and artifacts in S3 and apply lifecycle policies to transition or delete older objects.
- Shorter retention reduces storage cost but keep enough history for forensic and compliance needs.
- Examples: 30, 60, or 90-day retention windows depending on business and regulatory requirements.
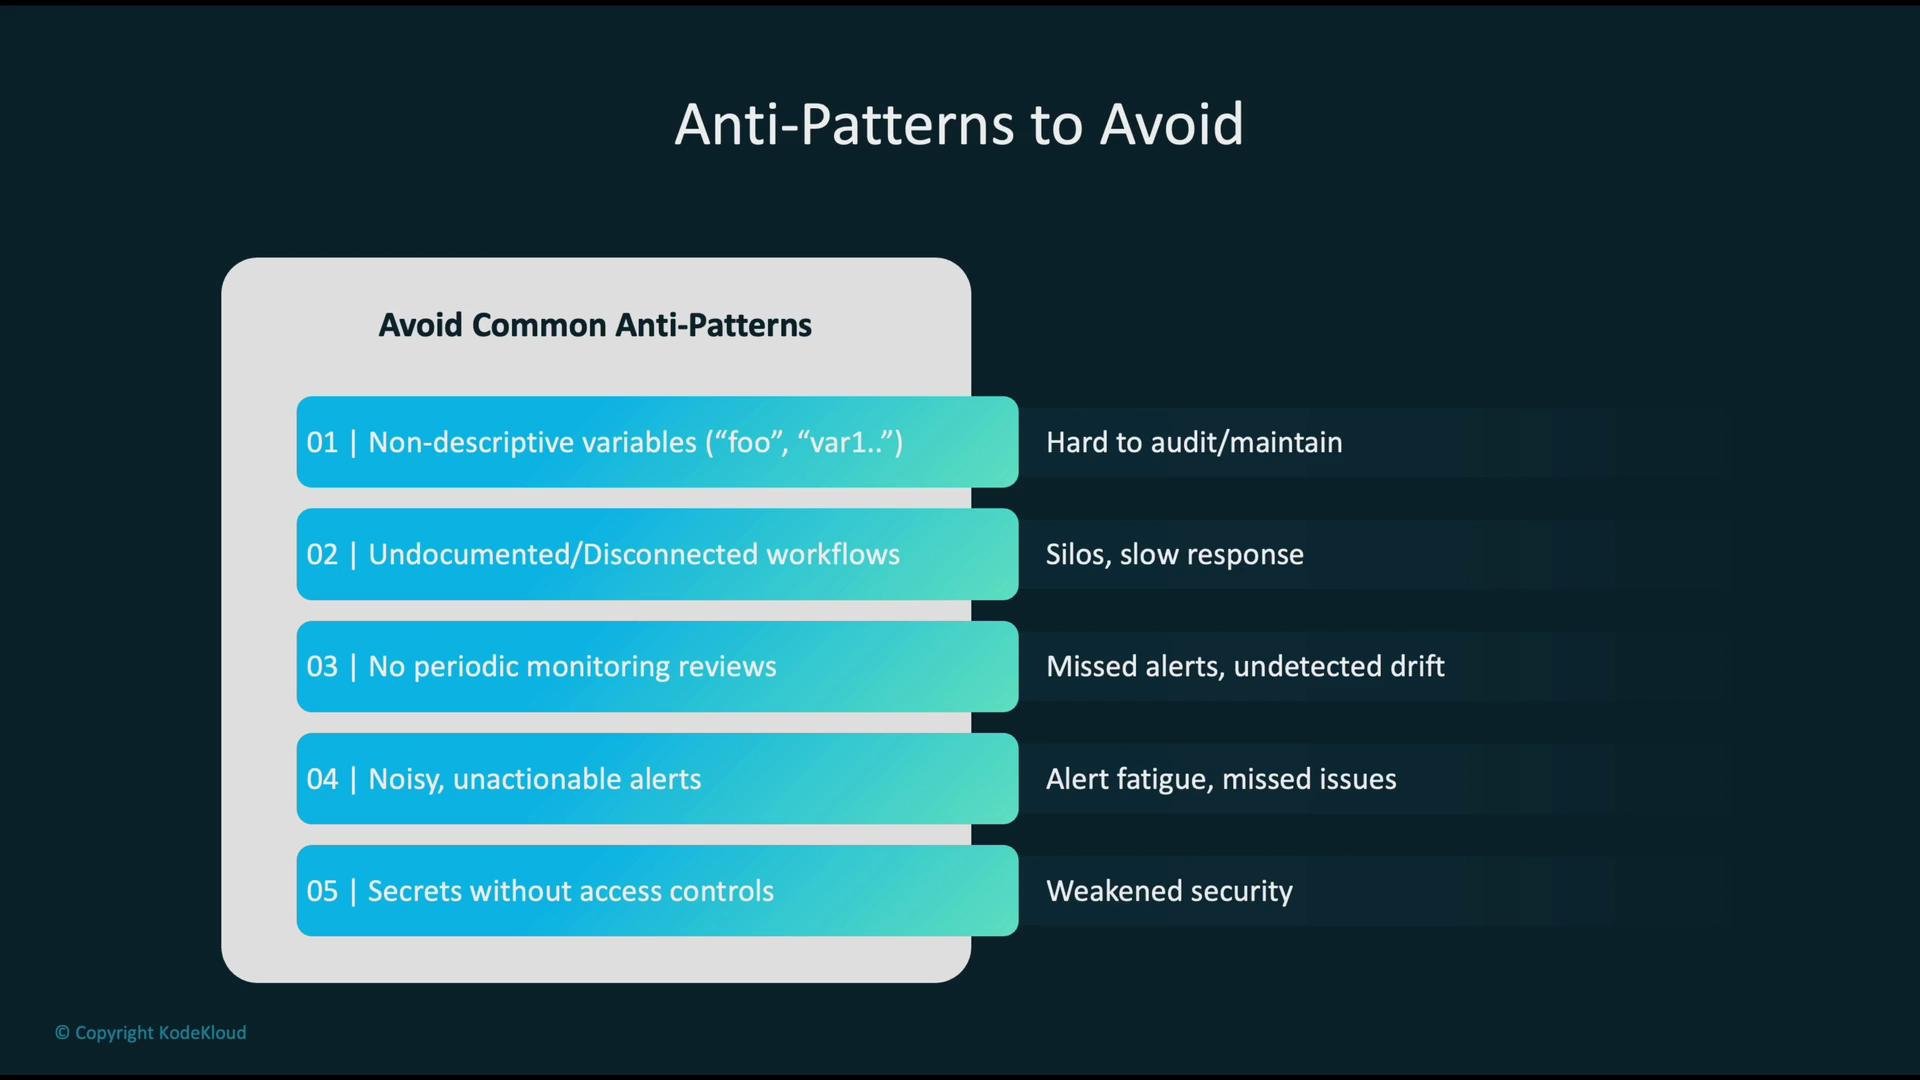
- Non-descriptive variable names (e.g.,
foo,var1) that hinder audits and debugging. - Undocumented or disconnected workflows that create knowledge silos.
- Skipping regular reviews of monitoring thresholds, leading to missed detections.
- Noisy, unactionable alerts that cause alert fatigue.
- Storing secrets without proper access control.
- Continuously monitor endpoints, logs, and storage with CloudWatch dashboards.
- Establish and document a clear baseline dataset for drift comparison.
- Configure precise metrics and CloudWatch Alarms; notify on-call systems and automated pipelines via SNS.
- Regularly analyze for drift, model-quality degradation, and emerging bias; keep detailed audit logs and reports.
- Define retraining protocols, validation gates, and safe rollback procedures.
- Apply strong security controls (least-privilege IAM, secure networking, secret management).
- Ensure regulatory compliance and retain sufficient audit data.
- Use S3 lifecycle rules to balance cost vs. auditability.
When defining drift thresholds, consider both statistical significance and business impact. Tune metric thresholds and validation tests so you act on real regressions rather than transient noise.