

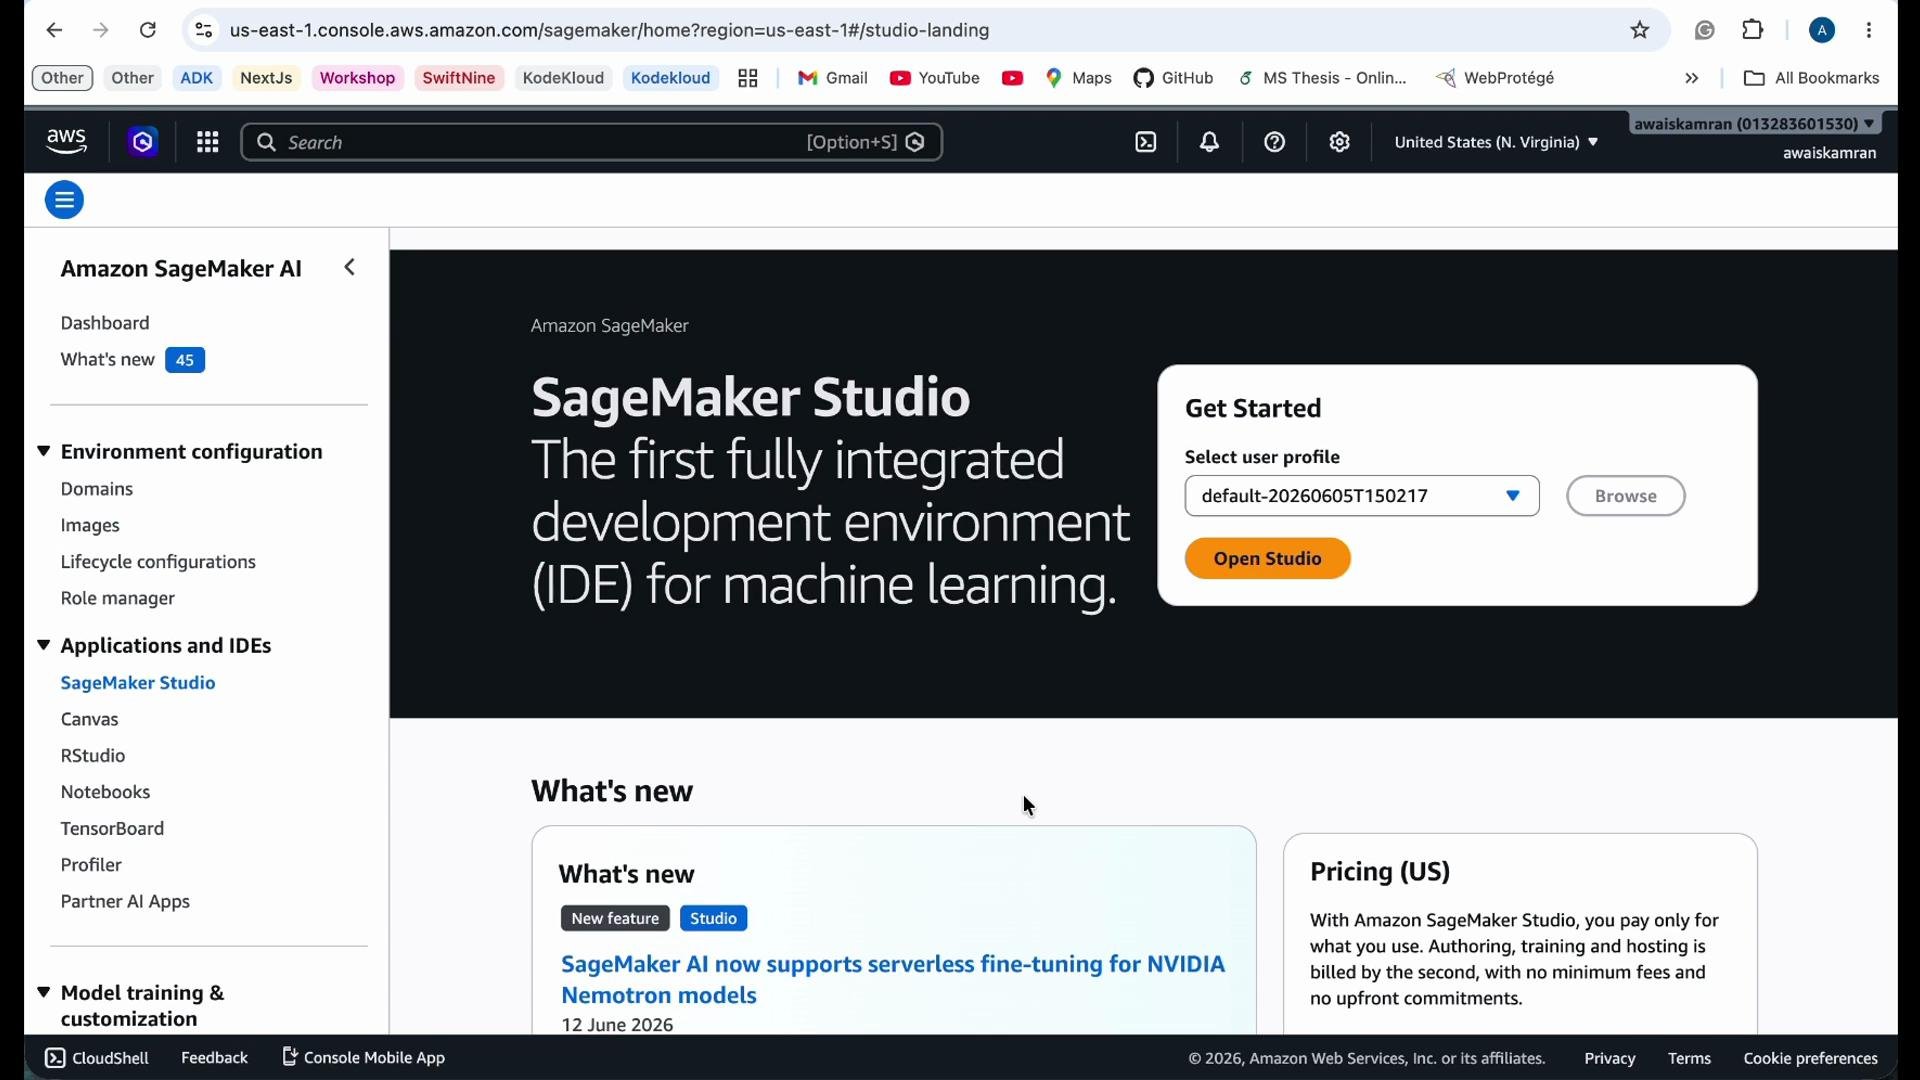
- Choose a JumpStart model to deploy
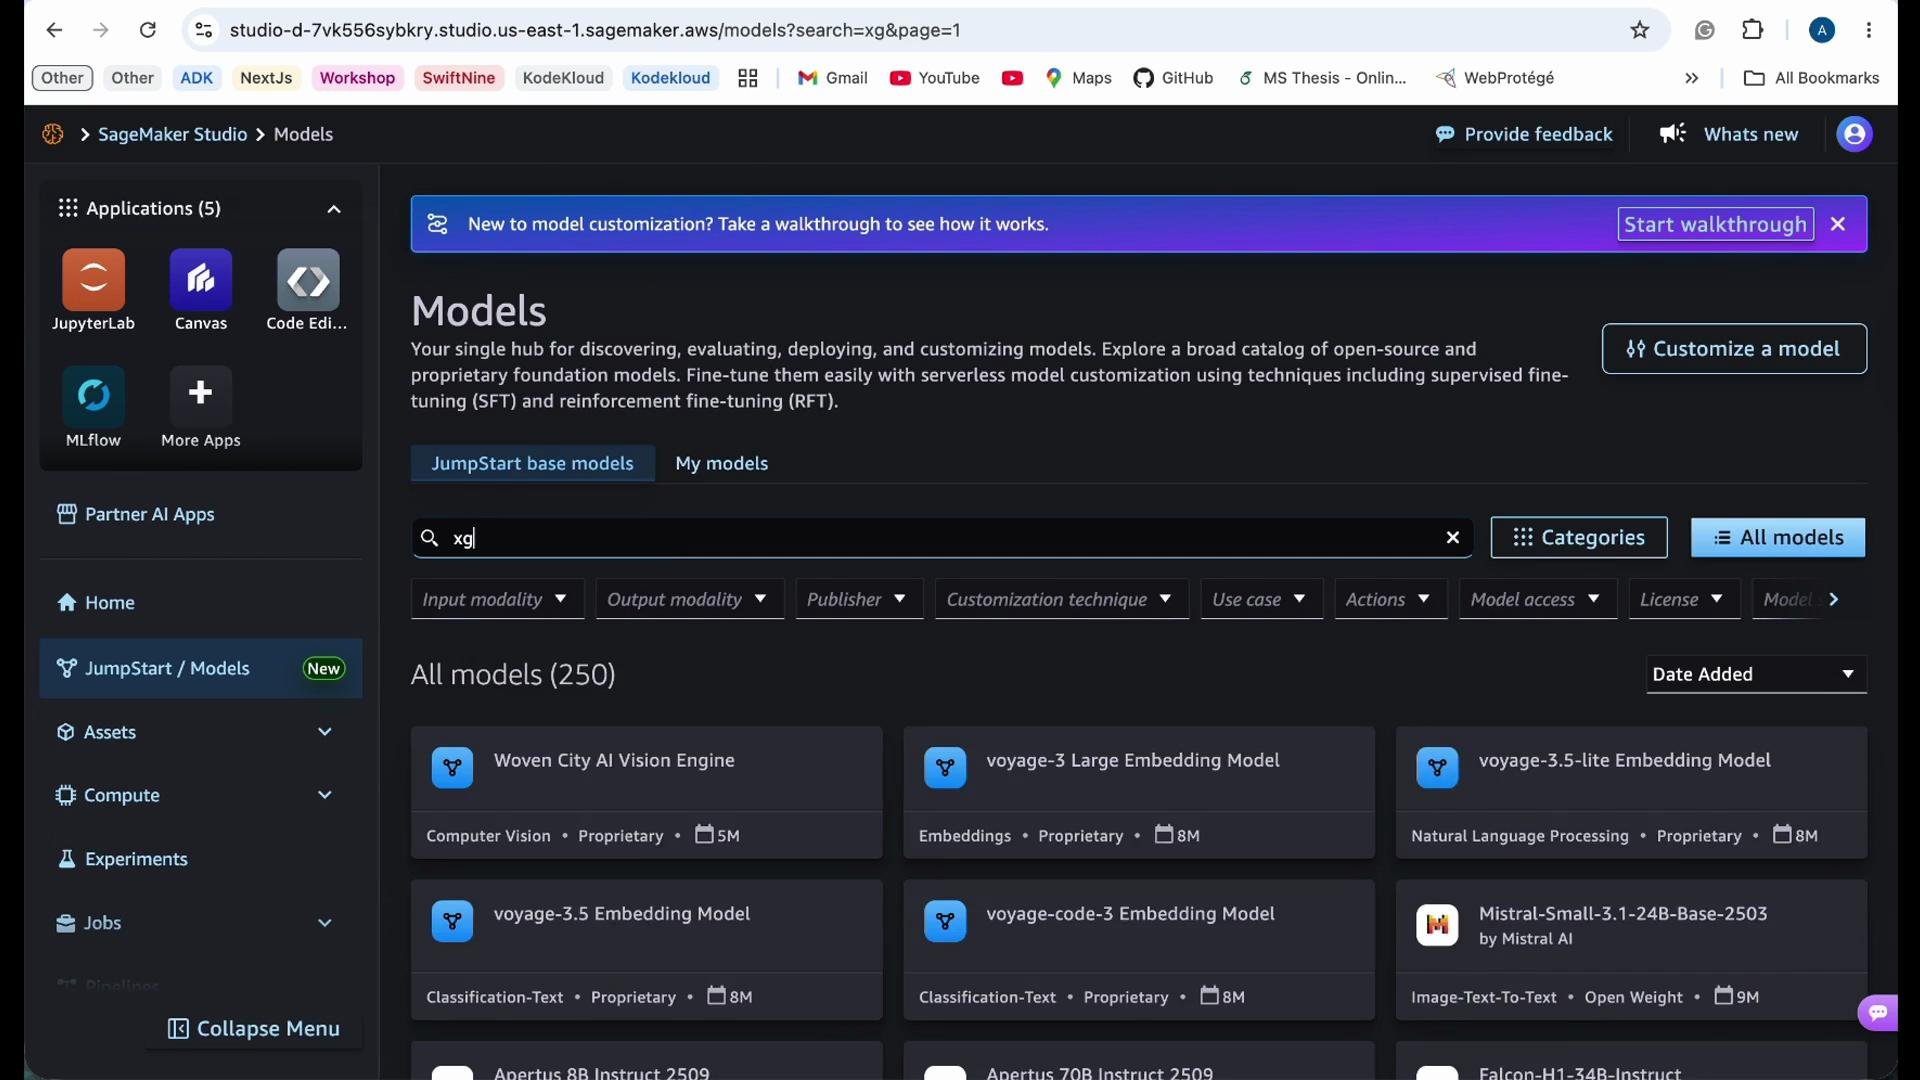
- In SageMaker Studio, open JumpStart and pick a small, easy-to-deploy model (good candidates: XGBoost classification/regression, small scikit-learn models).
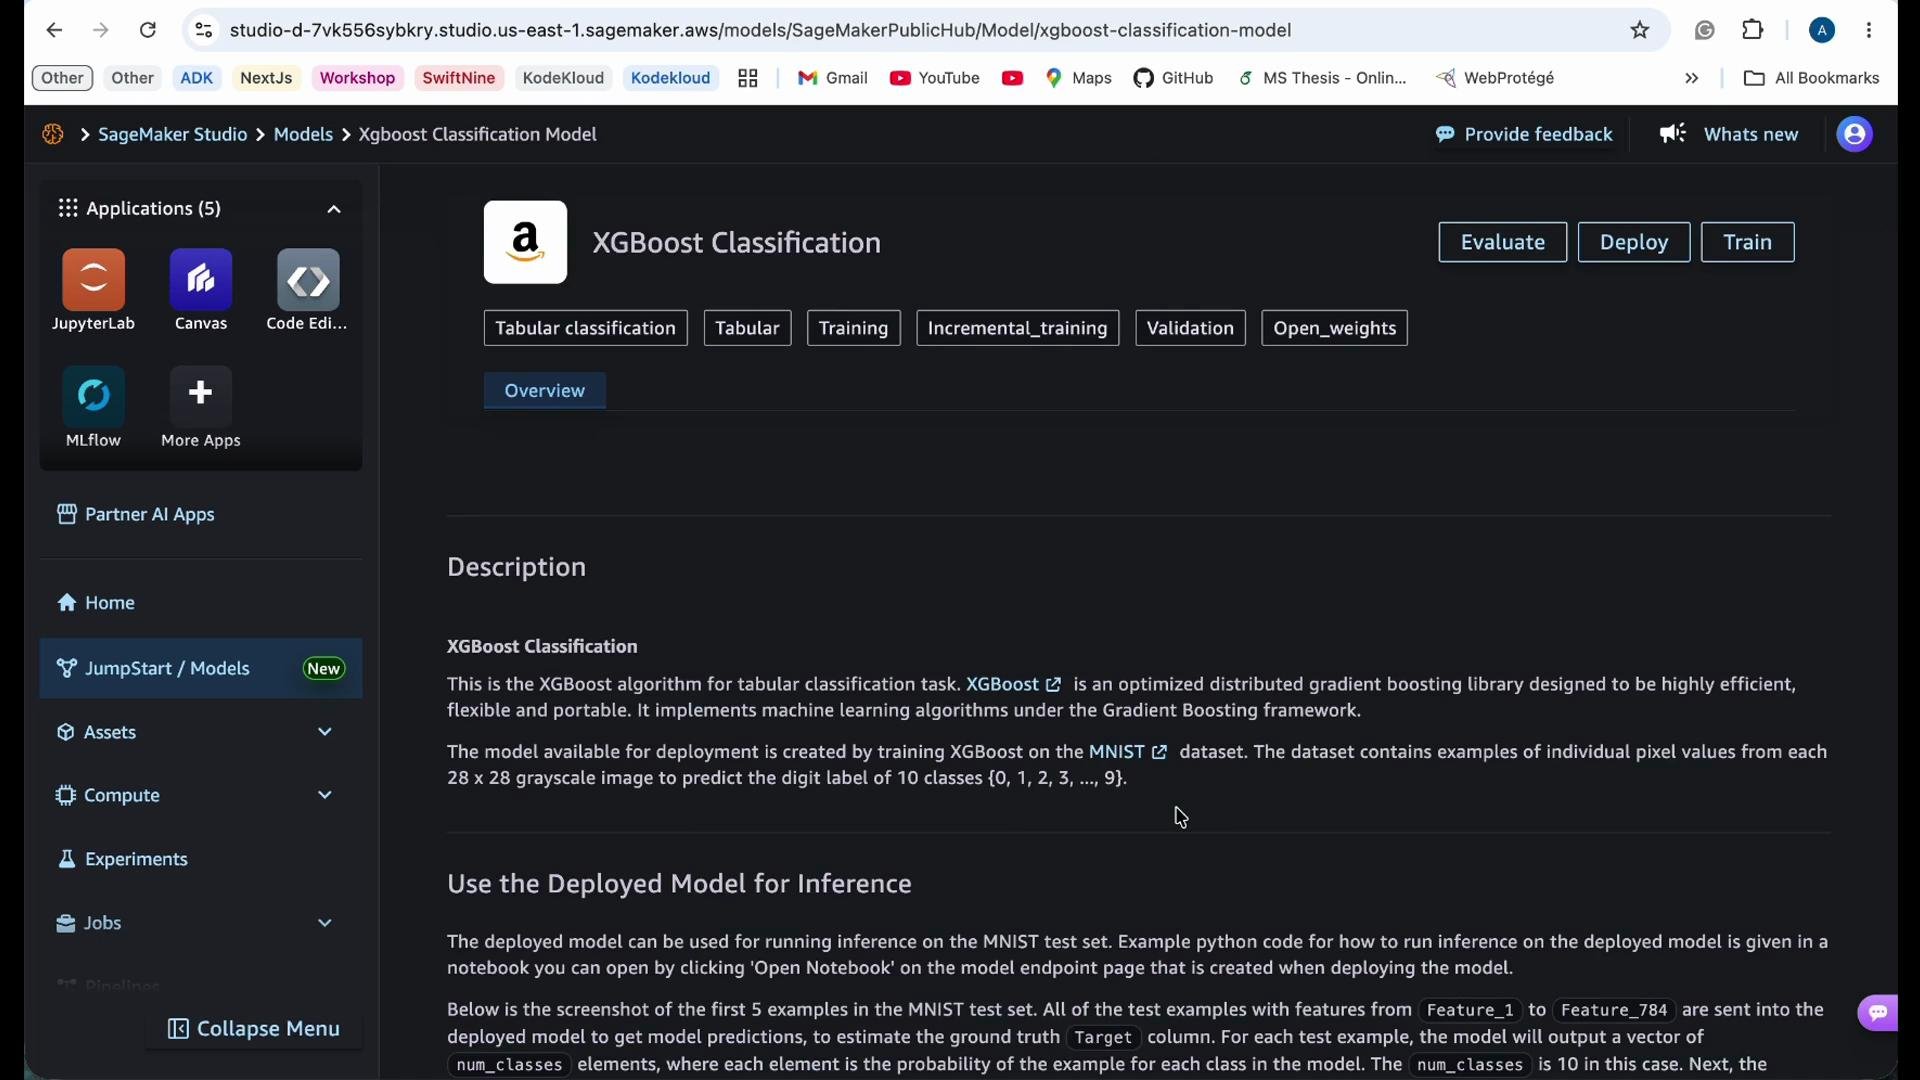
- For this demo we deploy an XGBoost classification model.
- Choose instance type for the endpoint
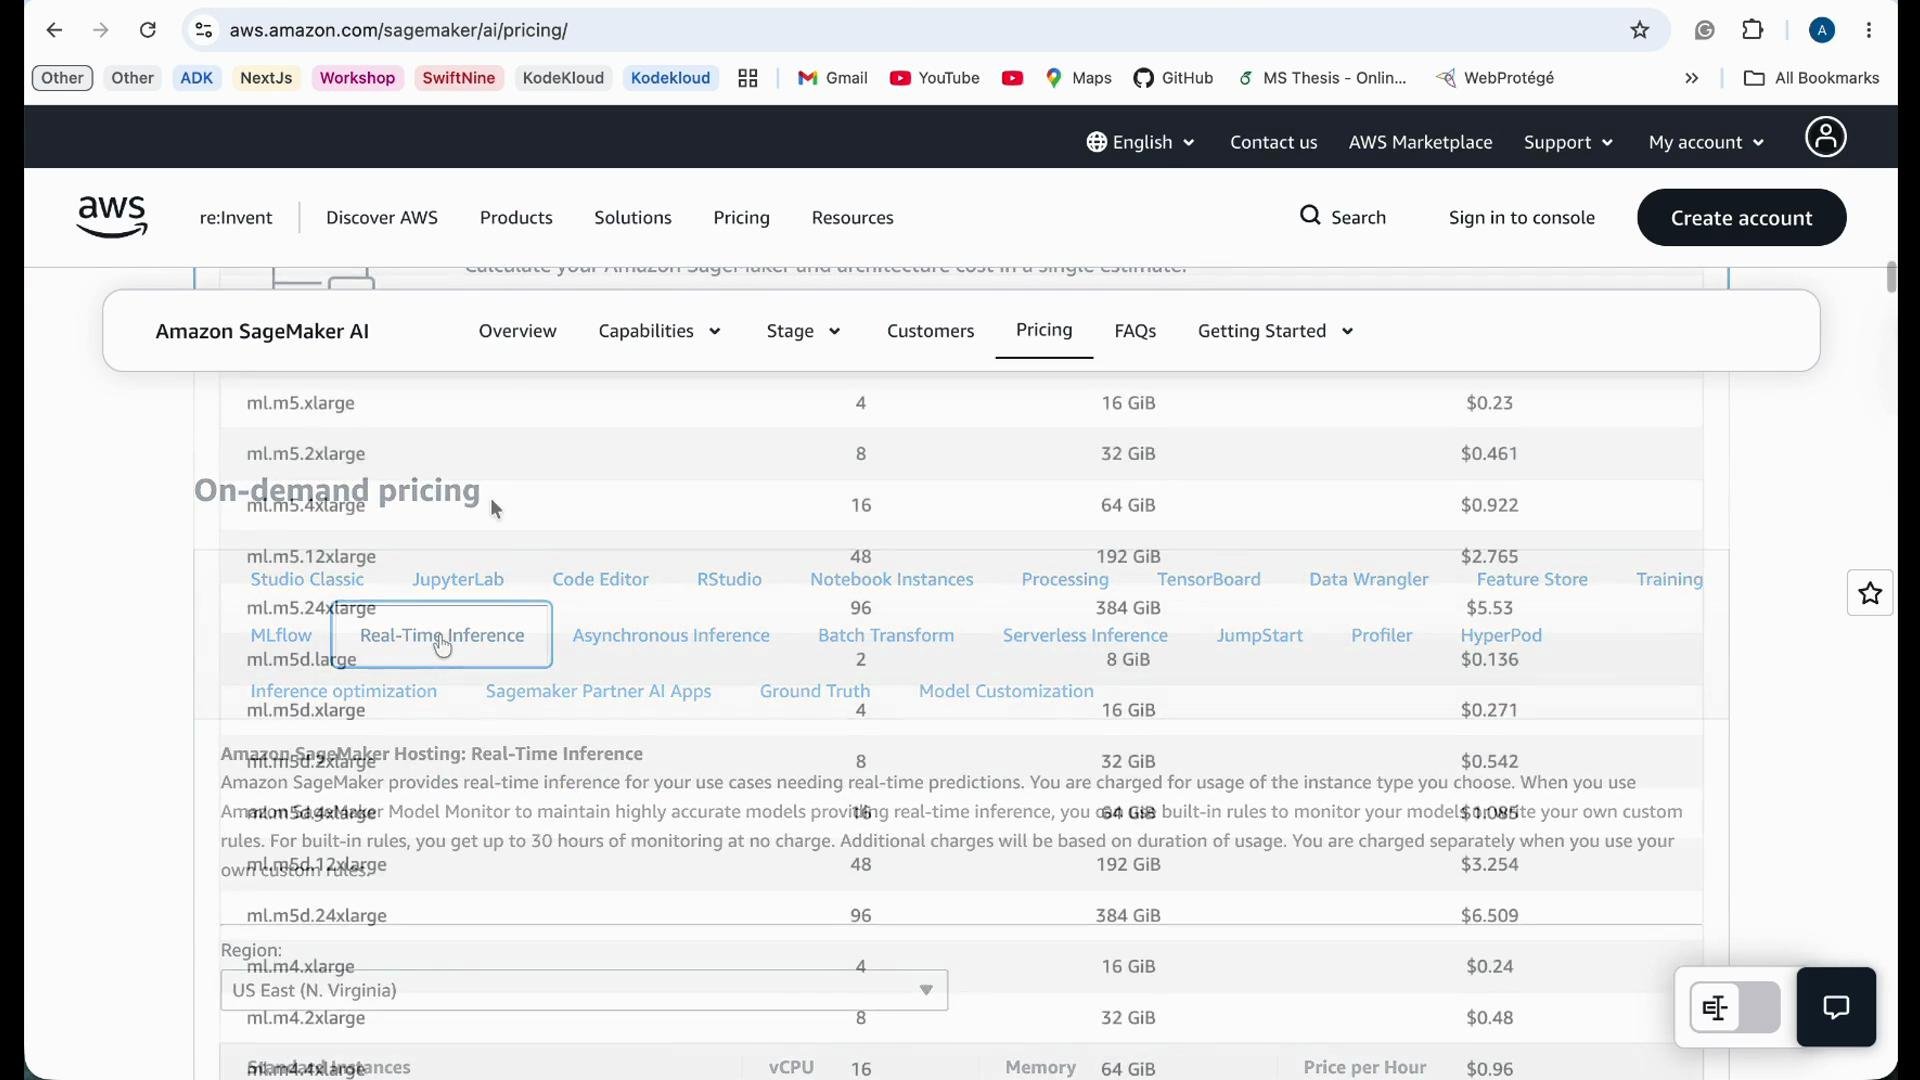
- Pick an instance class suitable for real-time inference and expected throughput. For CPU‑based, compute‑optimized instances such as
ml.c5.*are common. - In this demo we used
ml.c5.2xlarge(8 vCPUs, 16 GiB memory). Check cost estimates on the SageMaker pricing page: https://aws.amazon.com/sagemaker/pricing/.
- Wait for deployment and review the endpoint summary
- Deployment typically completes quickly. After deployment, review: inference type (real-time), logs, endpoint ARN, and the invocation URL for client requests.
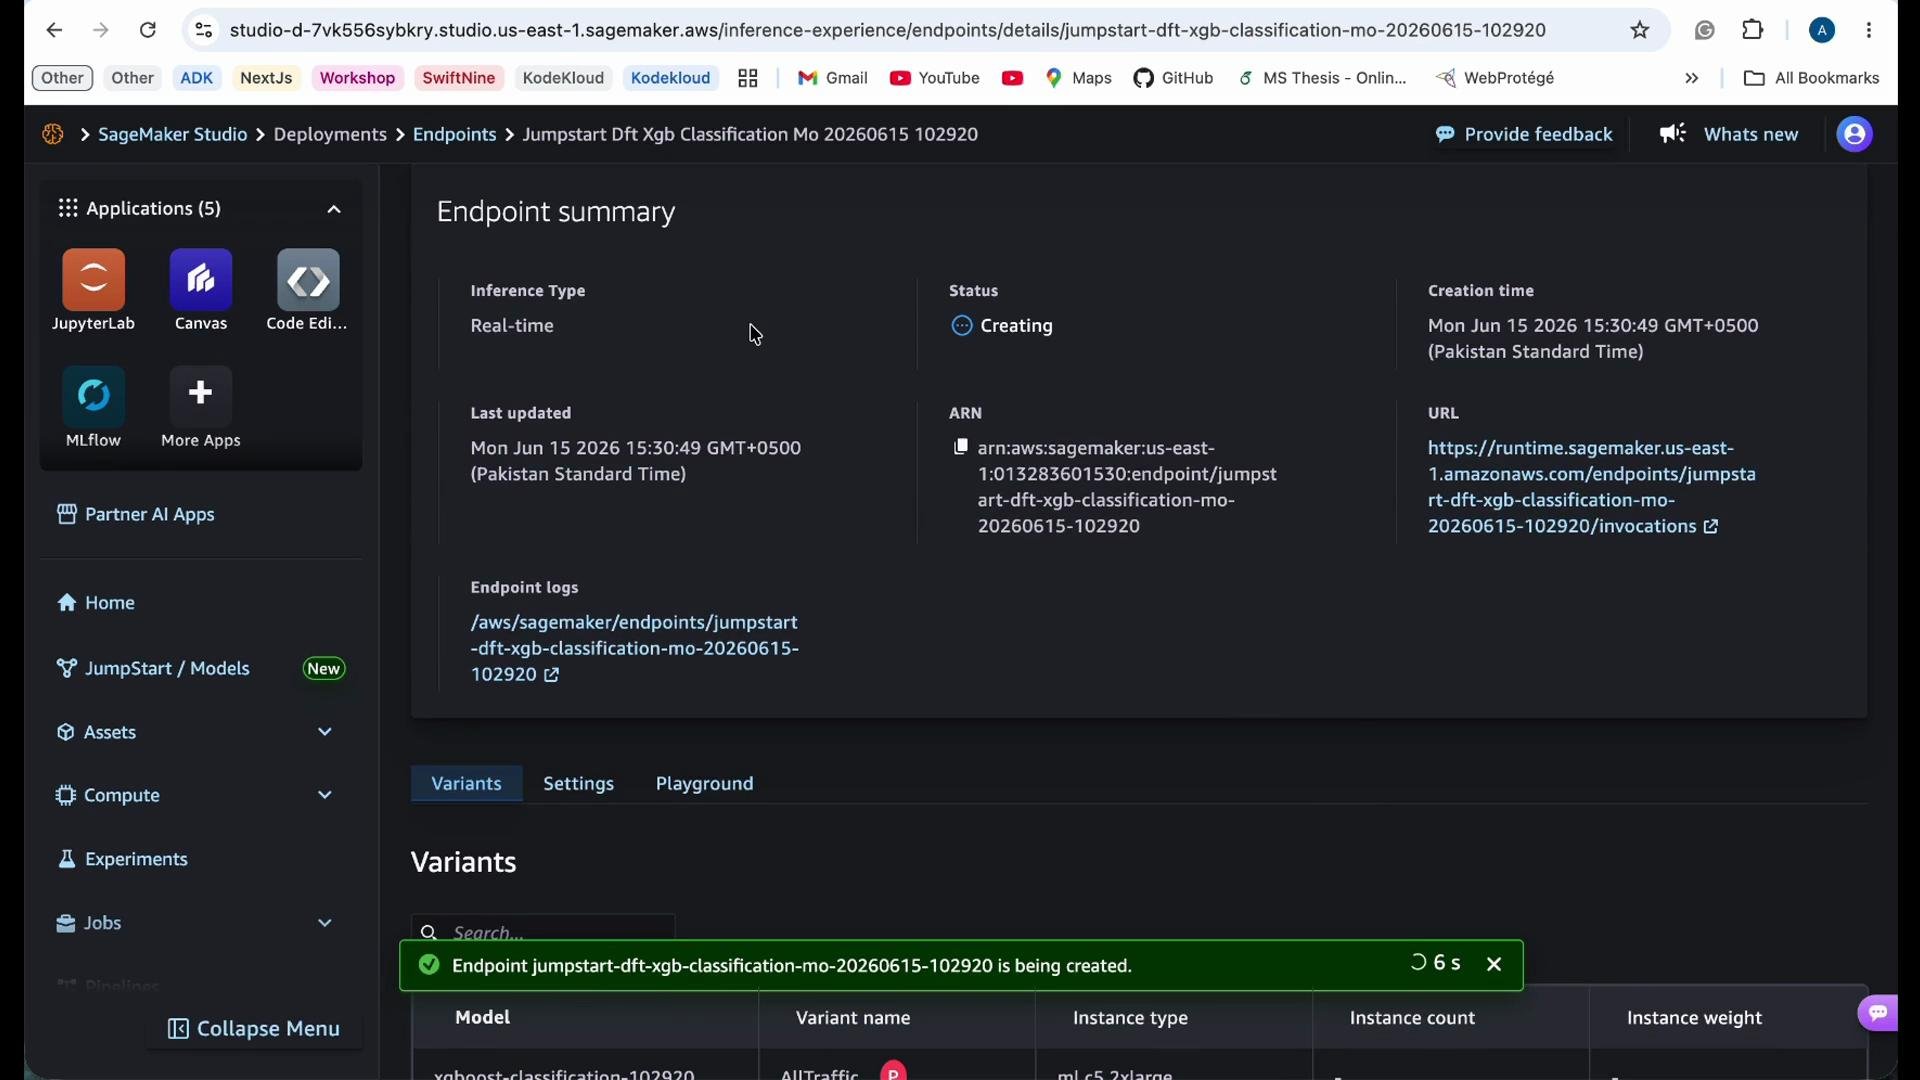
- Inference type: real-time inference.
- Endpoint logs can be routed to CloudWatch for tracing and debugging (see https://learn.kodekloud.com/user/courses/aws-cloudwatch).
- Endpoint ARN and invocation URL are available for direct testing.
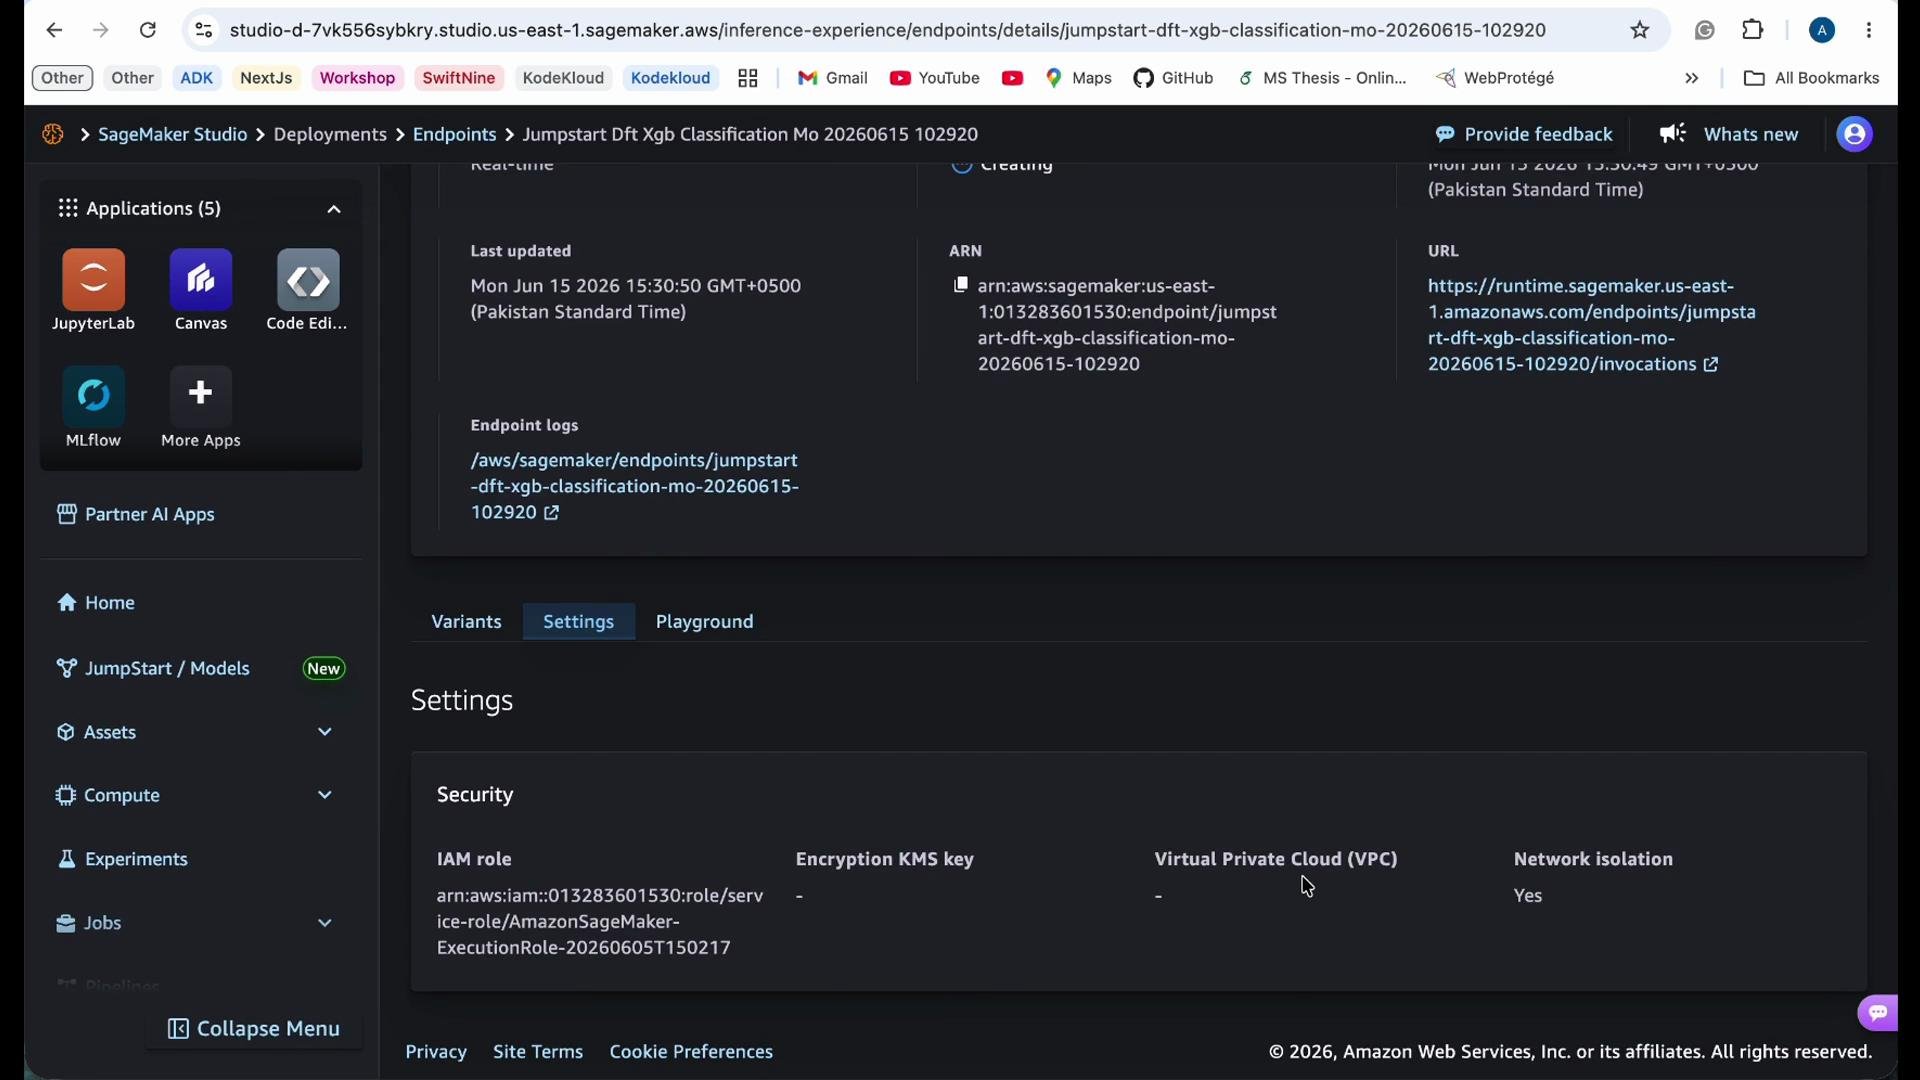
- Deployment variants and traffic routing
- You can create multiple variants (for example,
productionandcanary). Each variant can receive a percentage of traffic. - In this demo a single production variant receives 100% of traffic.
- Open Model Governance (Model Monitor)
- In SageMaker Studio, open the Model Governance / Model Monitor tab to see deployed endpoints and those in progress.
- Select your endpoint and click Create Monitor to configure Model Monitor for the selected endpoint. This will enable data capture (requests/responses) and create monitoring schedules.
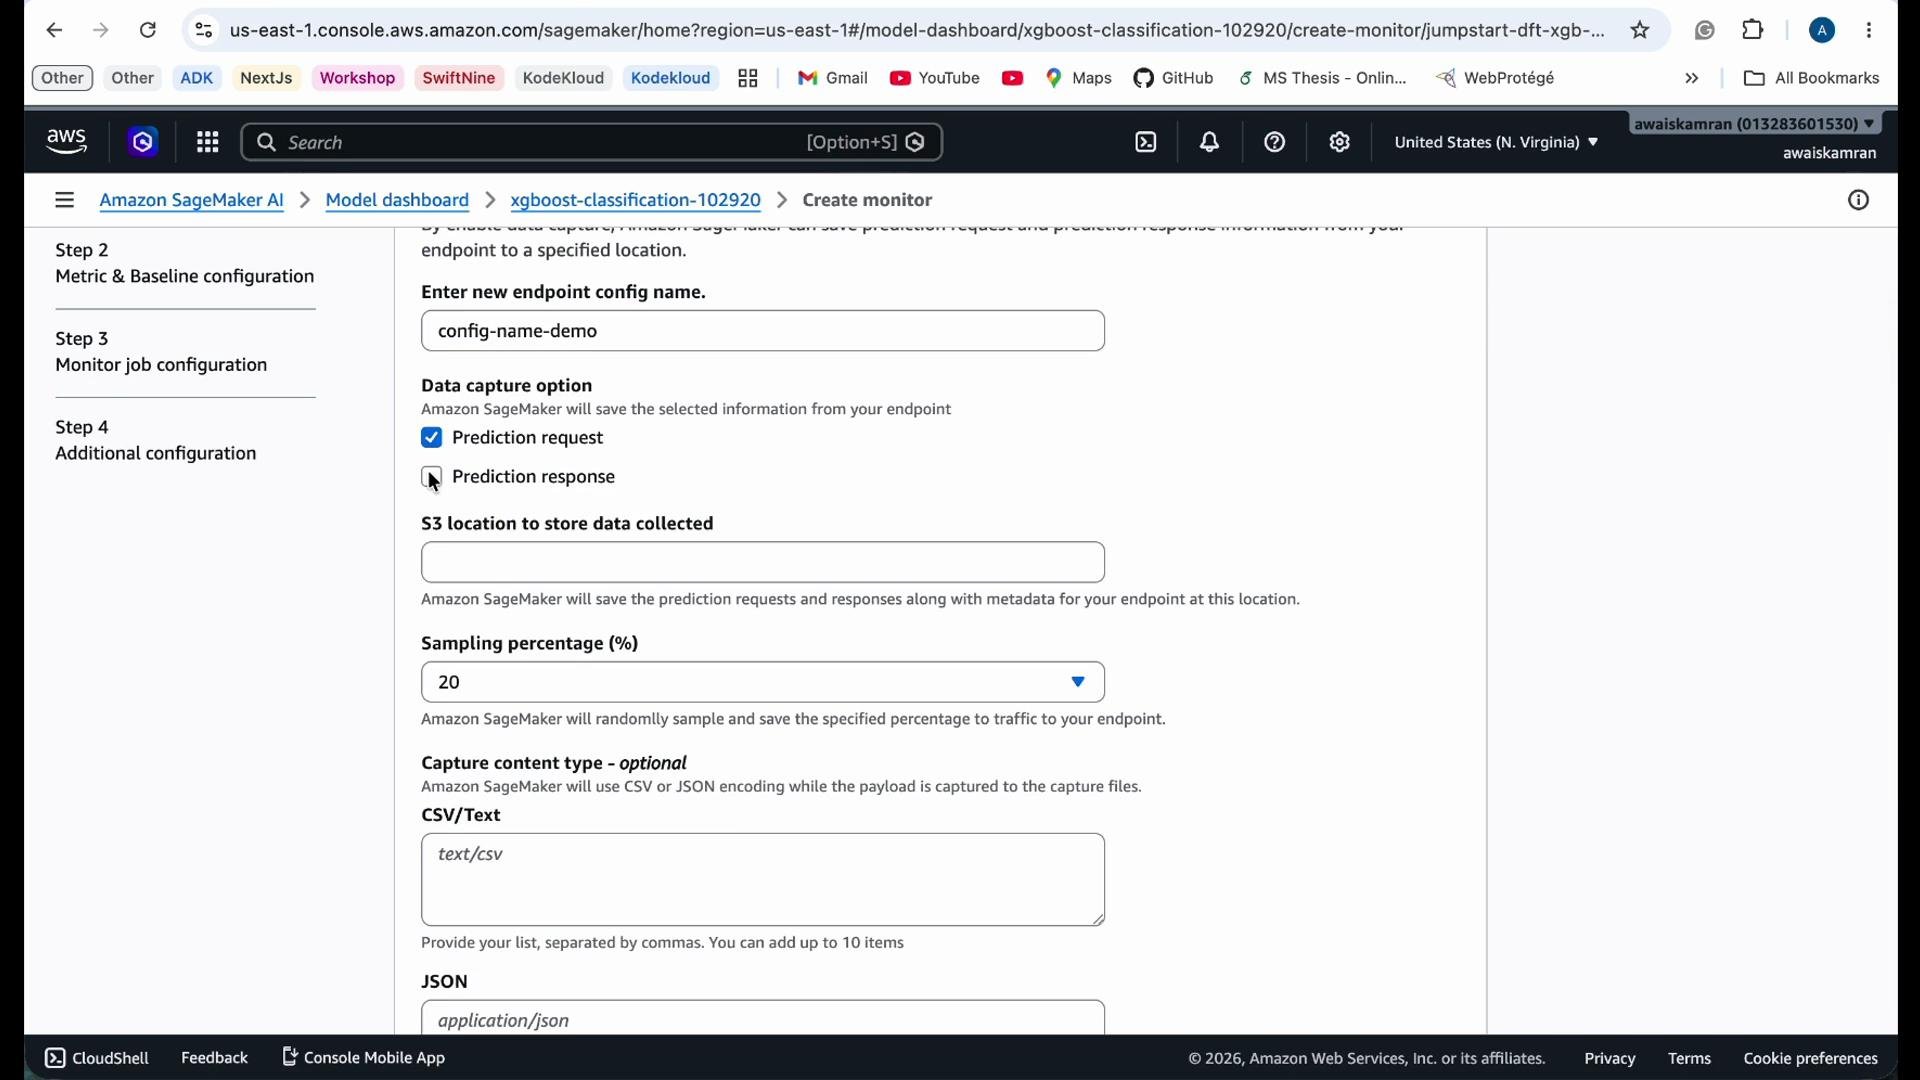
- Endpoint config name and data capture
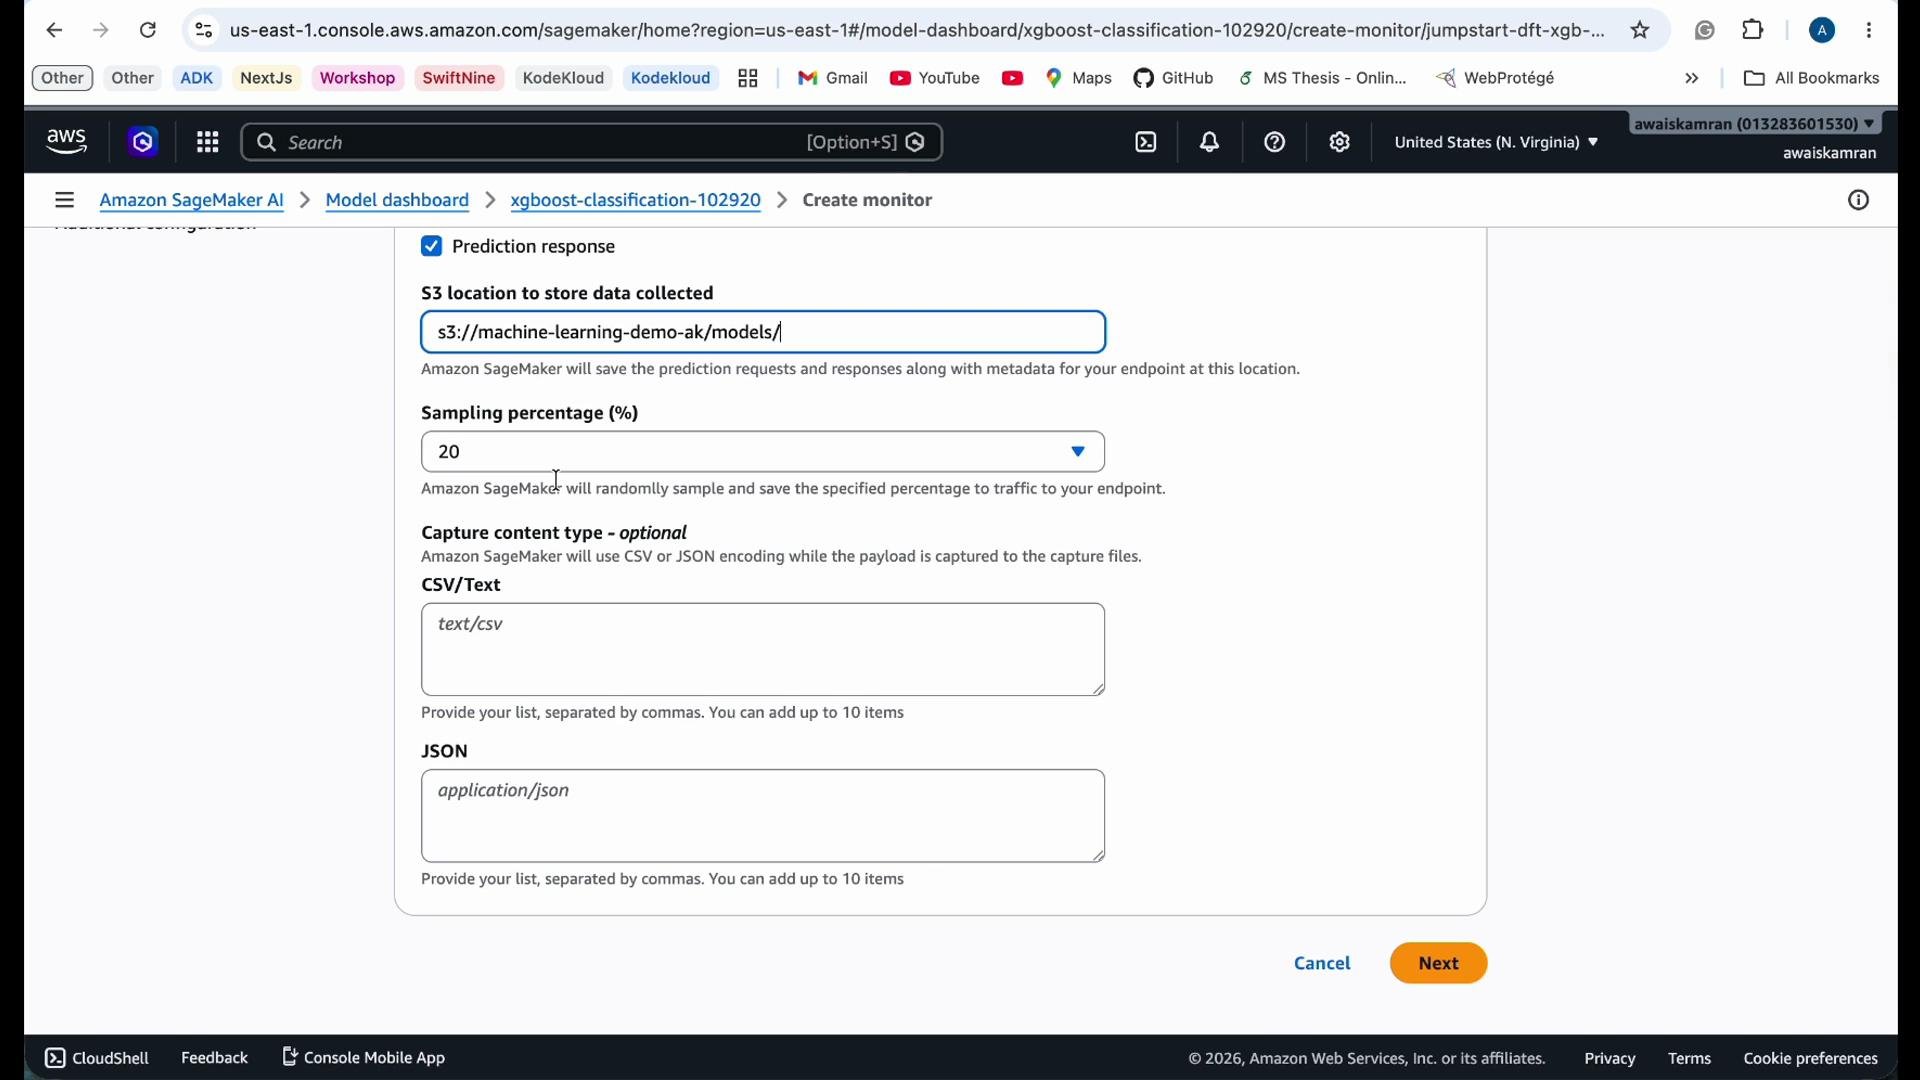
- Enable data capture for both requests and responses so captured records are persisted to S3.
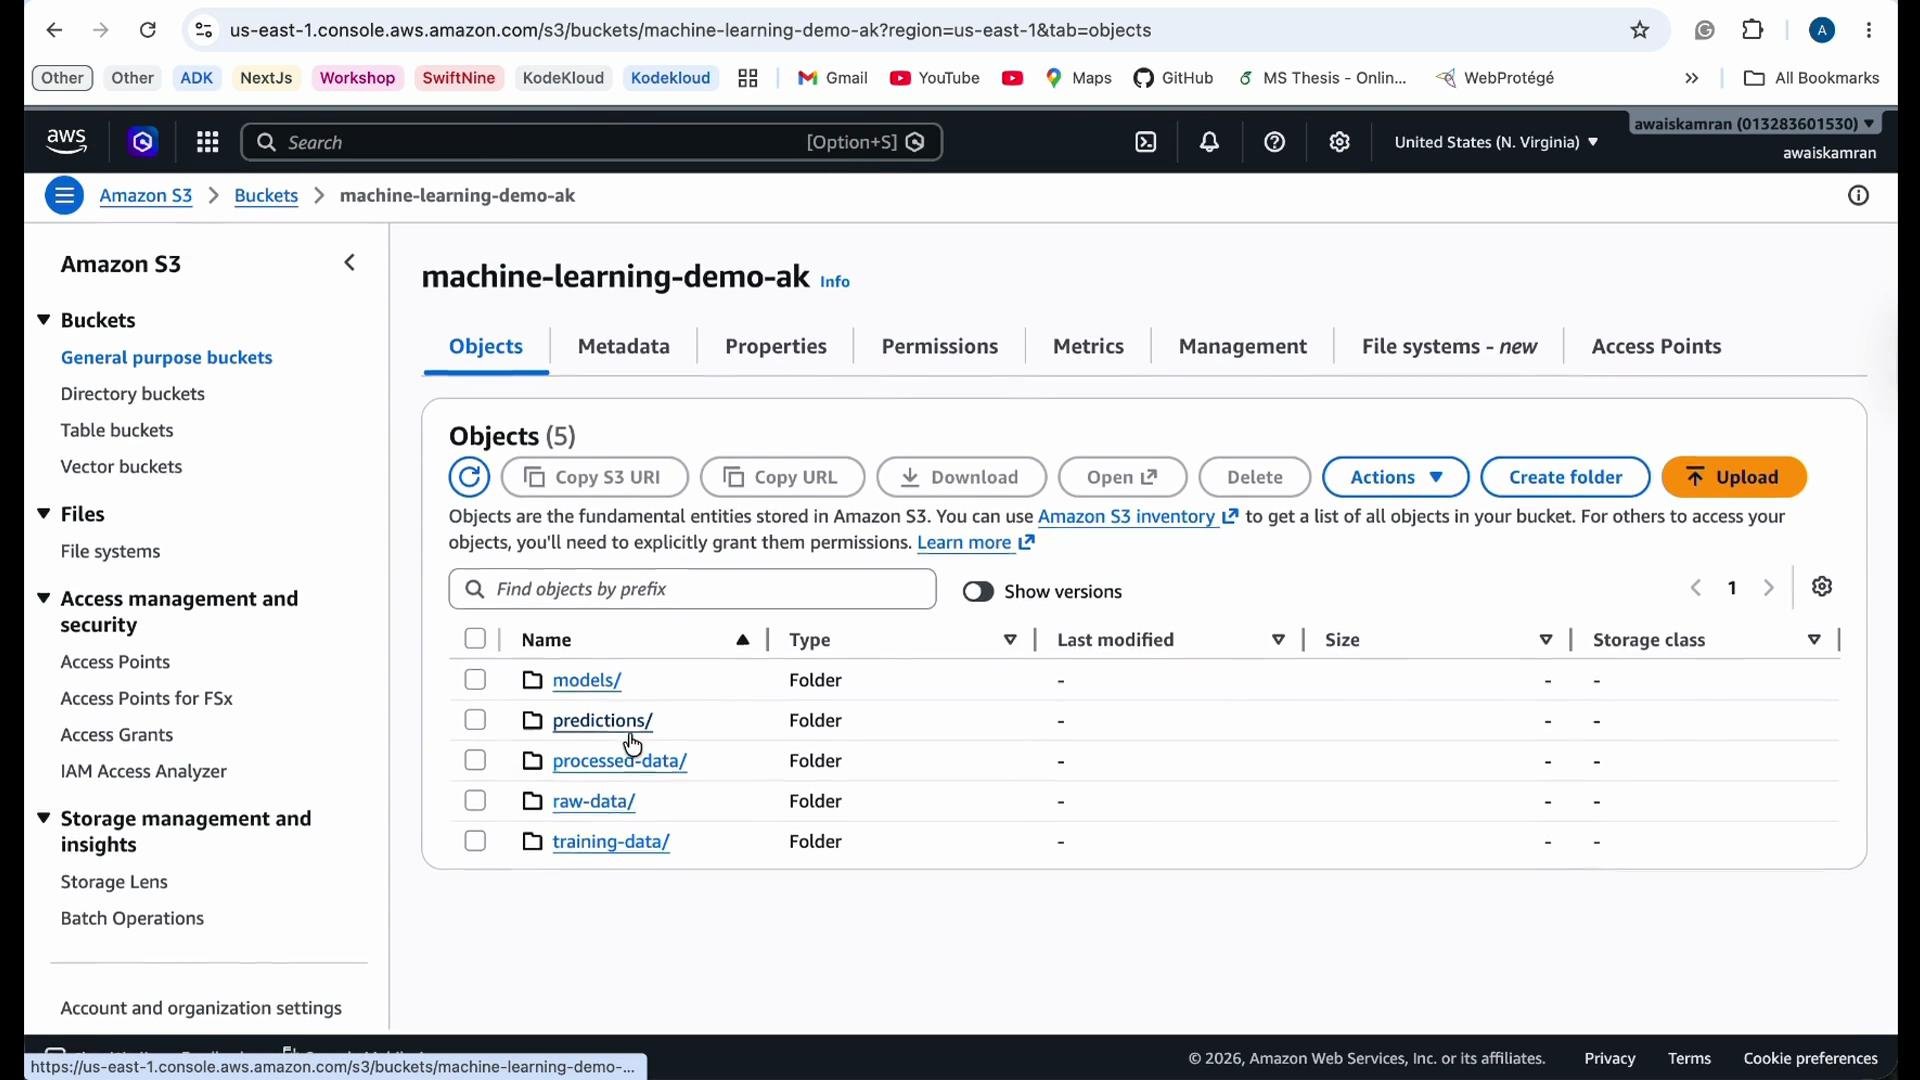
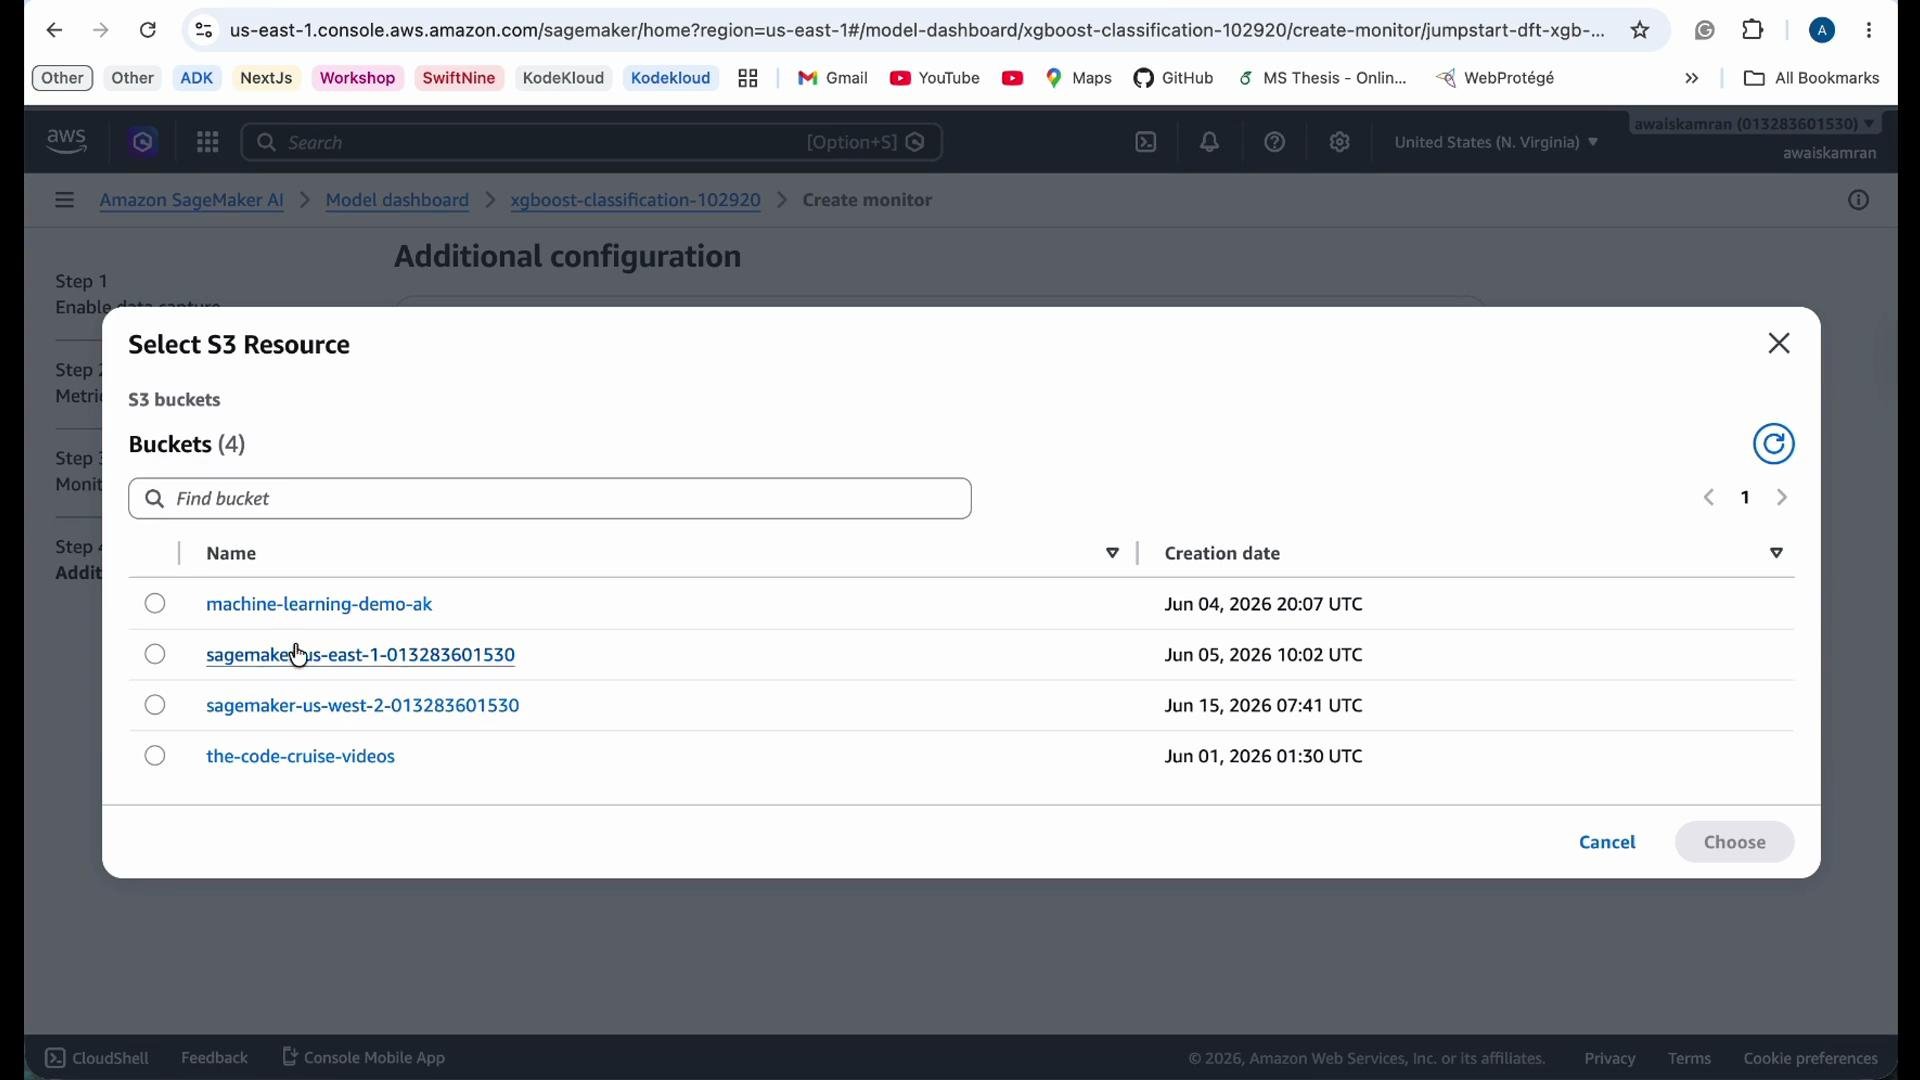
- Provide an S3 location (URI) for captured records. Use an existing bucket or create a new one in the S3 console.
models, predictions, raw-data).
- Configure the sampling percentage to control how much traffic is captured. Use sampling for A/B tests or multi-variant endpoints (e.g., 20% capture for canary). In this demo we capture 100% because a single variant serves all traffic.
- Monitoring types and baseline dataset
- Select the monitoring types appropriate for your use case:
- In this demo we enable Data Quality to detect drift between captured data and your baseline.
- Provide a baseline dataset (usually the training data) to compute baselines and constraints. Example baseline file:
- Provide an S3 output location where baselines and reports will be written (e.g.,
s3://your-bucket-name/predictions/).
ml.c4.xlarge for the monitoring analysis job.
- Schedule and job configuration
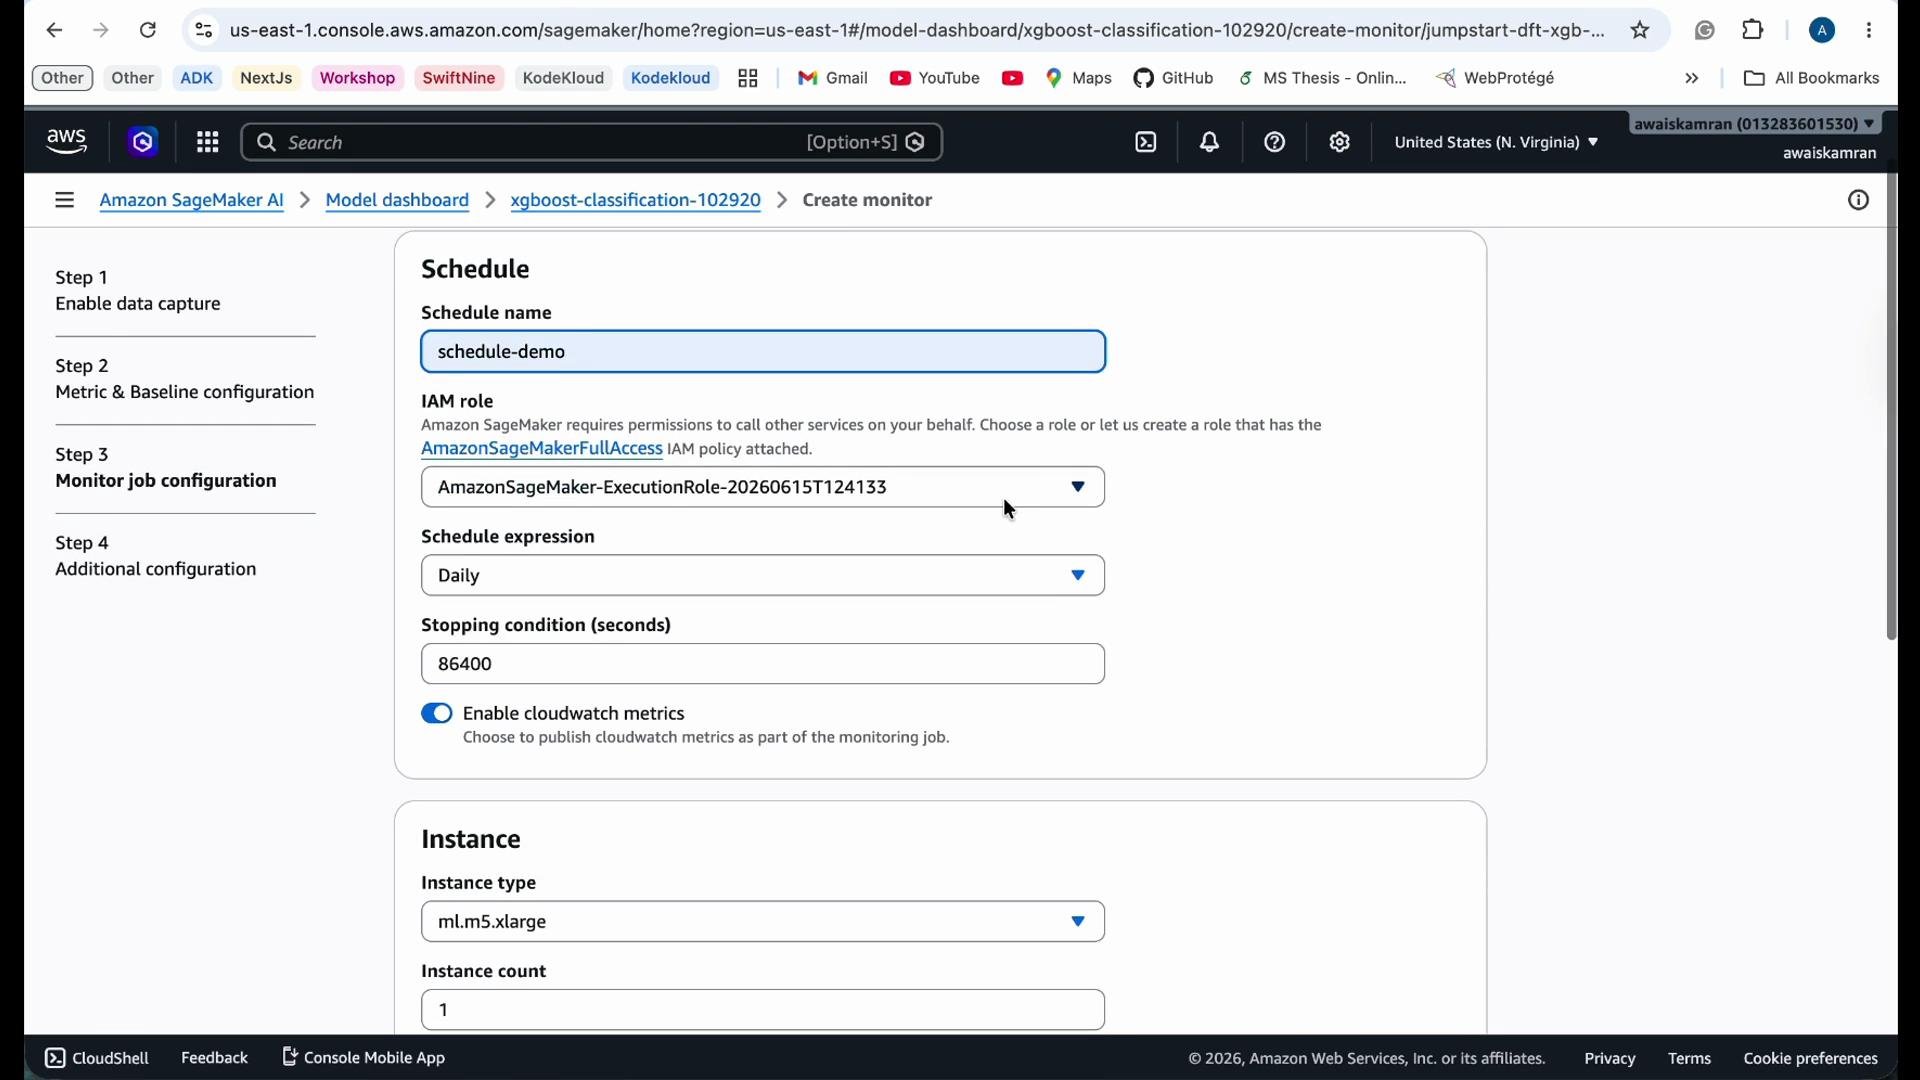
- Choose how often the monitoring job runs (e.g., hourly, daily). Scheduling is important to aggregate sufficient data (for example, daily after business hours).
- Configure:
- Schedule expression (cron or rate). Example daily cron:
- Stopping condition (max runtime).
- Monitoring job instance type and IAM role (the role must have S3 write access).
- When specifying input/output locations for the job, select the S3 folders for captured input and monitoring outputs.
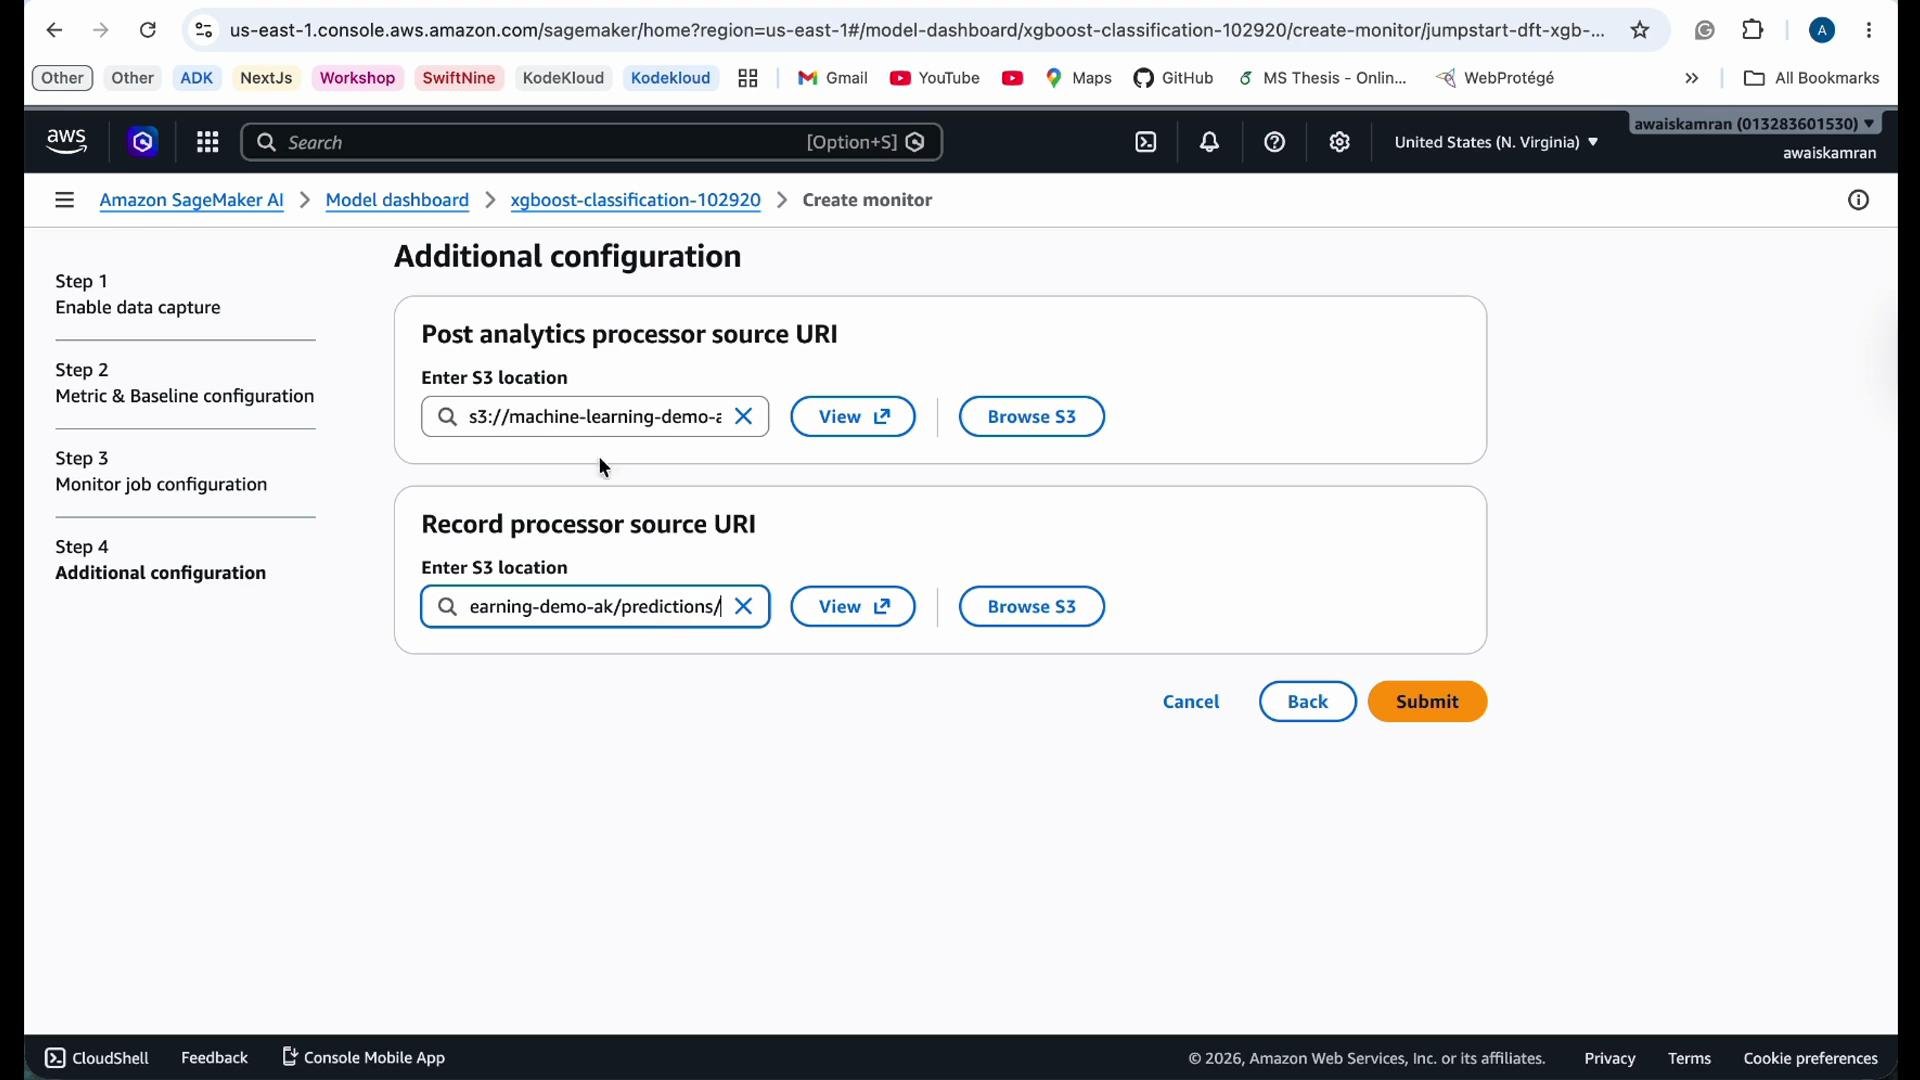
- You may provide a post-analytics processor or record processor URI to run custom code on captured records or analytics outputs.
- In this demo we reused the
predictionsfolder to store analytics artifacts.
- Step 1: Enable data capture for the endpoint (requests and responses to S3).
- Step 2: Select monitoring types and provide a baseline dataset to compute baselines/constraints.
- Step 3: Configure the monitoring job schedule, instance type, input/output S3 locations, and optional post-processing.
- Raw monitoring artifacts: check the S3 output path you configured.
- Interactive view: open the Model Dashboard in SageMaker Studio to see consolidated visualizations including risk rating, model quality, data quality (drift), bias metrics, and feature attribution drift — an operational view of model health.
Ensure the IAM role used by SageMaker has permissions to read/write the S3 locations you choose (see https://learn.kodekloud.com/user/courses/aws-iam). If you use KMS‑encrypted buckets, confirm the KMS key policy grants SageMaker permission to use the key (https://aws.amazon.com/kms/).
If you plan to enable Model Quality (prediction performance), you must provide ground-truth labels. Plan how labeled feedback will be collected and where it will be stored so the monitoring job can access it.