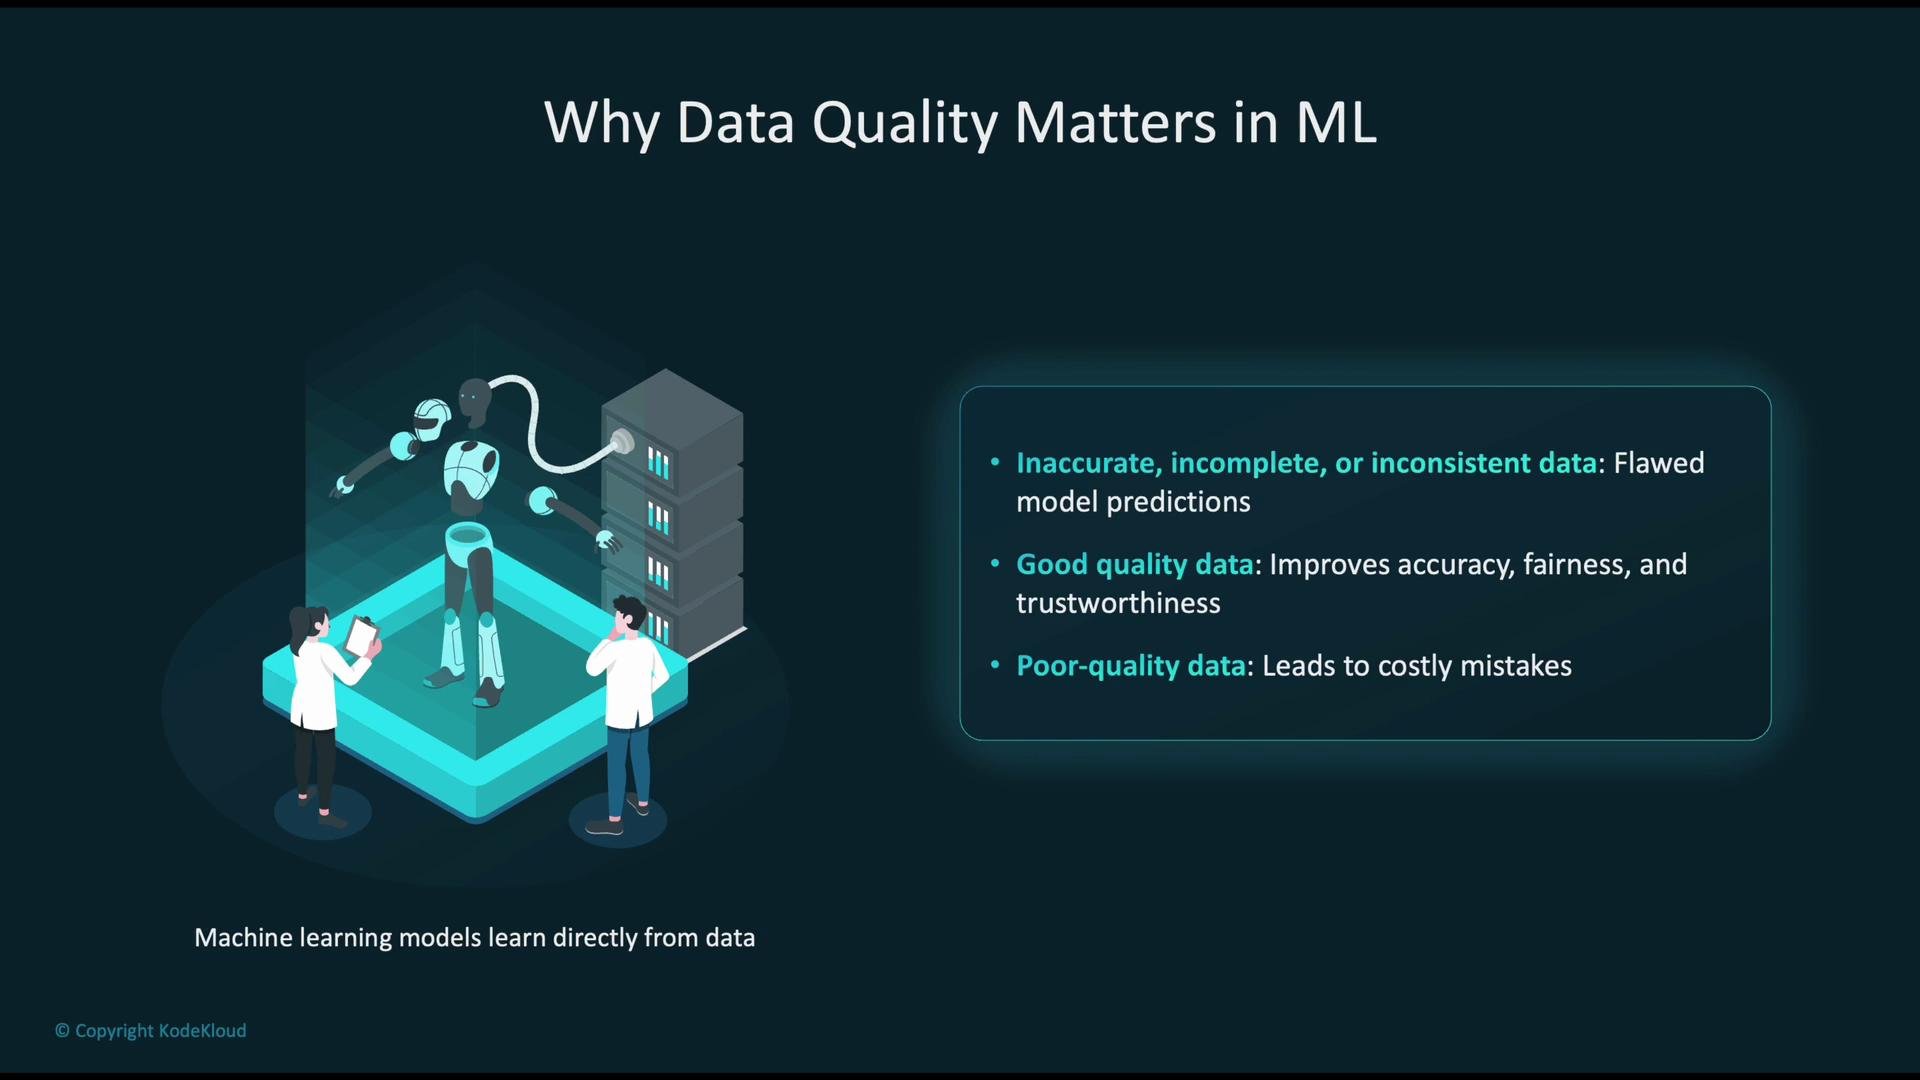
Data quality and validation are foundational to reliable machine learning (ML). No matter how advanced the model architecture, poor input data will produce unreliable or biased predictions. Validation detects issues early in the pipeline so models train on accurate, consistent, and relevant data—reducing risk and improving model performance, fairness, and trustworthiness.
The image is an illustration emphasizing the importance of data quality in machine learning, showing two people interacting with a robot and lists the impacts of inaccurate, good, and poor-quality data on model predictions.
Why this matters
  • Models learn patterns from training data. If that data is inaccurate, incomplete, or inconsistent, models will learn wrong or biased patterns.
  • High-quality data leads to better accuracy, fairness, and reliability in production.
  • Validation reduces costly mistakes by preventing bad data from reaching training or inference stages.

Key dimensions of data quality

Use these dimensions as a checklist when assessing any ML dataset:
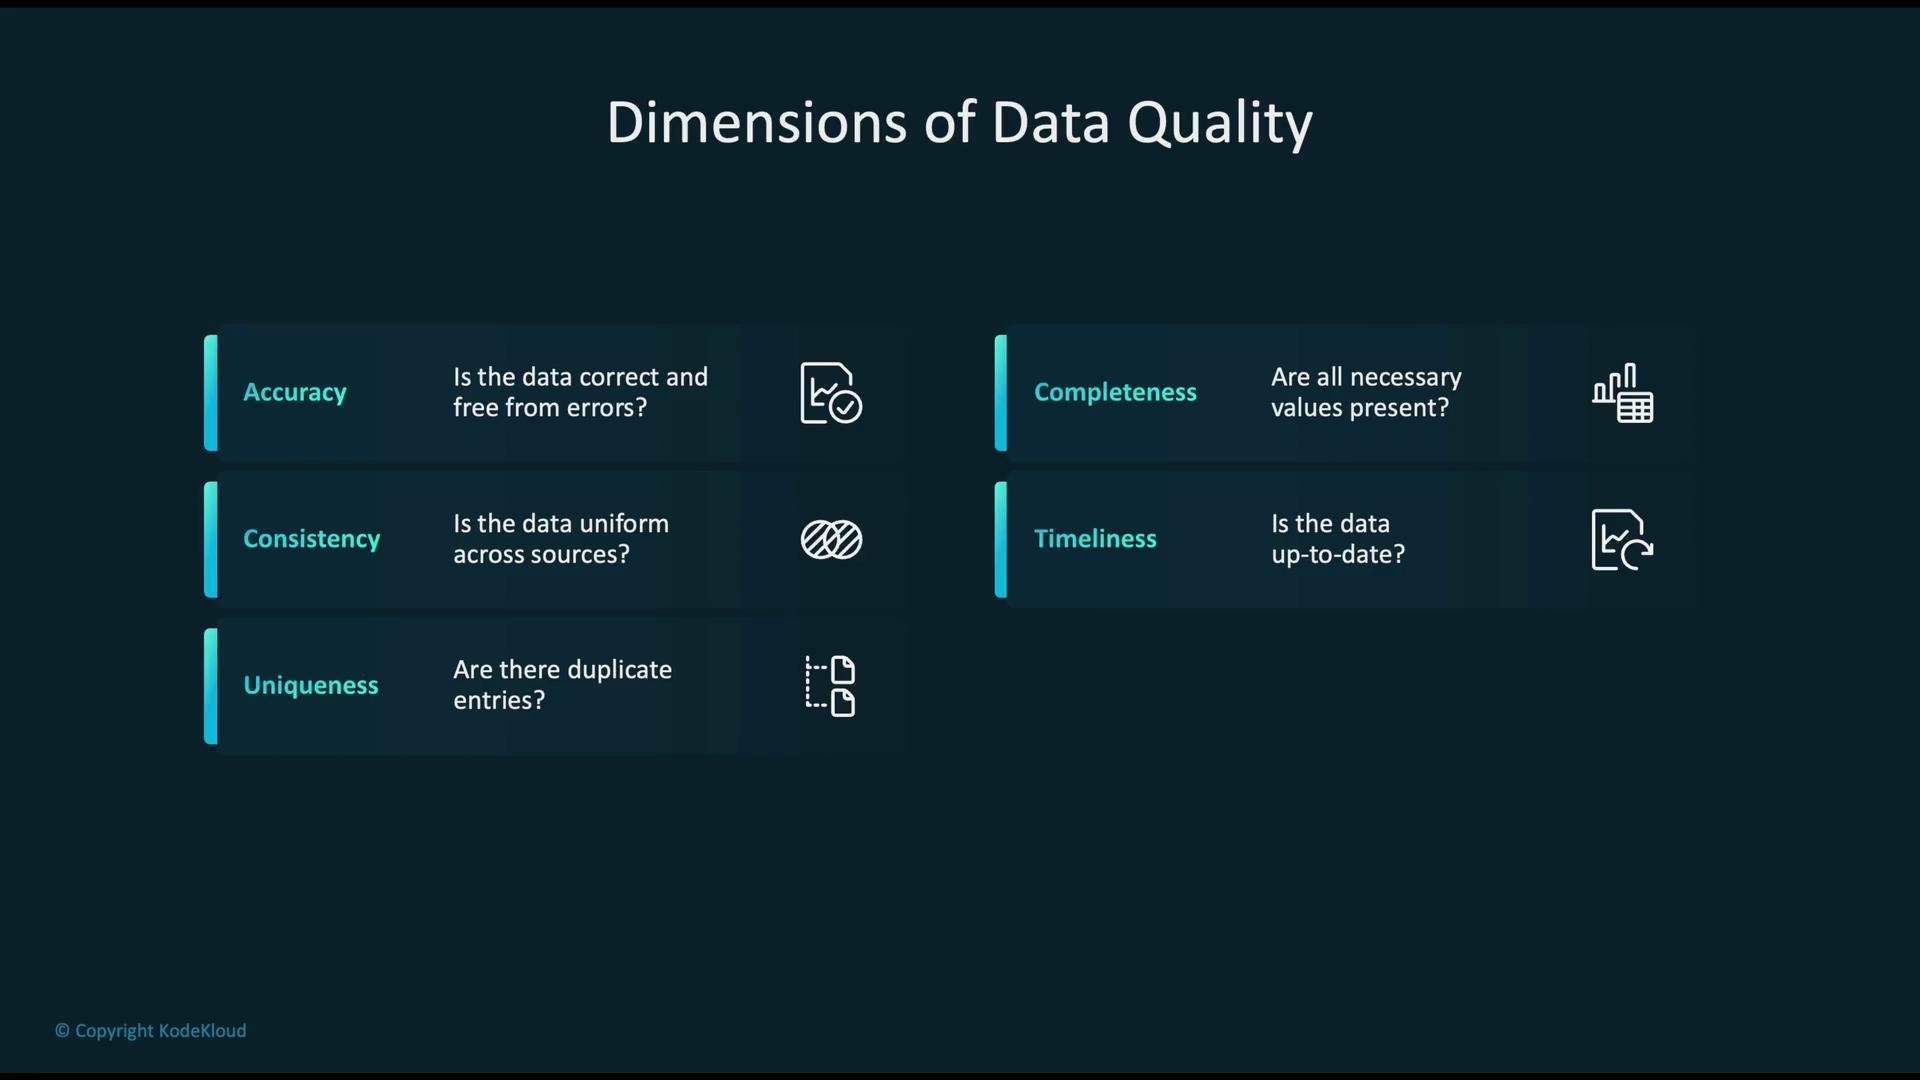
The image outlines the dimensions of data quality, including accuracy, consistency, uniqueness, completeness, and timeliness, with accompanying questions and icons for each.
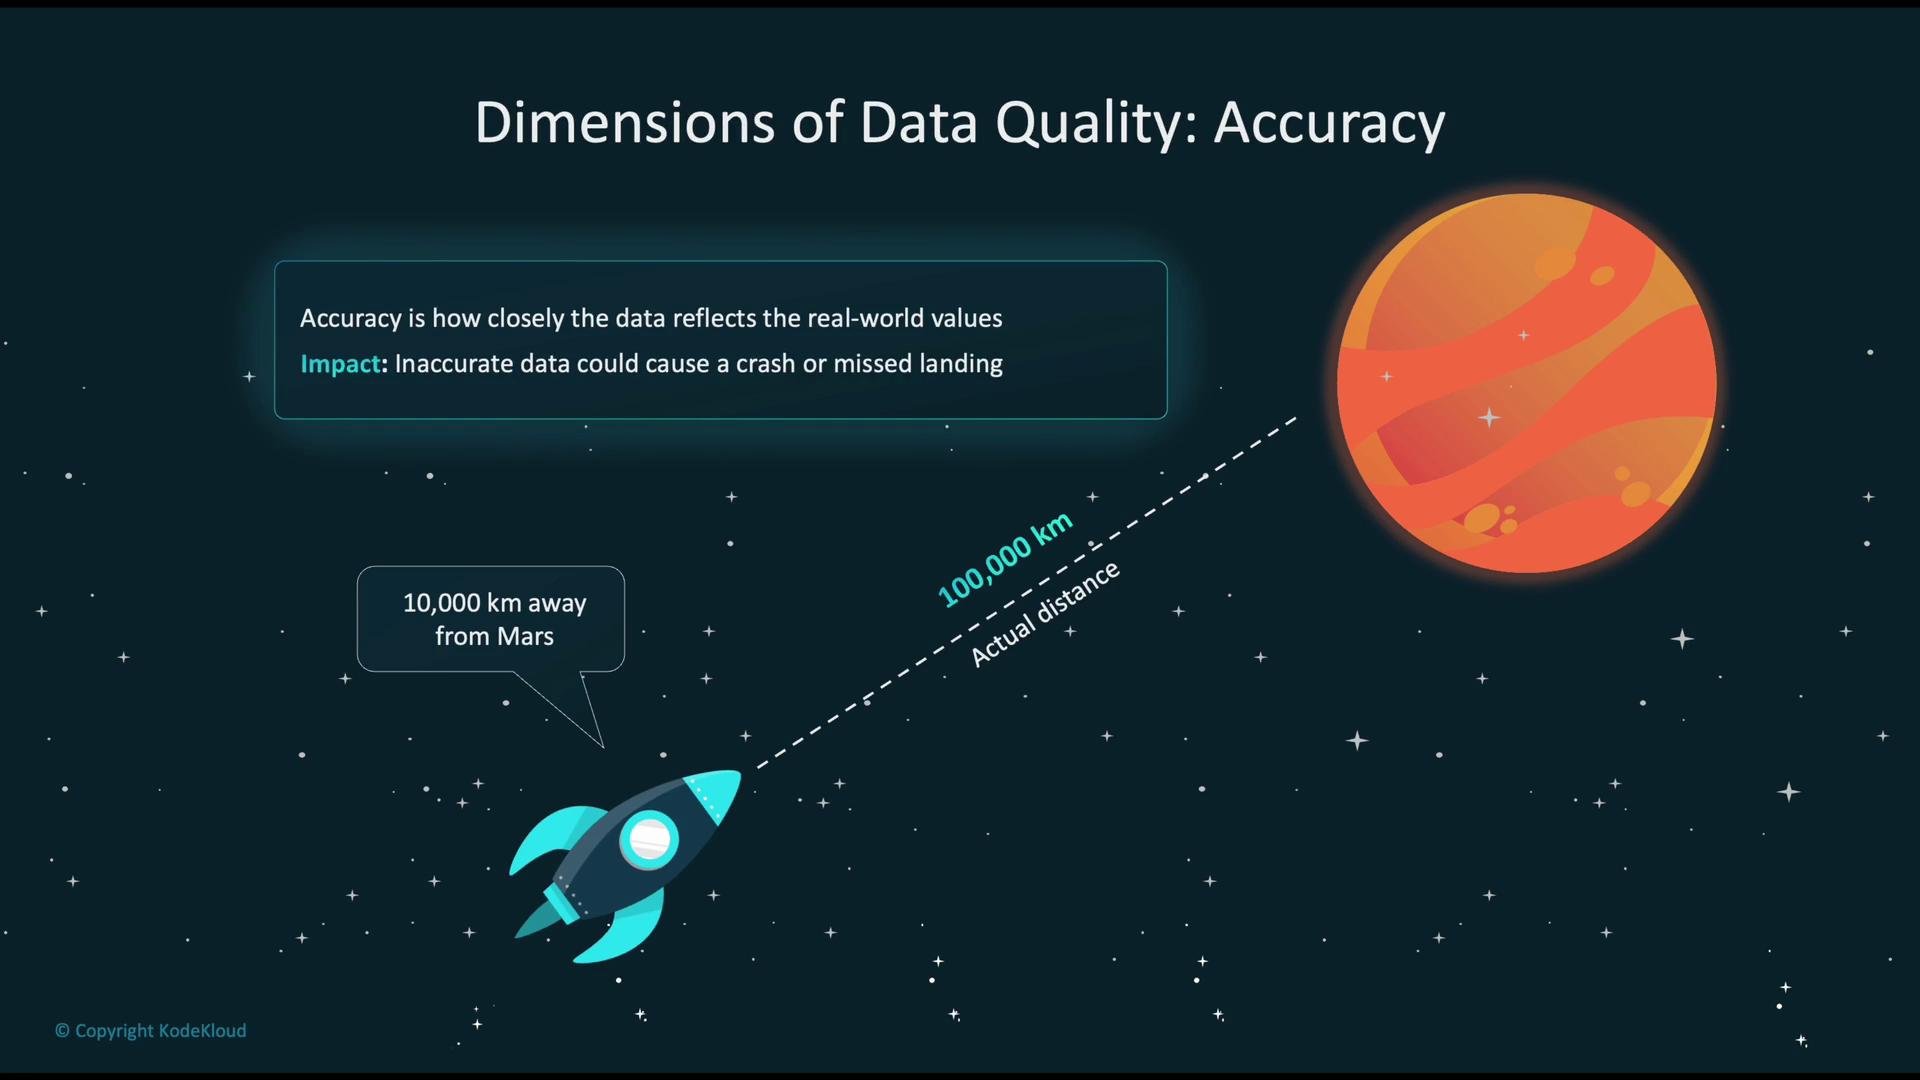
Concrete analogies help: imagine a spacecraft navigation system reporting 10,000 km to Mars when the true distance is 100,000 km. Decisions based on that inaccurate reading could result in mission failure—this illustrates how critical accuracy is for real-world outcomes.
The image illustrates the concept of data quality accuracy, showing a cartoon rocket incorrectly measuring its distance to Mars, emphasizing the impact of inaccurate data on real-world outcomes.
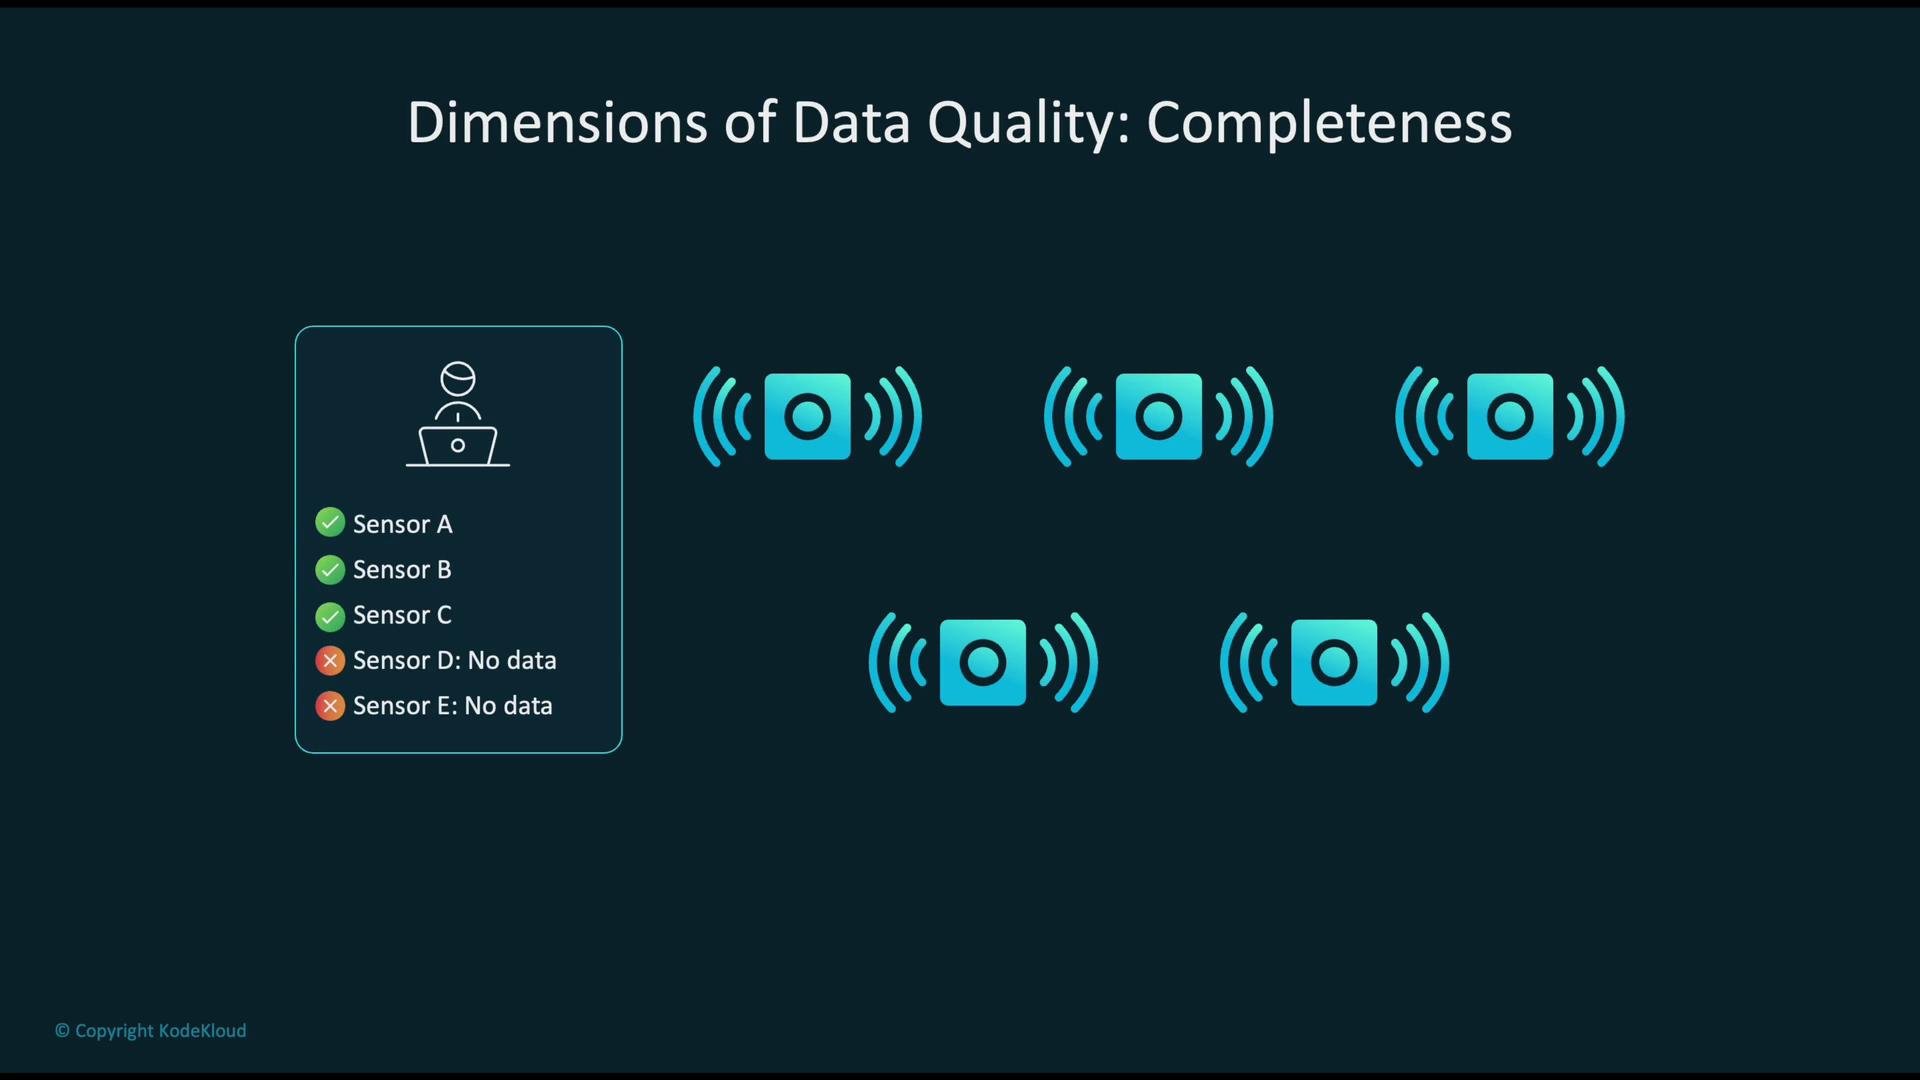
Completeness covers missing values: if a dataset should include readings from five sensors but only three report values, analyses and models will be skewed by those gaps.
The image illustrates the concept of data quality in terms of completeness, showing five sensors, with three providing data and two not providing data, represented by check and cross symbols.
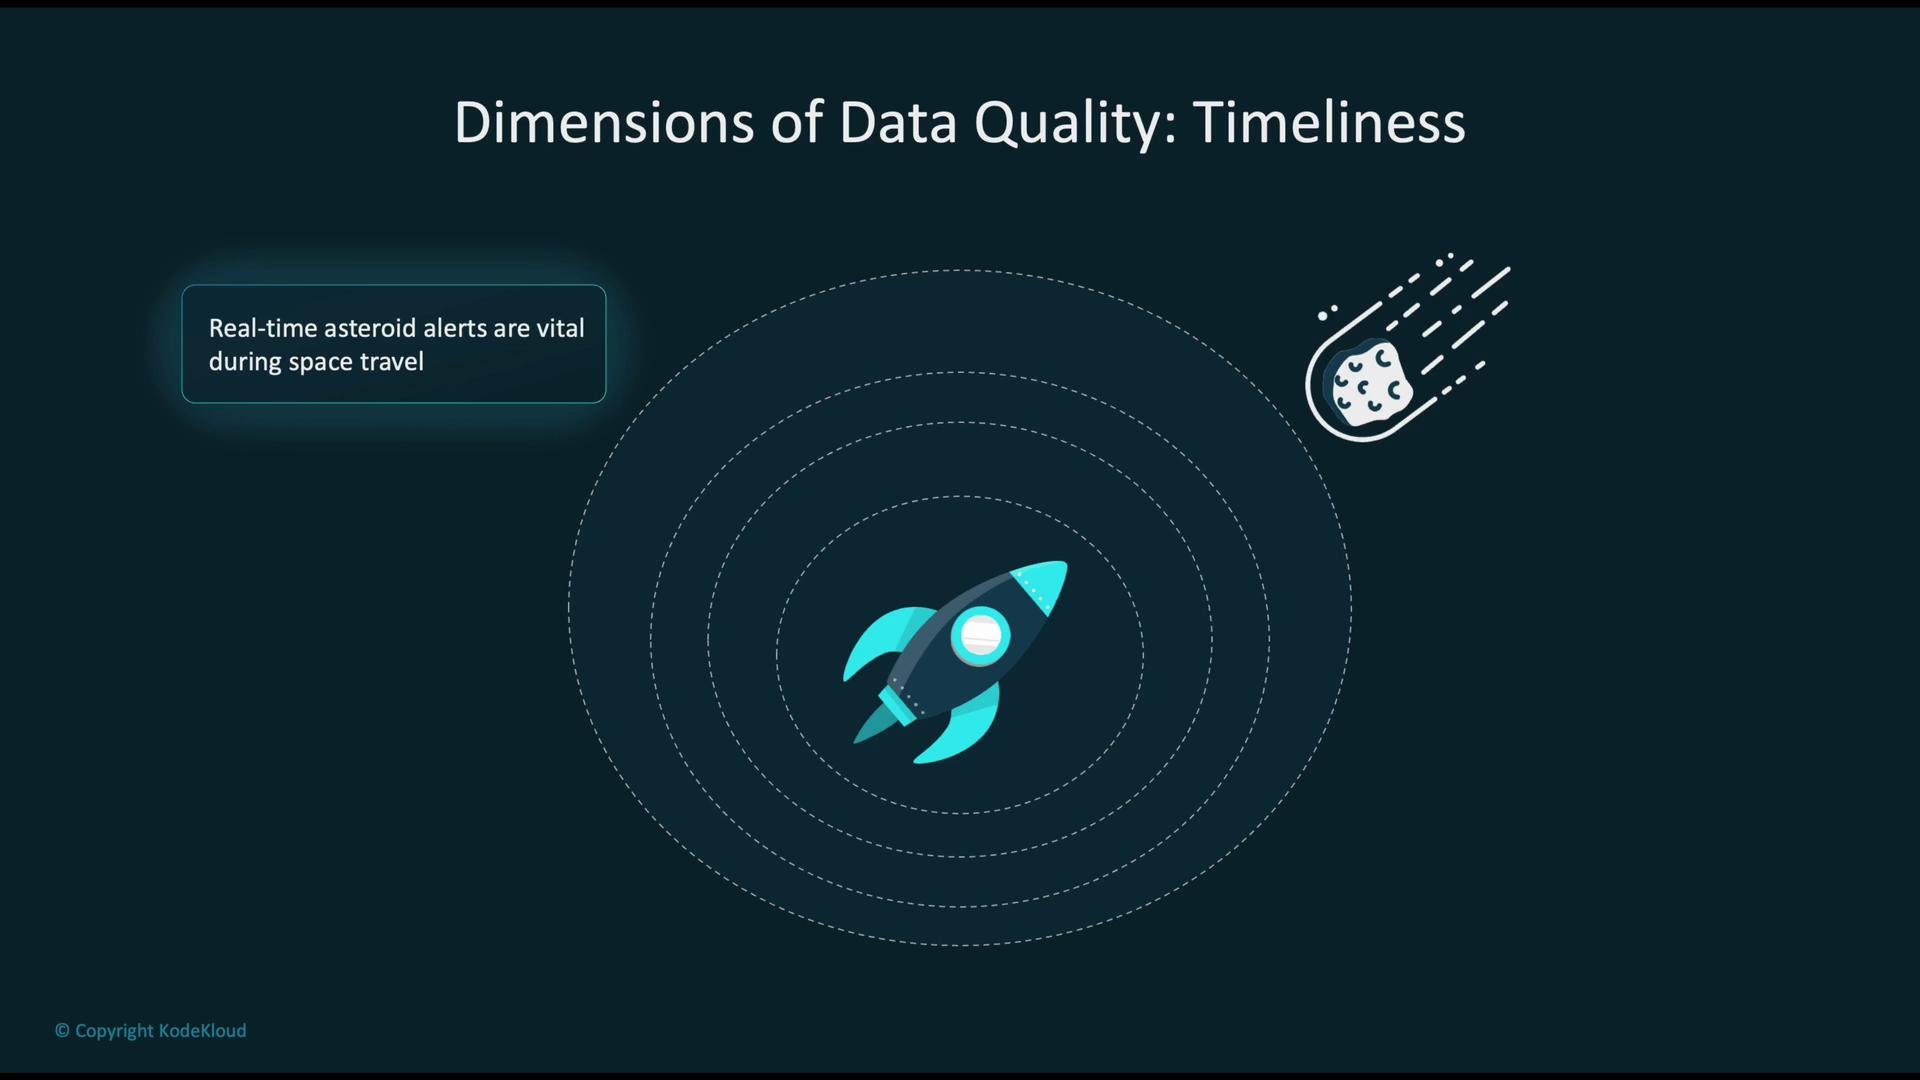
Timeliness ensures the data reflects current conditions. In space missions, delayed asteroid alerts could be catastrophic; similarly, outdated training data can cause models to miss evolving trends and perform poorly.
The image depicts a concept of "Dimensions of Data Quality: Timeliness" with a rocket, an asteroid, and a note emphasizing the importance of real-time asteroid alerts during space travel.
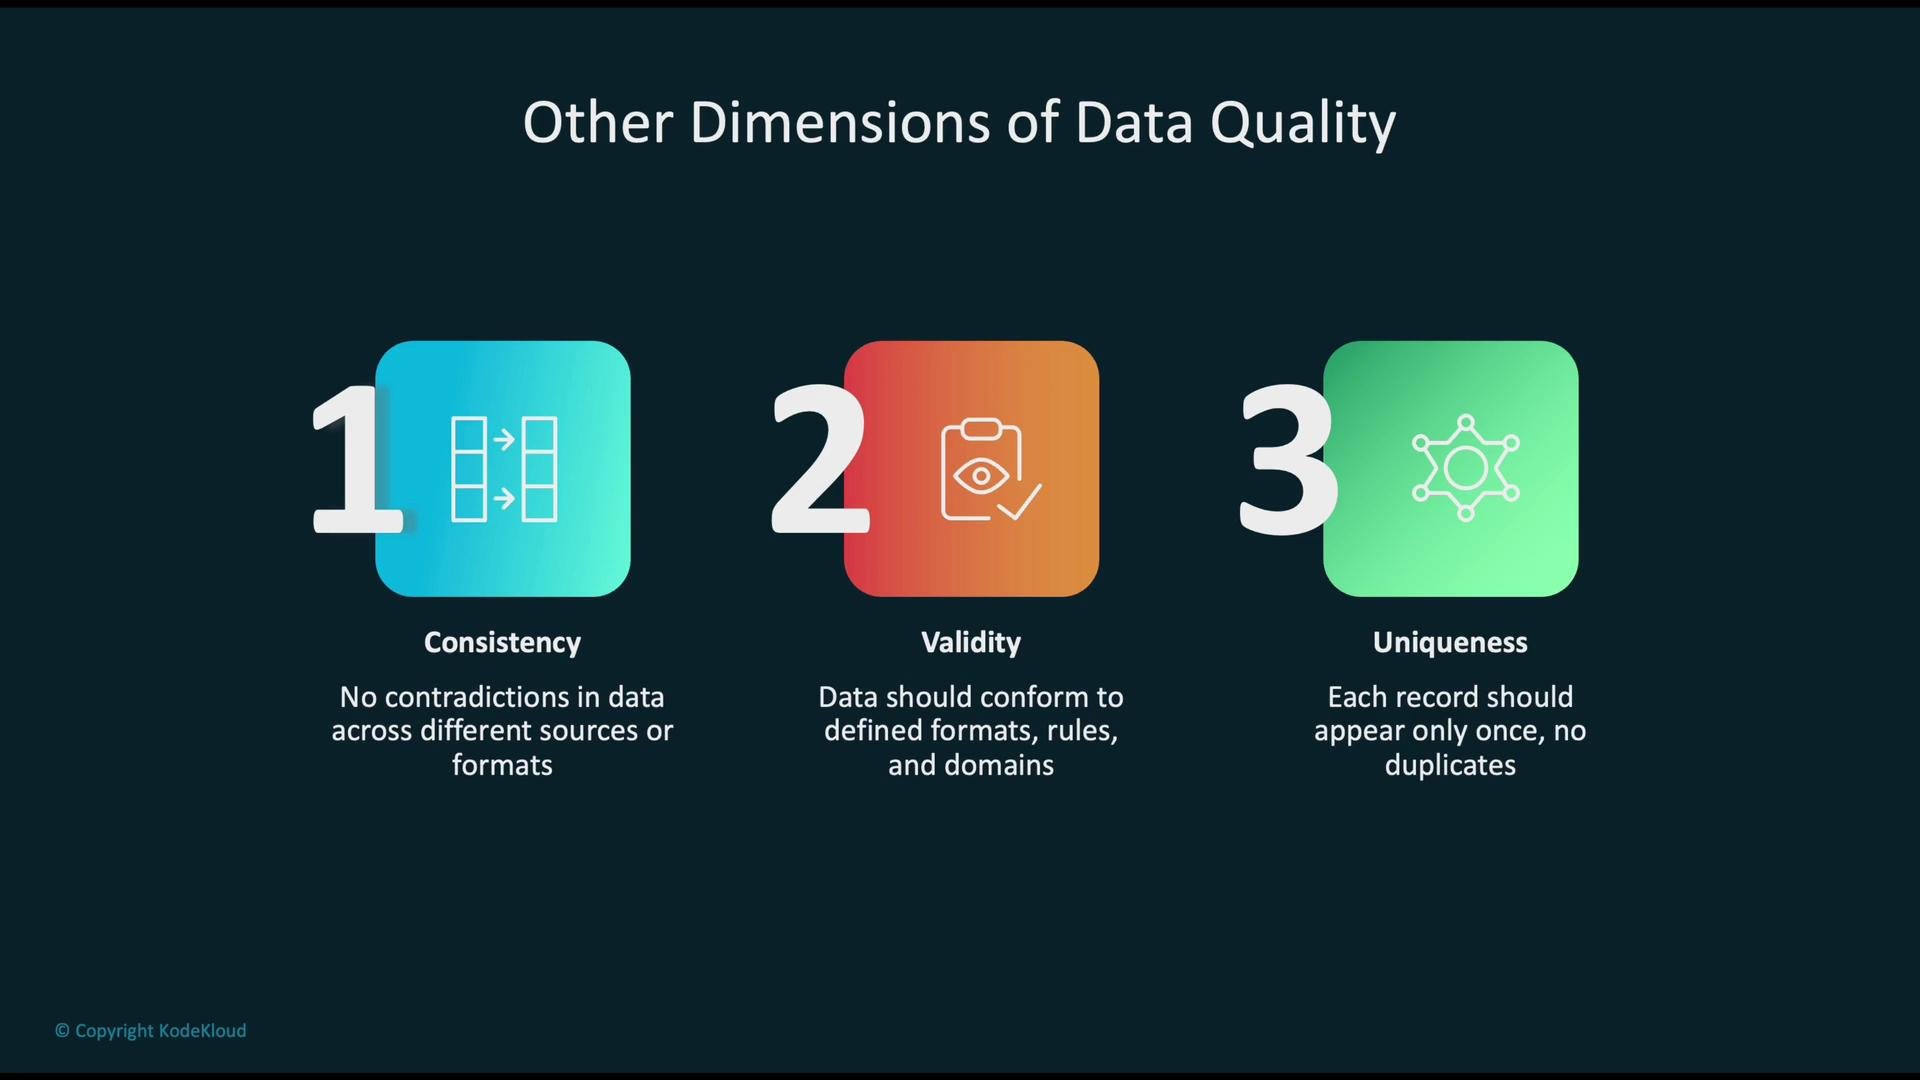
Other important dimensions include consistency, validity (data conforms to rules and allowed domains), and uniqueness. Together they help produce clean, standardized datasets ready for ML.
The image illustrates three dimensions of data quality: consistency, validity, and uniqueness, each with a brief explanation and an icon.
Common raw-data issues
  • Noise and random measurement errors
  • Duplicates or repeated records
  • Missing or incomplete fields
  • Inconsistent formats and units across sources
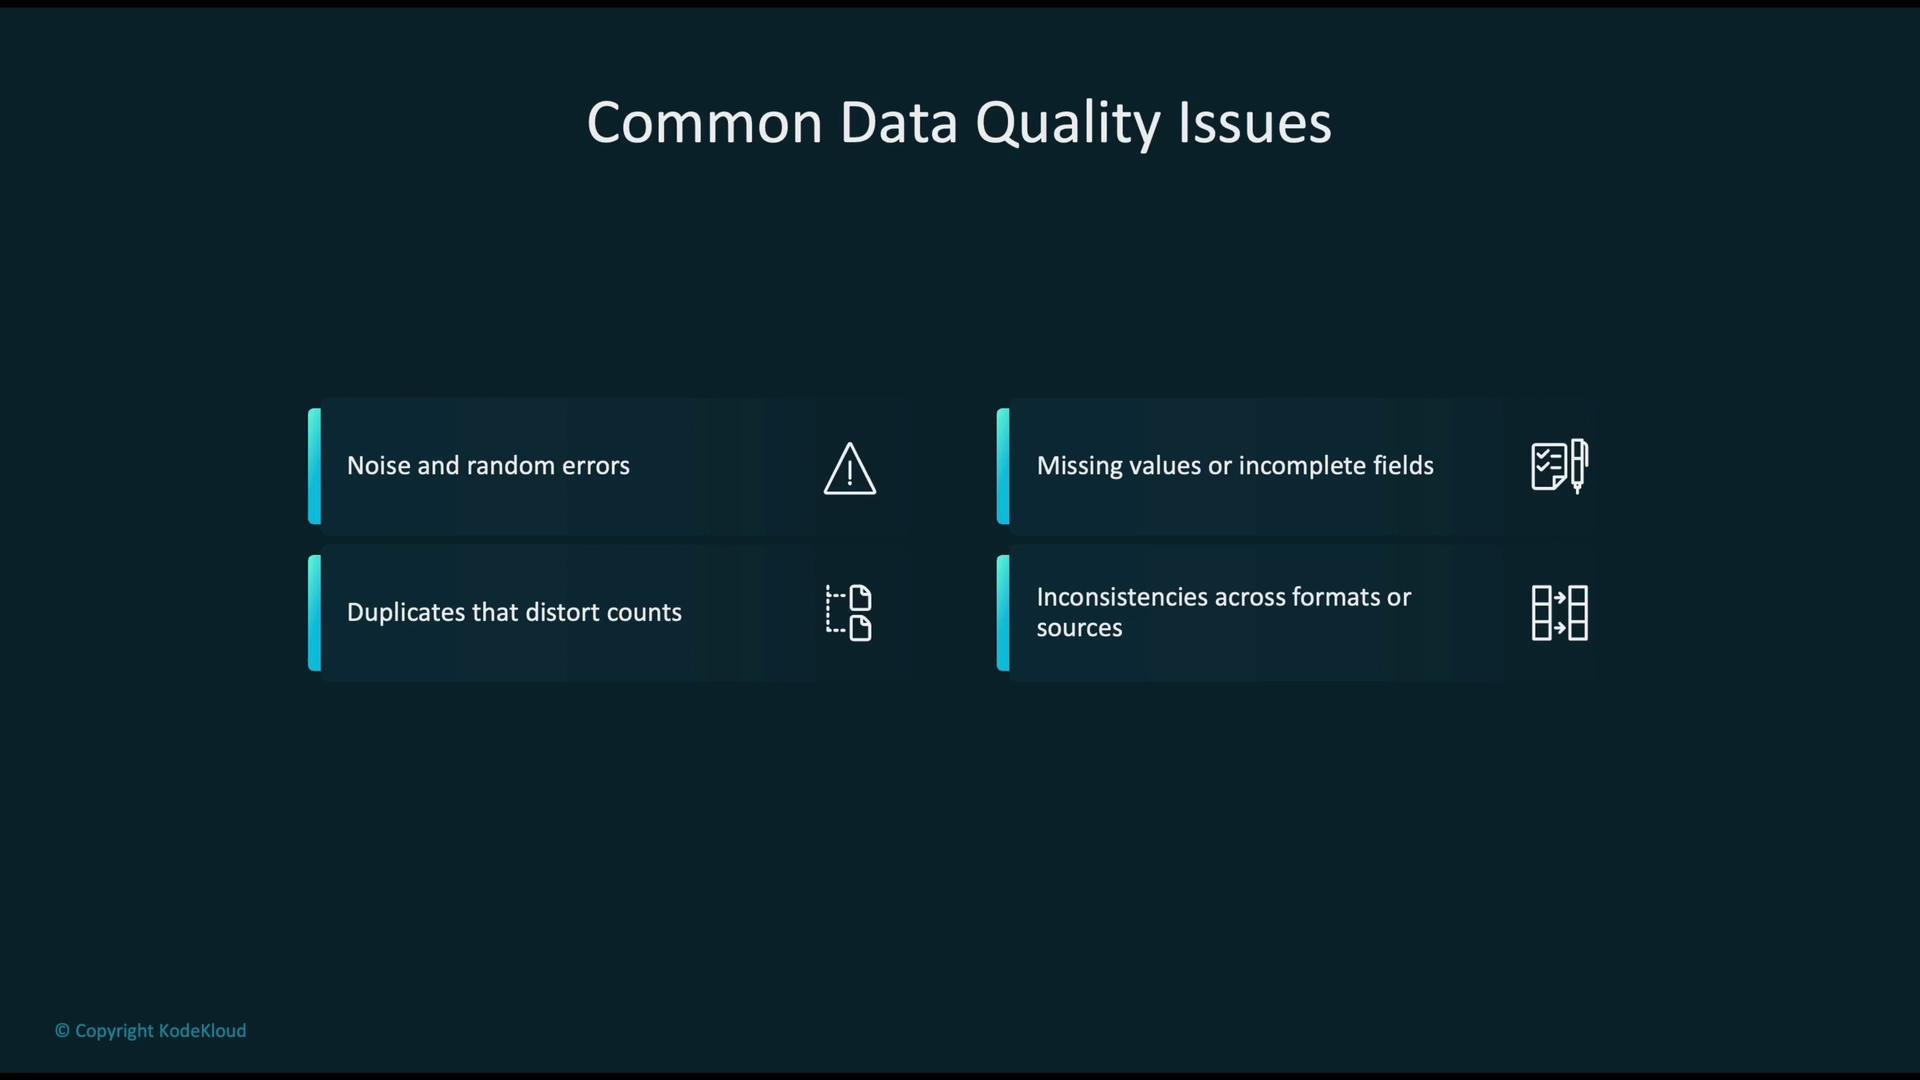
These problems should be detected and remediated before training to avoid degraded model performance.
The image lists common data quality issues: noise and random errors, duplicates, missing values, incomplete fields, and inconsistencies across formats or sources.

Data validation in ML: purpose and workflow

Data validation verifies that the data used for training, validation, and testing is accurate, consistent, and fit for purpose. Because ML models are data-driven, validation is essential to avoid biased, misleading, or poorly performing systems. Typical validation workflow:
  1. Raw data ingests into a staging area or pipeline.
  2. Run automated validation checks (schema, statistics, completeness).
  3. Flag, correct, or remove problematic records.
  4. Produce a validated dataset for training and evaluation.
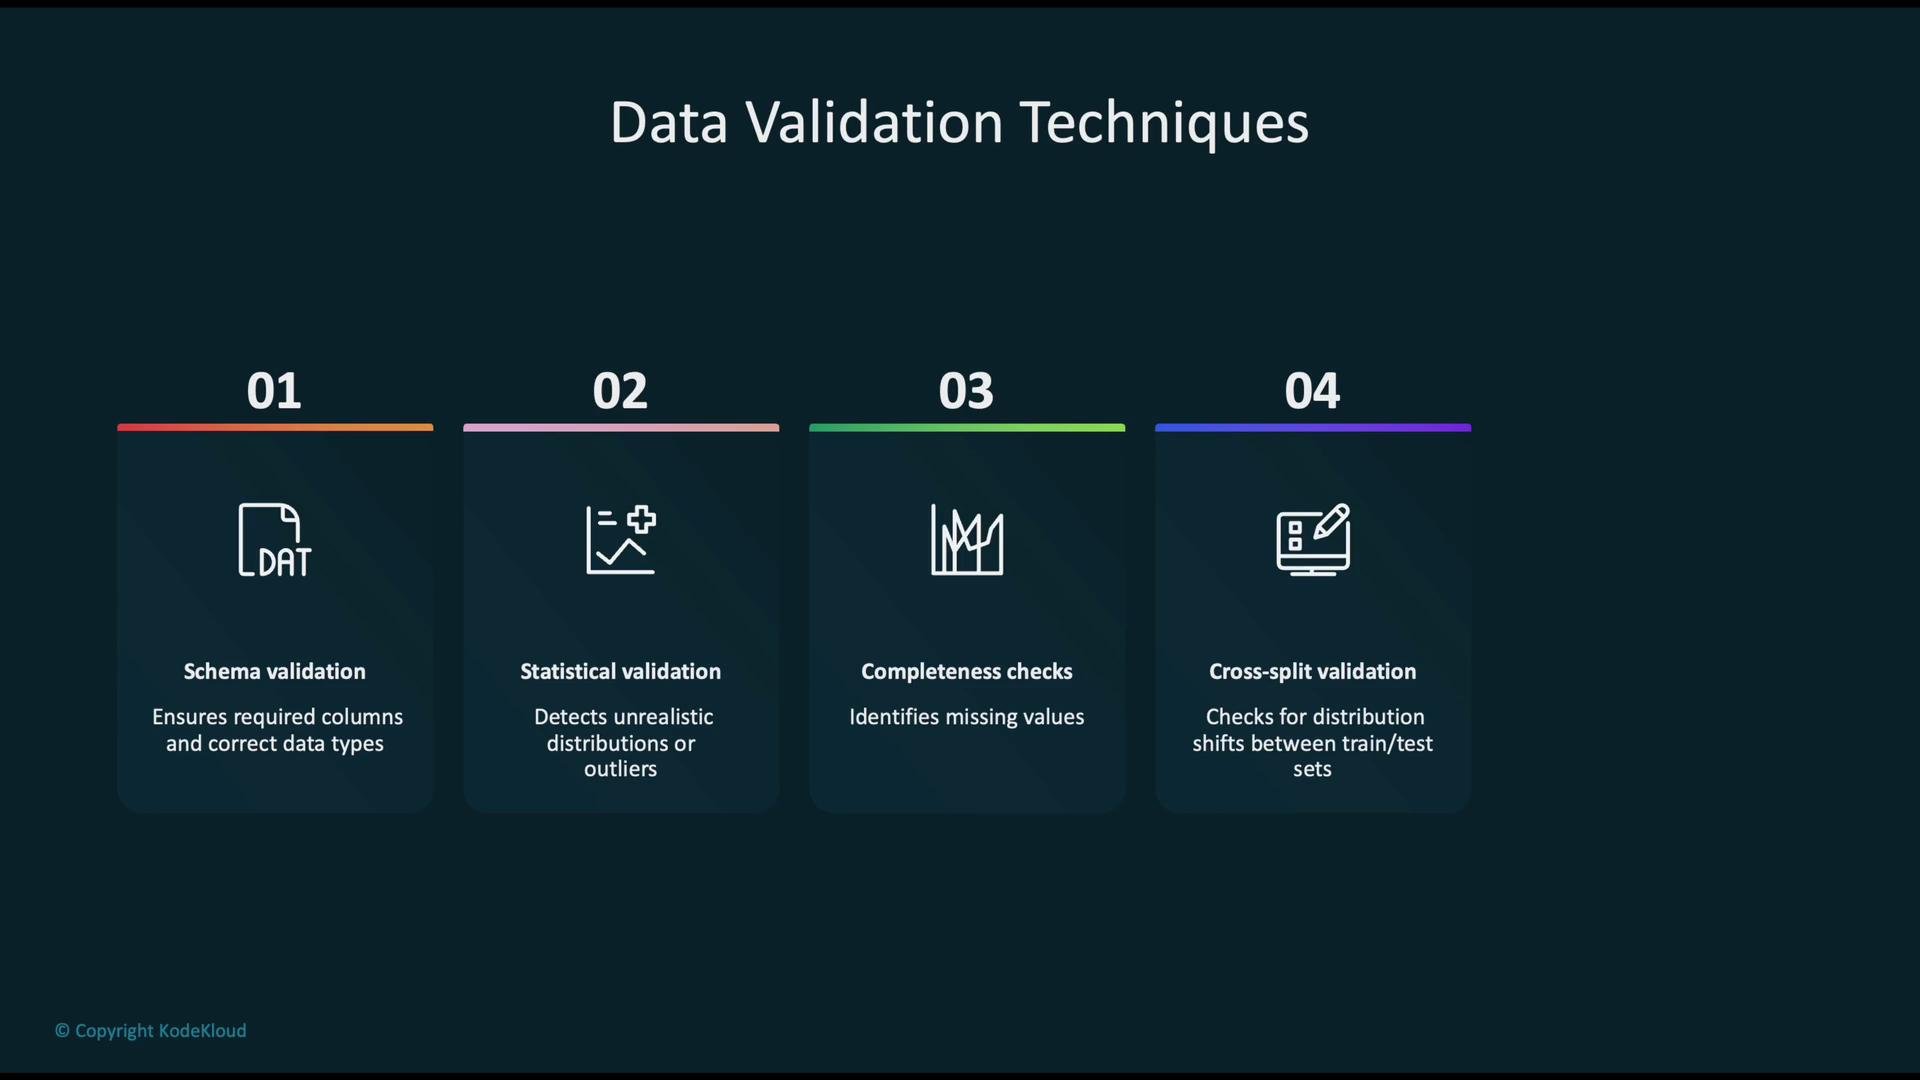
The image presents four data validation techniques: schema validation, statistical validation, completeness checks, and cross-split validation. Each technique includes a brief description of its purpose.

Common validation techniques

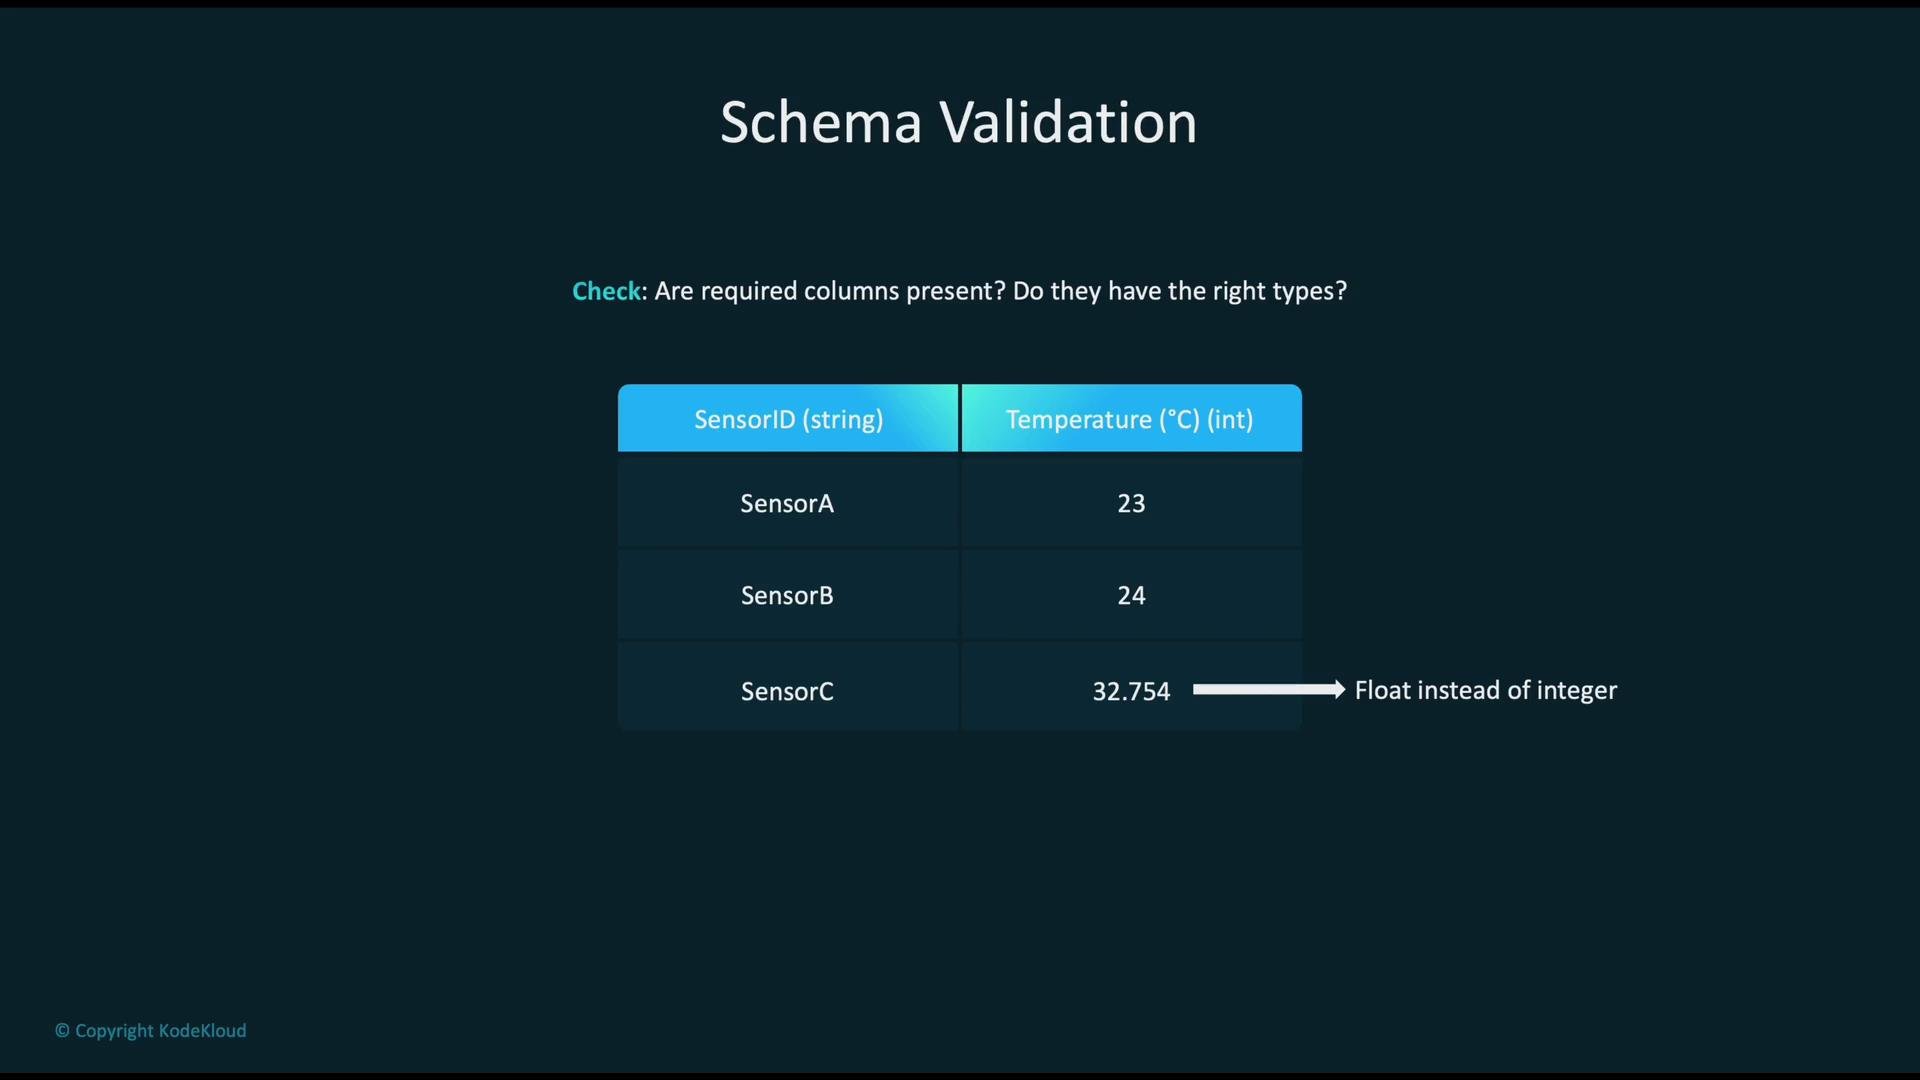
The image is a "Schema Validation" table showing sensor data, highlighting a type mismatch where a temperature value is a float instead of an integer. It includes columns for SensorID as strings and Temperature in Celsius as integers.
Schema validation
  • Verifies column names, types, nullability, and allowed ranges.
  • Prevents runtime errors when training pipelines expect a specific structure.
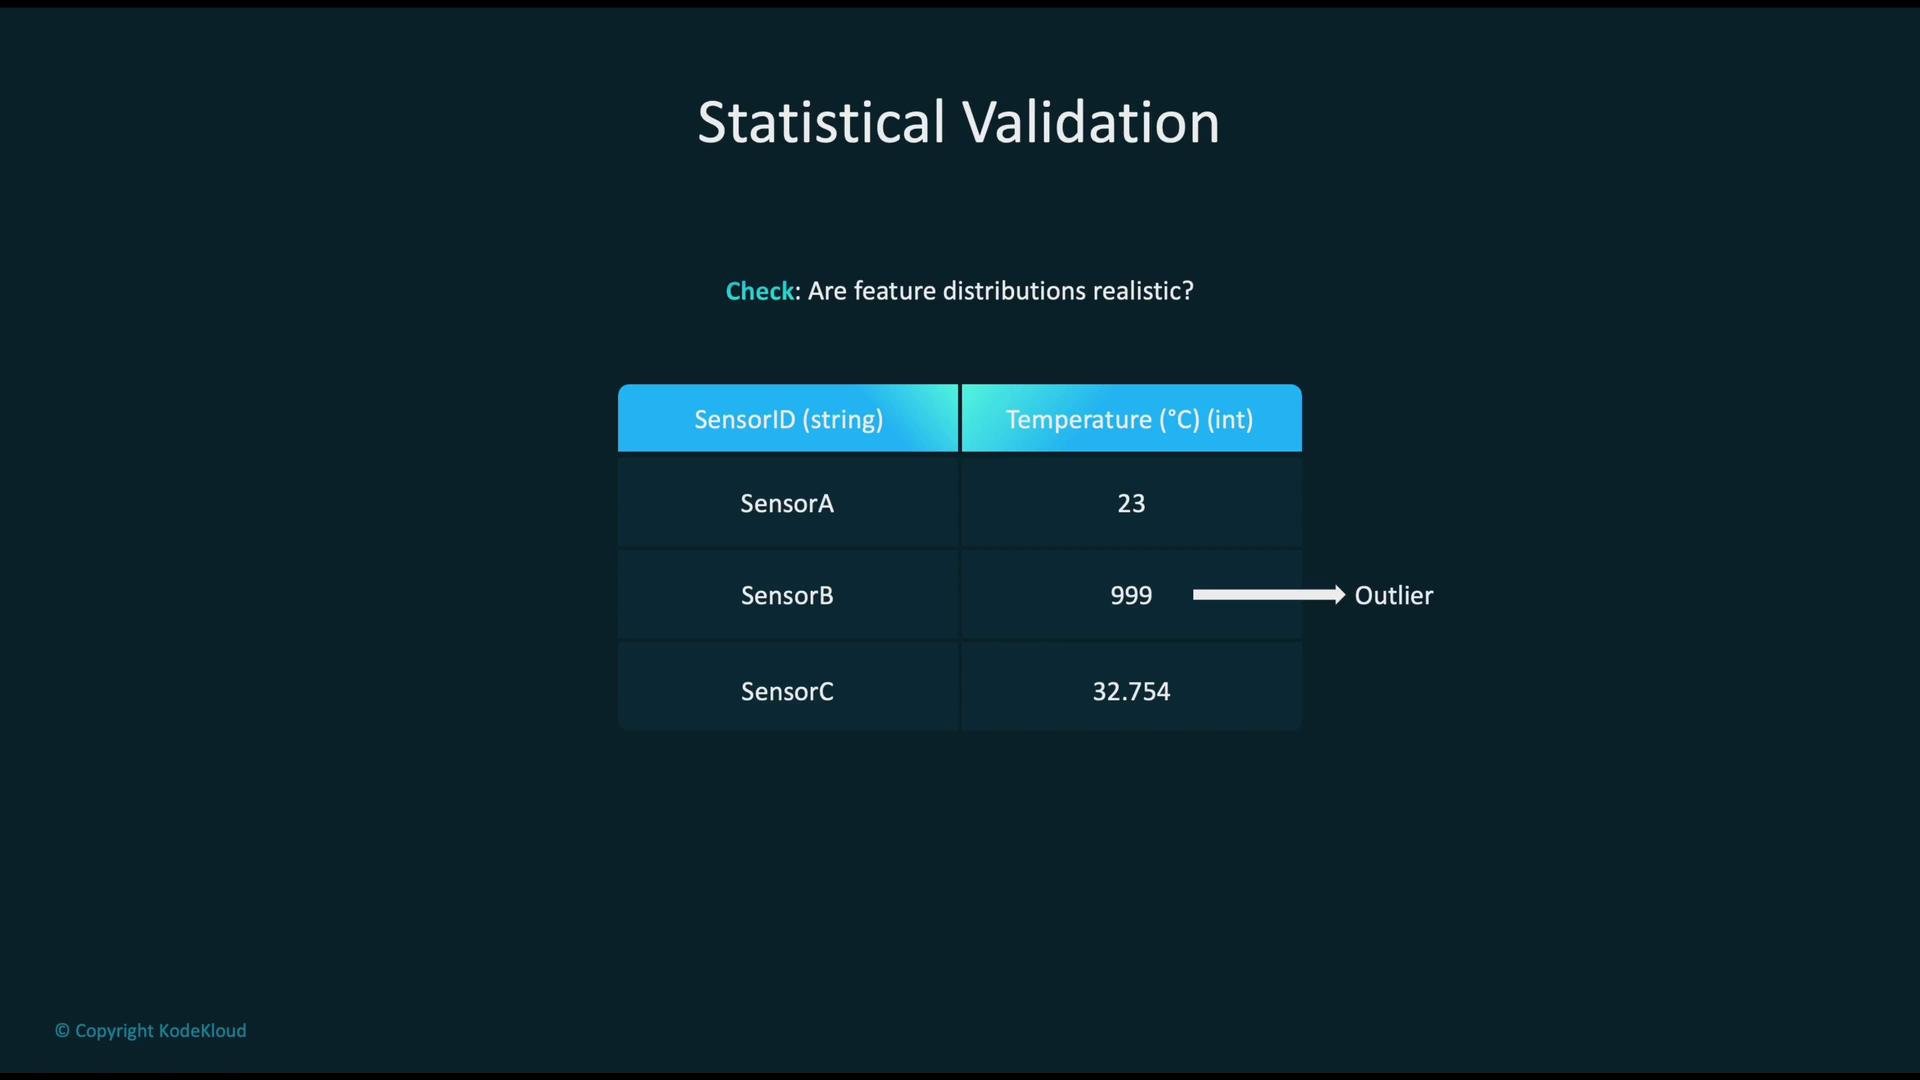
The image shows a table titled "Statistical Validation" with sensor IDs and corresponding temperatures, highlighting a temperature of 999 as an outlier.
Statistical validation
  • Compares feature distributions (mean, variance, quantiles) against expected ranges.
  • Detects outliers or improbable values (e.g., age = 999).
  • Useful for automated alerts when distribution drift occurs.
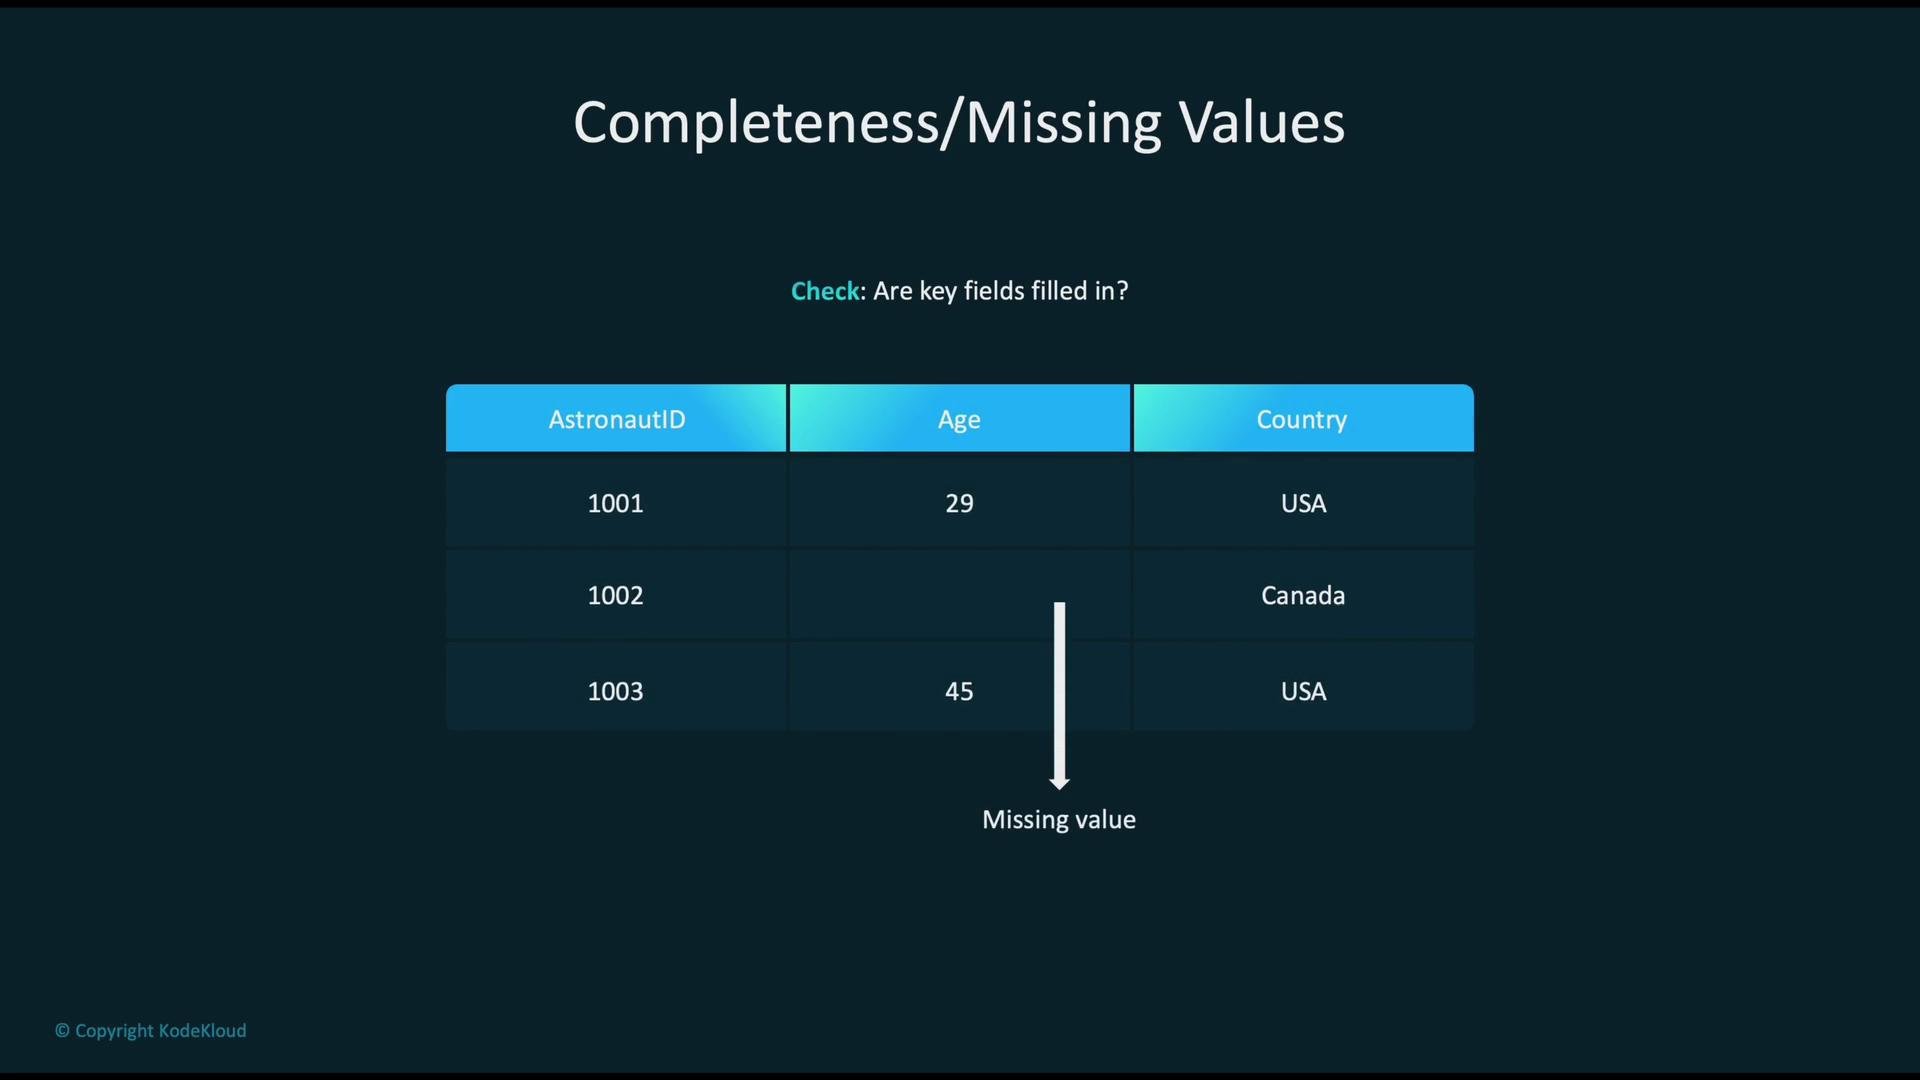
The image is a data table labeled "Completeness/Missing Values," showing entries for AstronautID, Age, and Country, with a missing value highlighted in the Country column for AstronautID 1002.
Completeness / missing-value checks
  • Identify absent mandatory fields and estimate coverage.
  • Decide on imputation strategies (mean, median, mode, model-based) or exclusion policies depending on the use case.
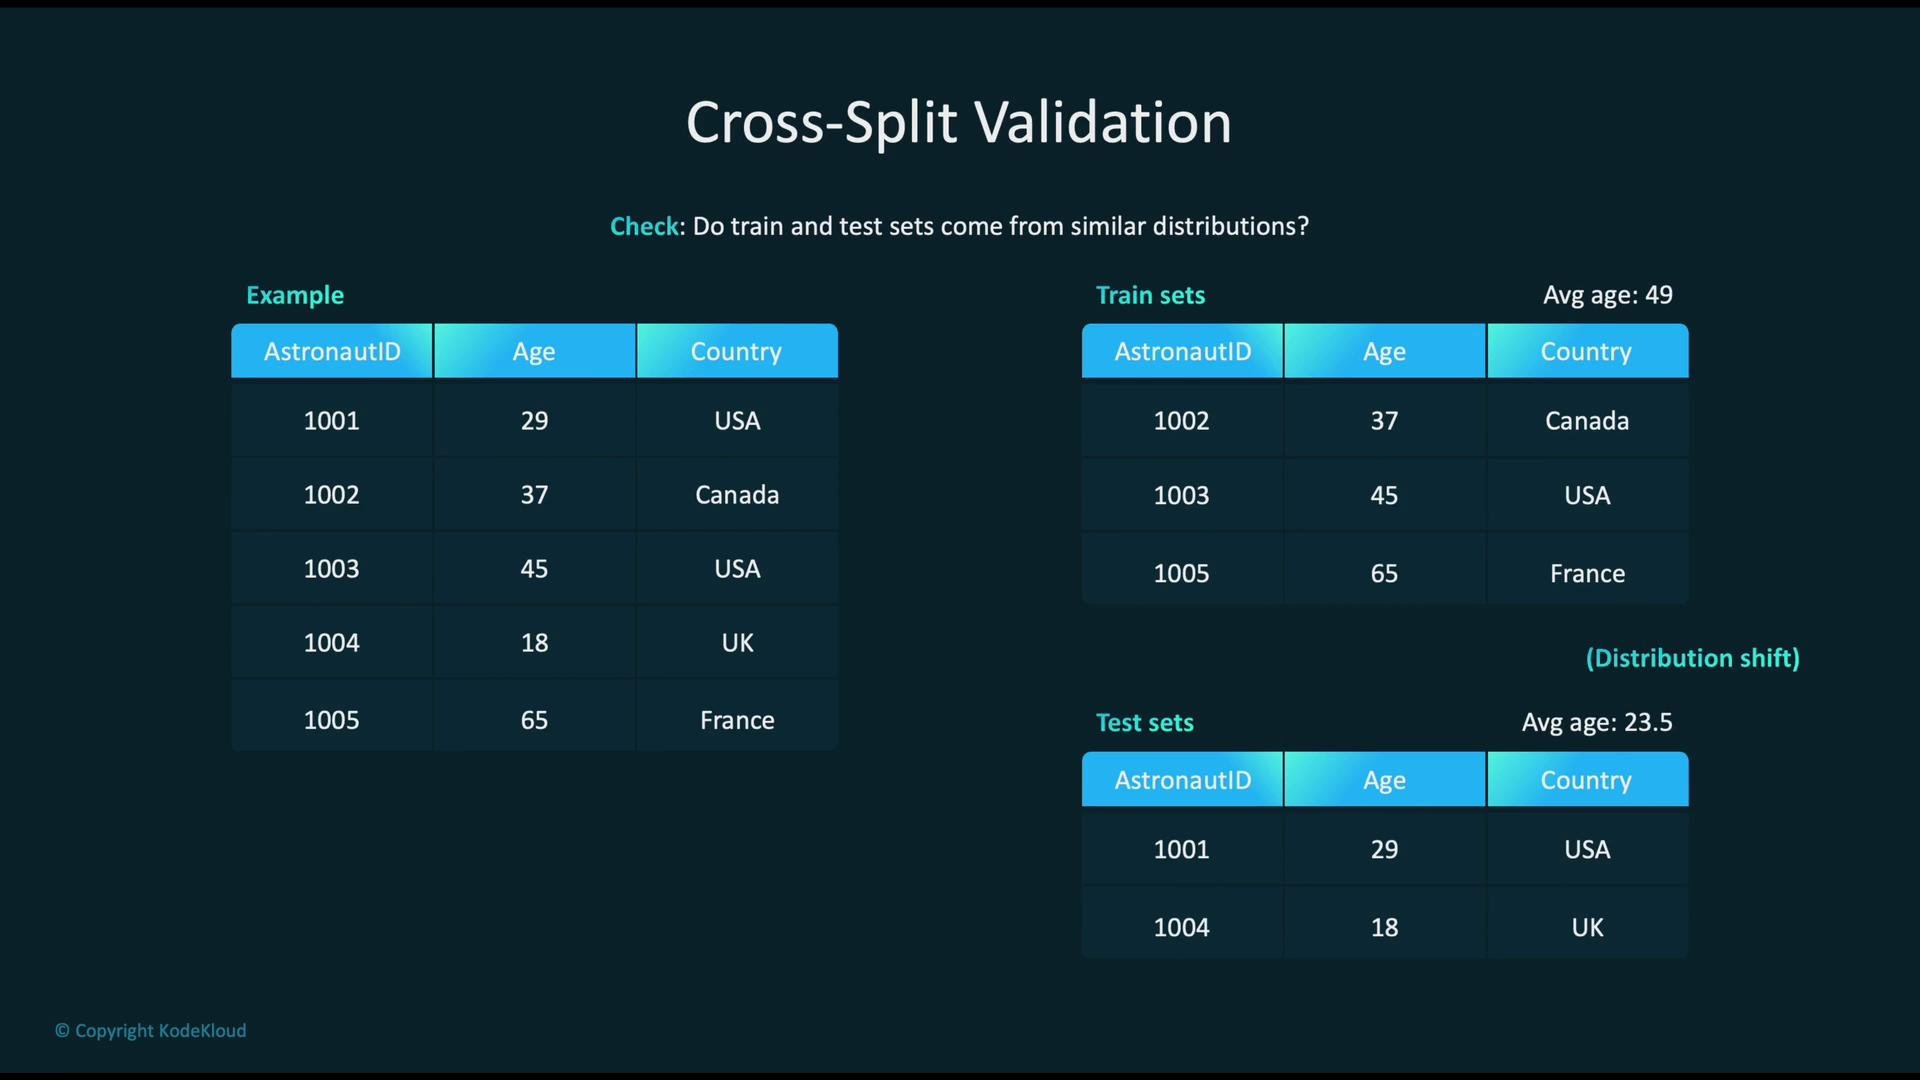
The image illustrates a concept of cross-split validation, showing a comparison between train and test sets, with a focus on age distribution and highlighting a distribution shift.
Cross-split validation
  • Compare key statistics across train/validation/test splits to detect distribution shift.
  • Example: a training-set average age of 49 vs. test-set average of 23.5 signals a problematic shift that can reduce generalization.
Categorical validation
  • Ensure categories use only allowed or expected values.
  • Strategies: map invalid entries to a special unknown category, replace with the mode, or consult domain experts when values indicate upstream issues.

Tools and services (AWS examples)

Data validation is not a one-time activity. Integrate automated checks into ingestion and training pipelines and add production monitoring (metrics, alerts) to catch drift, schema changes, or emerging data-quality problems early.

Data drift and model degradation

Data drift occurs when production data diverges from the data on which the model was trained. Types of drift:
  • Covariate shift — Input feature distributions change.
  • Prior-probability shift — Class priors (label proportions) change.
  • Concept drift — The relationship between features and the target evolves.
Consequences include reduced accuracy, harmful biases, and unreliable predictions. Detection approaches:
  • Monitor feature distributions and key statistics over time.
  • Track model performance metrics (accuracy, precision/recall, calibration) on recent data.
  • Implement alerting thresholds for significant distribution or performance changes.
Mitigations:
  • Trigger automated retraining or fine-tuning pipelines when drift is detected.
  • Ensure consistent feature engineering between training and inference.
  • Keep a rolling or periodically refreshed validation dataset that reflects production conditions.
  • Use incremental learning or continuous training for rapidly changing domains.
Without continuous validation and monitoring, even well-trained models will degrade as data and environments change. Implement automated drift detection, alerts, and retraining workflows to maintain model reliability.
Further reading and references

Watch Video