Welcome to this lesson. Here we focus on using Amazon SageMaker Data Wrangler to import, explore, and prepare tabular data for machine learning workflows. Although the title references Kinesis, this demo demonstrates batch ingestion using a CSV stored in Amazon S3; real-time ingestion with Kinesis requires a different pipeline and is out of scope for this walkthrough. What you will learn:
  • Where to find Data Wrangler in the SageMaker console
  • How to import a tabular CSV from Amazon S3
  • How to inspect schema, distributions, and anomalies
  • How to apply transforms (imputation) and review a dataset summary
  • How to export a clean dataset for training

Locate Data Wrangler in the SageMaker Console

AWS periodically reorganizes the console UI, so the first step is locating Data Wrangler inside the SageMaker product area.
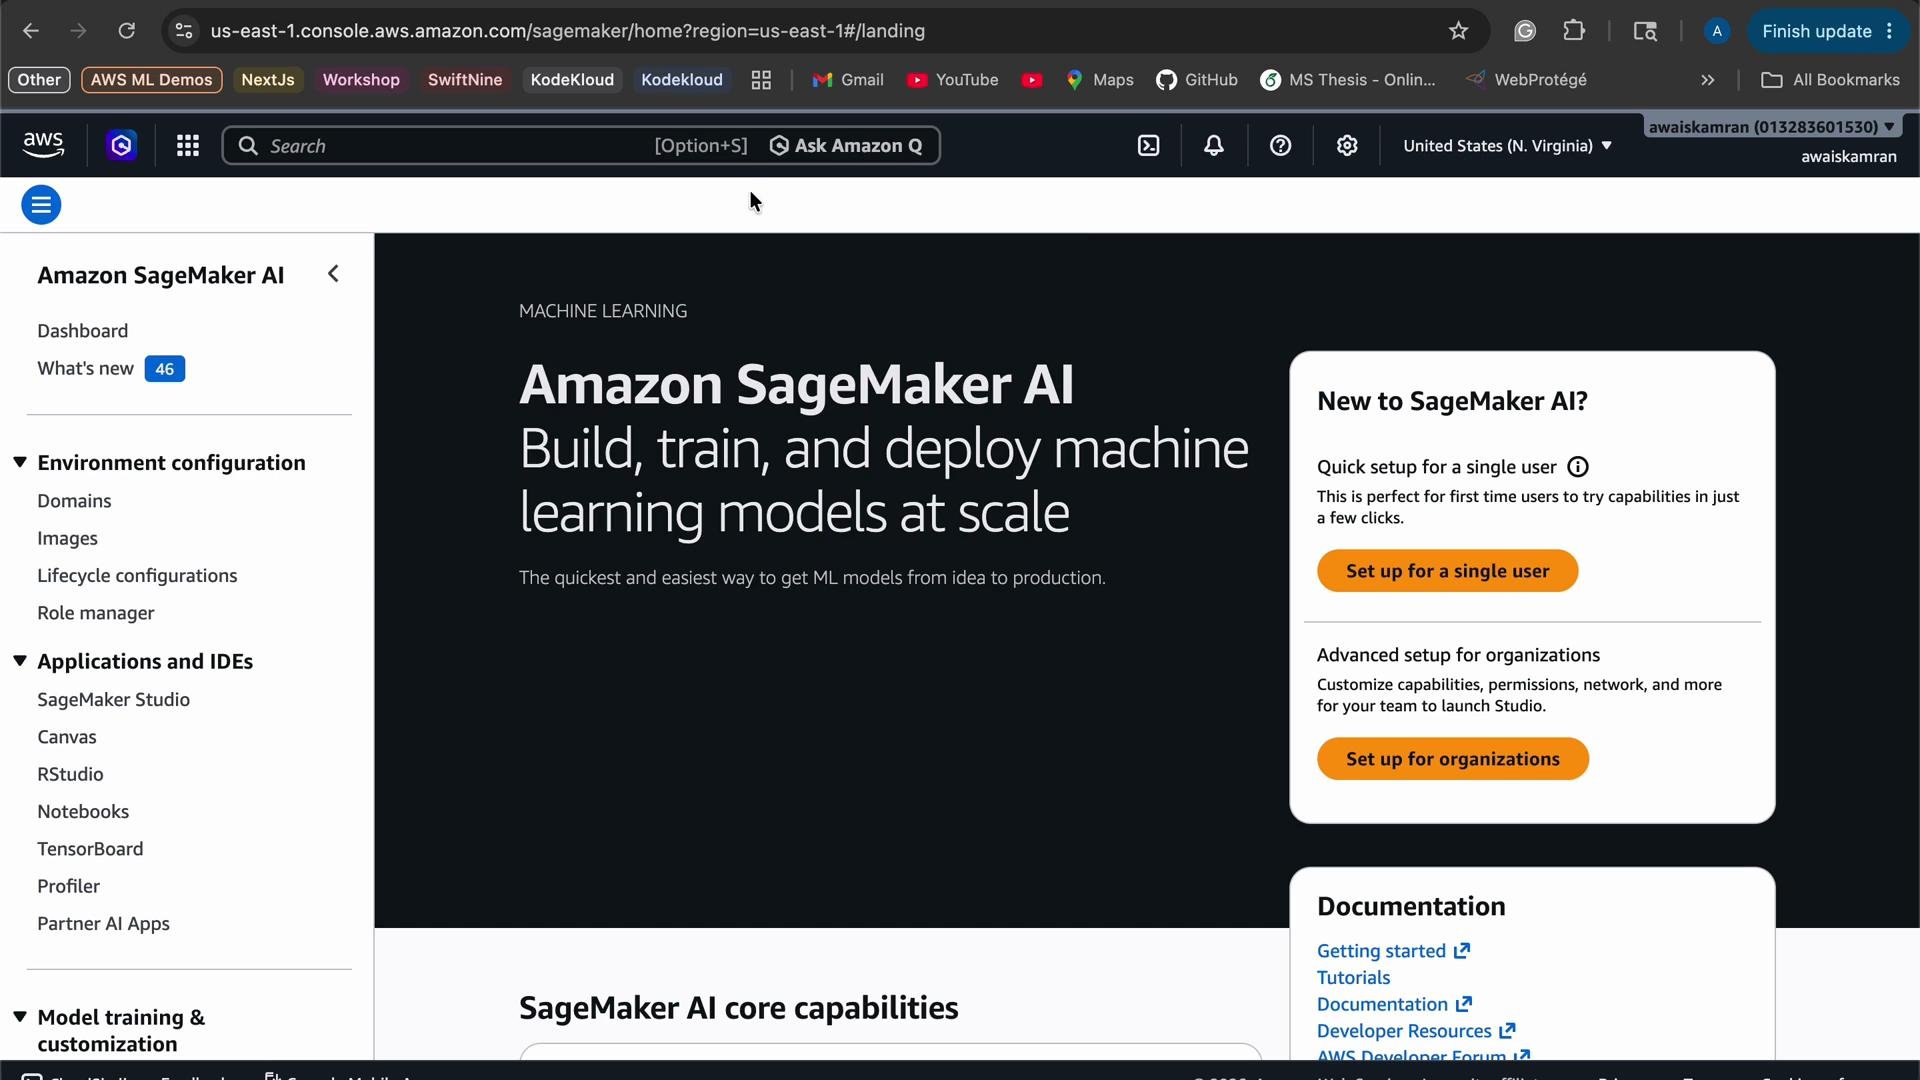
The image shows an Amazon SageMaker AI dashboard webpage, promoting machine learning model building, training, and deployment at scale with setup options and documentation links.
Search for “SageMaker” in the AWS console. You may see entries like Amazon SageMaker (data analytics and AI hub) and Amazon SageMaker AI (for building, training, and deploying models). Data Wrangler is accessible from SageMaker Studio and Canvas. In this example we launch SageMaker Canvas and wait for the UI to become available; Data Wrangler appears in the top-left of Canvas when ready. Amazon SageMaker Data Wrangler is designed to streamline data import, exploration, and large-scale transformations. It provides hundreds of built-in transforms and supports many data sources for tabular datasets.

Data Wrangler Interface — Import and Prepare

Open Data Wrangler to begin a new flow. The UI shows import, prepare, and analyze steps visually so you can build a reproducible data flow.
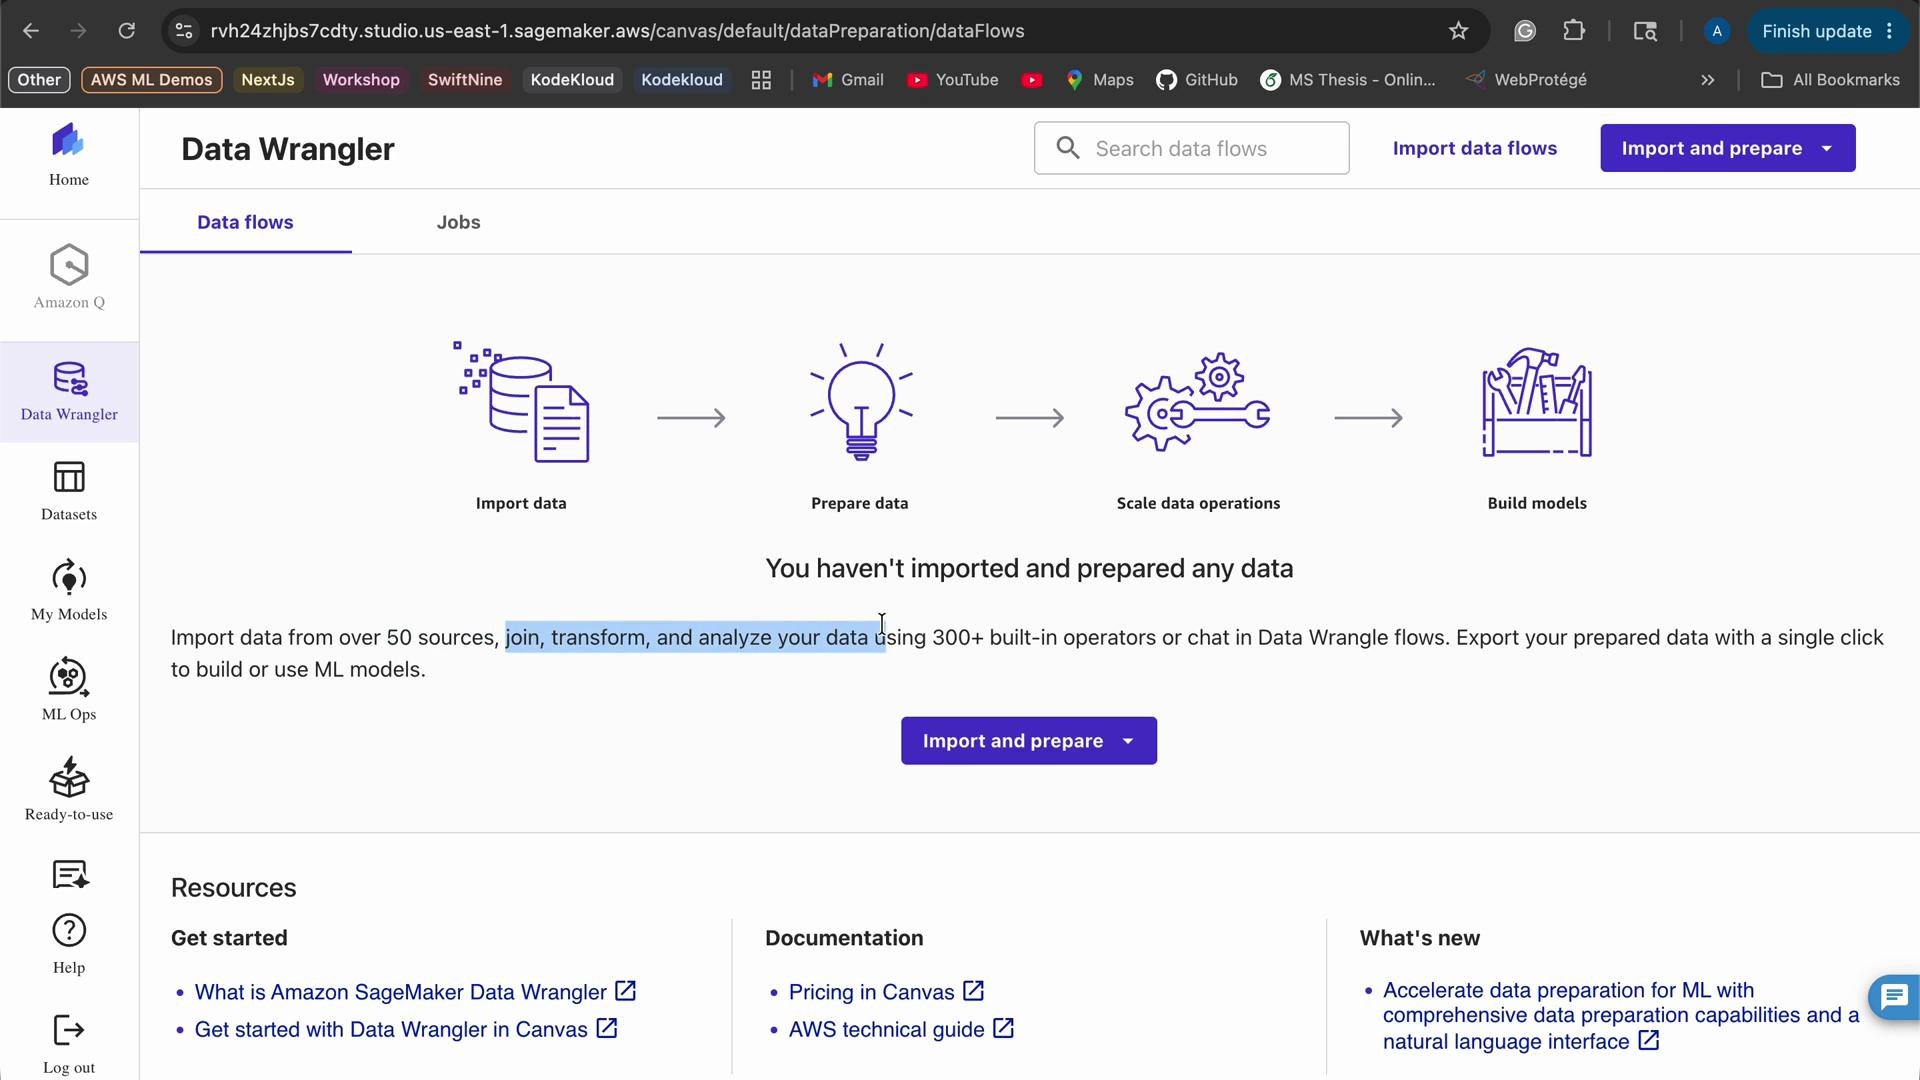
The image shows the interface of Amazon SageMaker Data Wrangler, highlighting steps for importing, preparing, and analyzing data with options such as "Import and prepare." There are icons illustrating the data processing workflow and resources for getting started.

Import a CSV from Amazon S3

Data Wrangler supports many sources: local uploads, Snowflake, Redshift, PostgreSQL, MySQL, and Amazon S3. For this demo the raw dataset is stored in S3 under a bucket named “Machine Learning Demo”. We navigate to that S3 location and select the Titanic CSV to import.
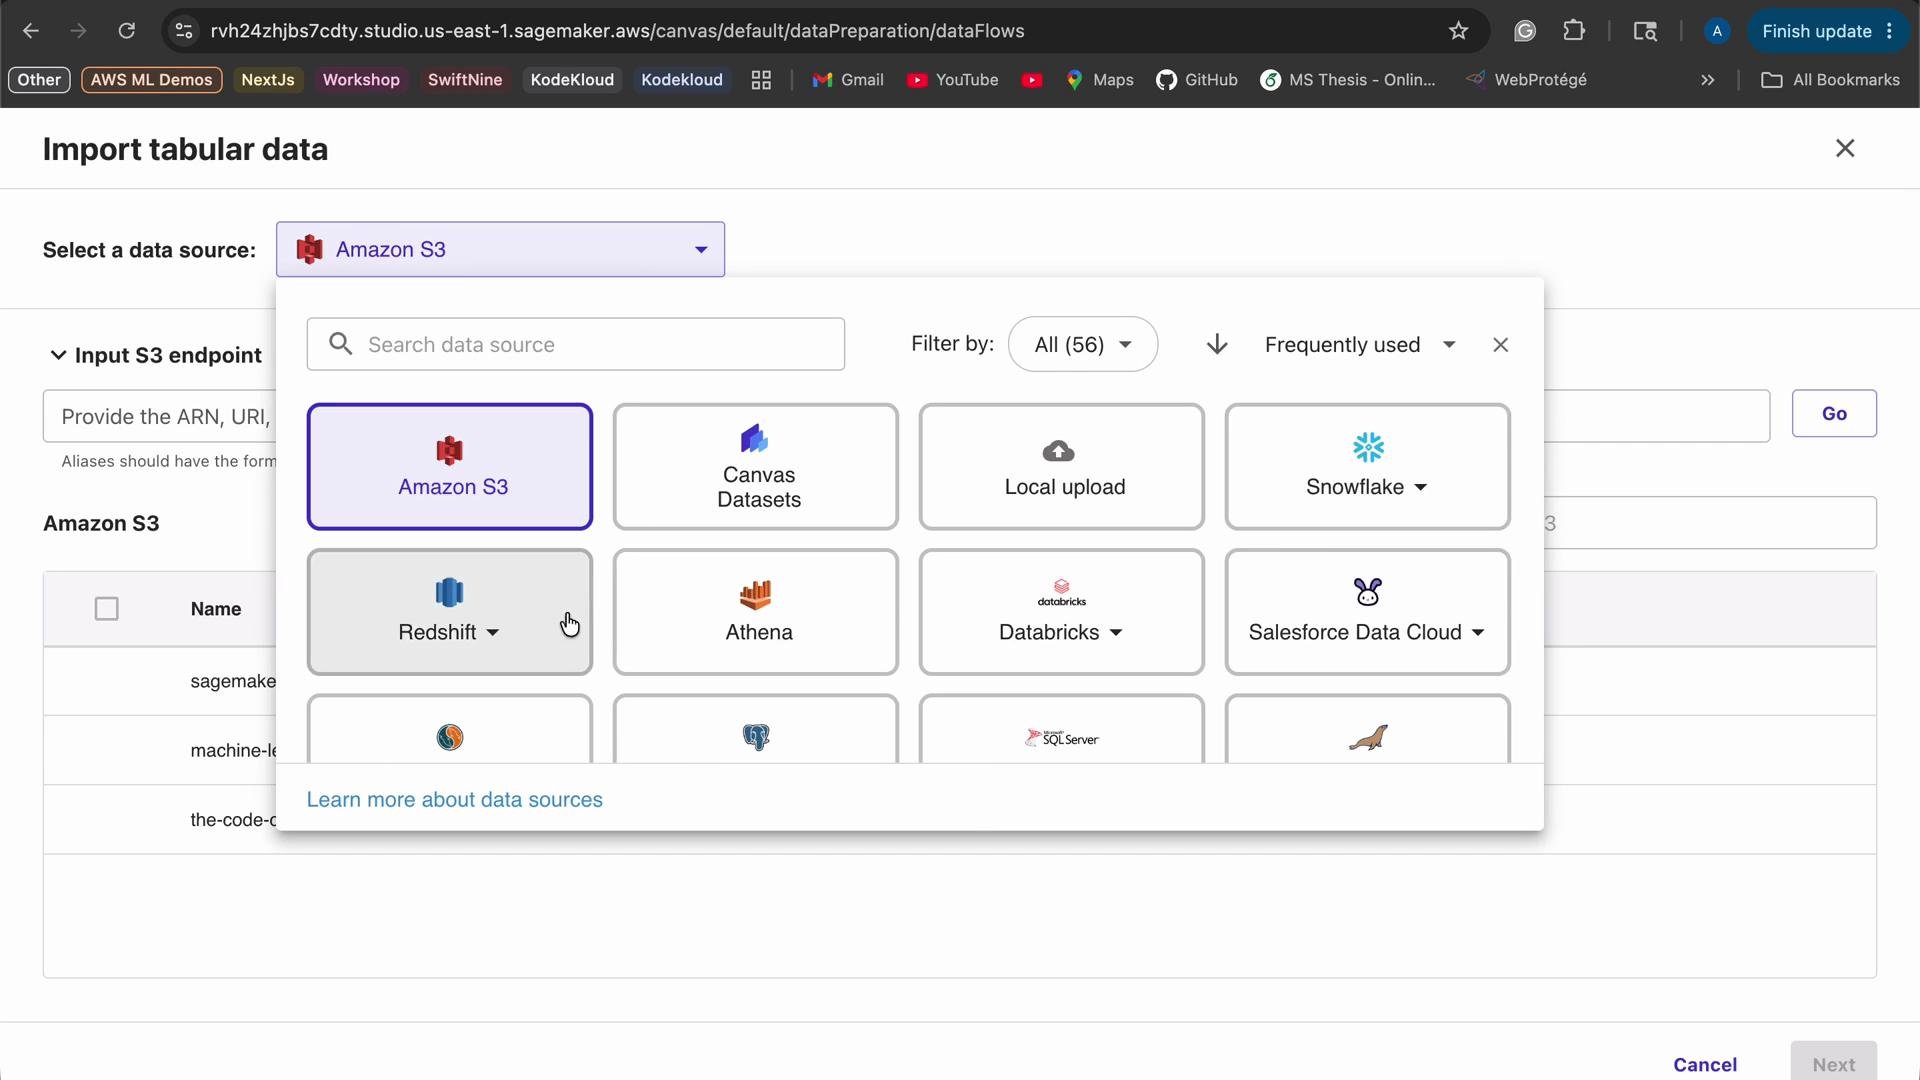
The image shows a data source selection interface for importing tabular data, with options like Amazon S3, Redshift, Canvas Datasets, and others. The interface is part of an AWS SageMaker session.
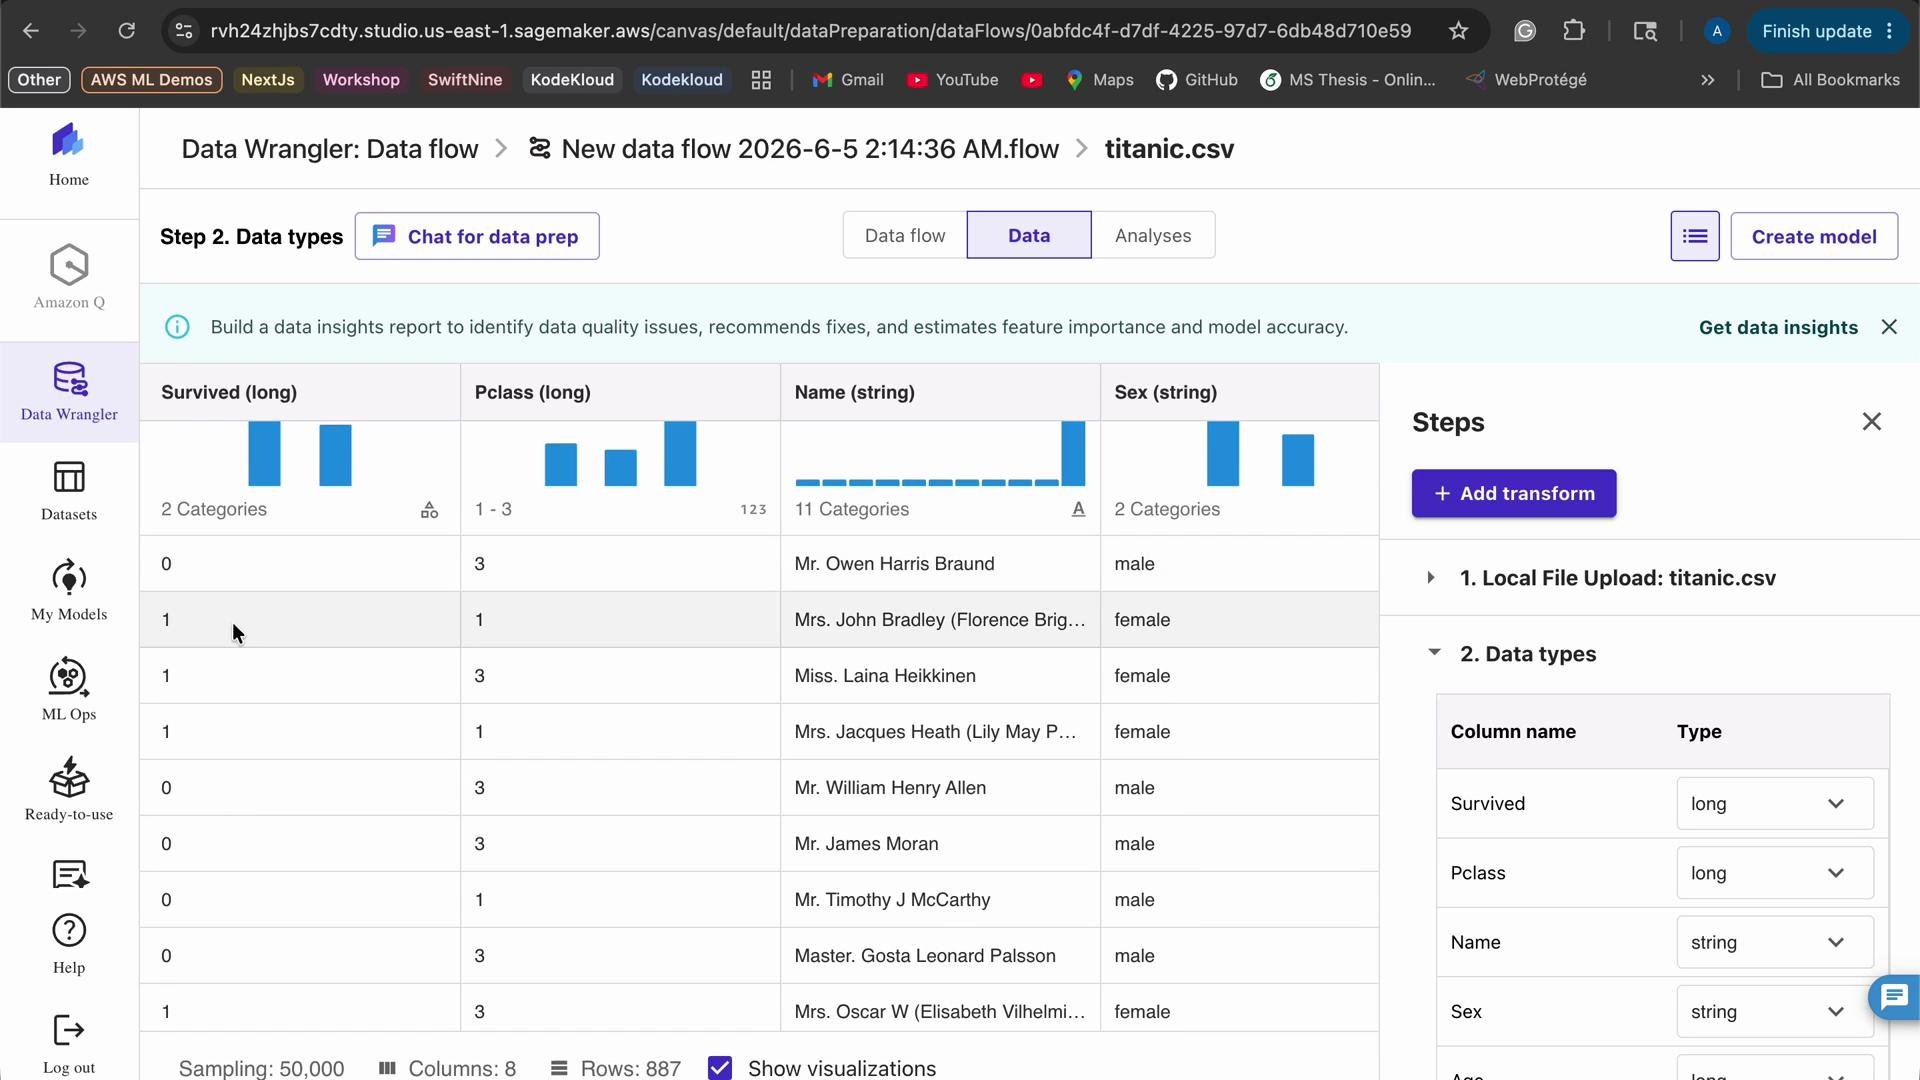
After import completes, Data Wrangler auto-detects column types and provides quick visual summaries for each feature.
The image shows a screenshot of a data wrangling interface in AWS SageMaker's Data Wrangler, displaying columns from a "titanic.csv" dataset, including attributes like "Survived," "Pclass," "Name," and "Sex." There are visualizations representing data categories and column type options on the right side.
Example: the Survived column is detected as numeric/binary with two classes, 0 and 1. Data Wrangler shows distribution percentages (e.g., ~61.44% class 0, 38.56% class 1) when you hover over categories, which helps assess class balance before modeling.

Apply a Transform — Imputation

Common preprocessing tasks are available as built-in transforms. One frequent action is imputing missing numeric values (replace NaN with mean, median, etc.).
Imputation replaces missing numeric values using a chosen strategy (mean, median, mode, constant, etc.). The median is robust to outliers and is often a safe default when numeric distributions are skewed.
In this demo we add an imputation transform with the median strategy and target numeric columns such as Pclass, Fare, and Age. After applying the transform, Data Wrangler runs the step and updates the preview.
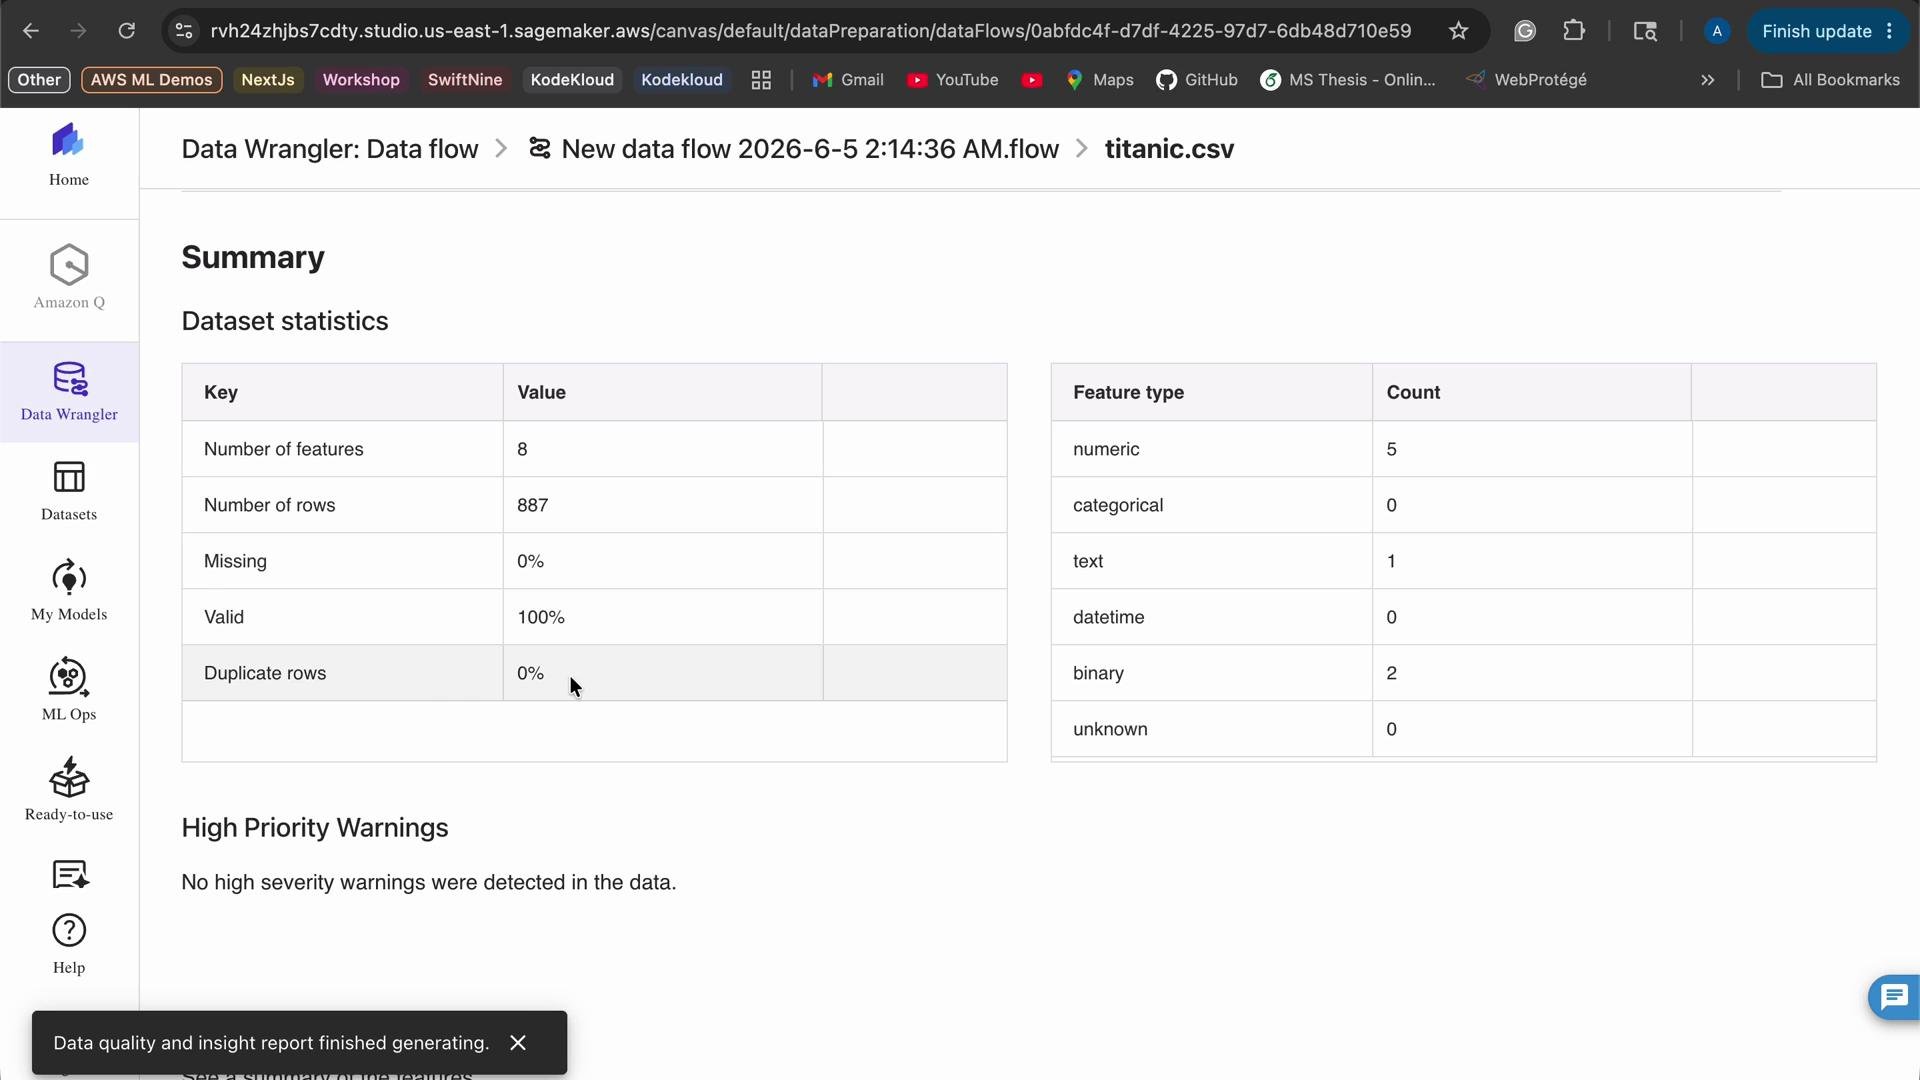
The image shows a summary of dataset statistics for "titanic.csv" in AWS SageMaker's Data Wrangler, including details on features, rows, and data validity. It also indicates that no high severity warnings were detected in the data.

Review Data Flow and Dataset Summary

The Data Flow diagram visualizes each node: original source → inferred types → added transforms (imputation, formulas, filters, etc.). This makes your preparation pipeline reproducible and auditable. After running the analysis Data Wrangler produces a dataset summary. For the Titanic demo the summary shows:
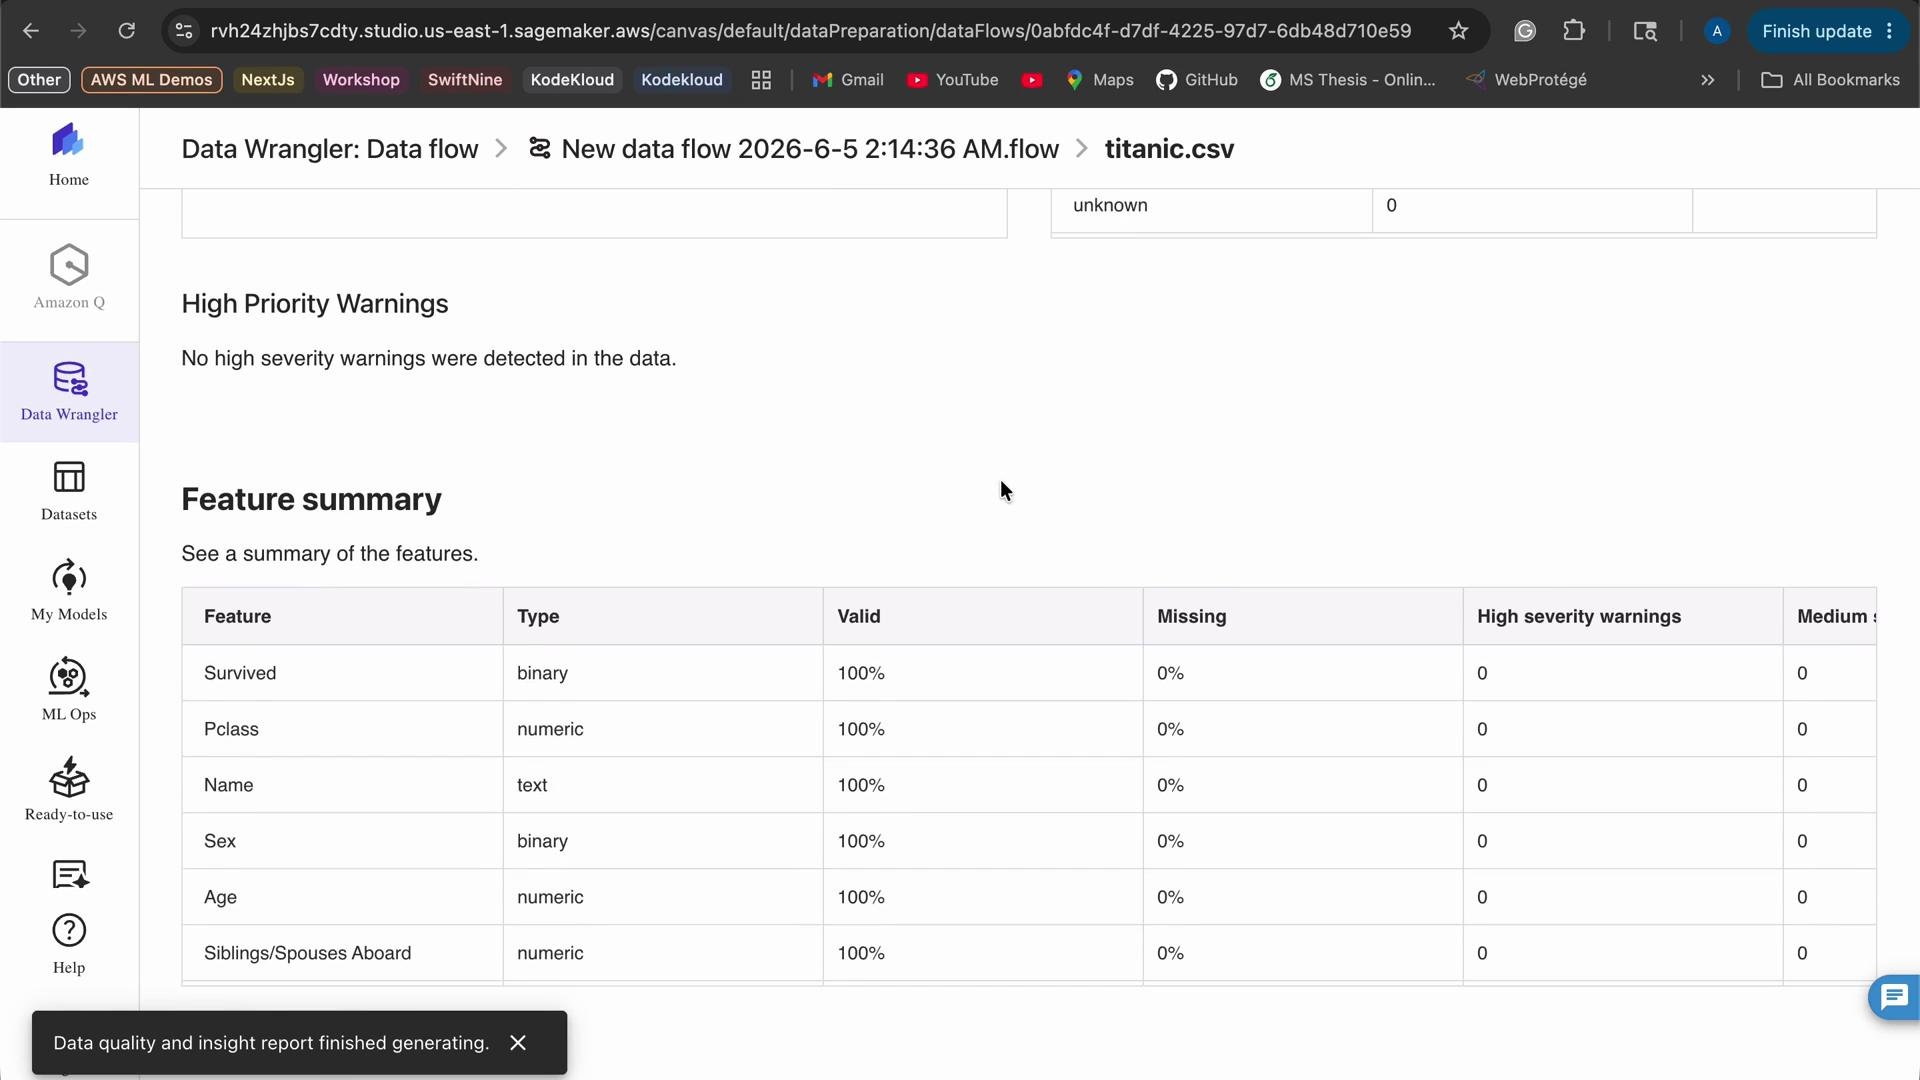
The image is a screenshot from AWS Data Wrangler showing a feature summary for the Titanic dataset with columns such as "Survived," "Pclass," "Name," "Sex," "Age," and "Siblings/Spouses Aboard," all with 100% validity and no missing data.
This summary indicates the dataset is suitable for further feature engineering or for export to a model training pipeline.

Inspect Anomalies and Feature-Level Analysis

Data Wrangler highlights anomalous samples and their anomaly scores so you can review outliers, data quality issues, or edge cases that may affect modeling.
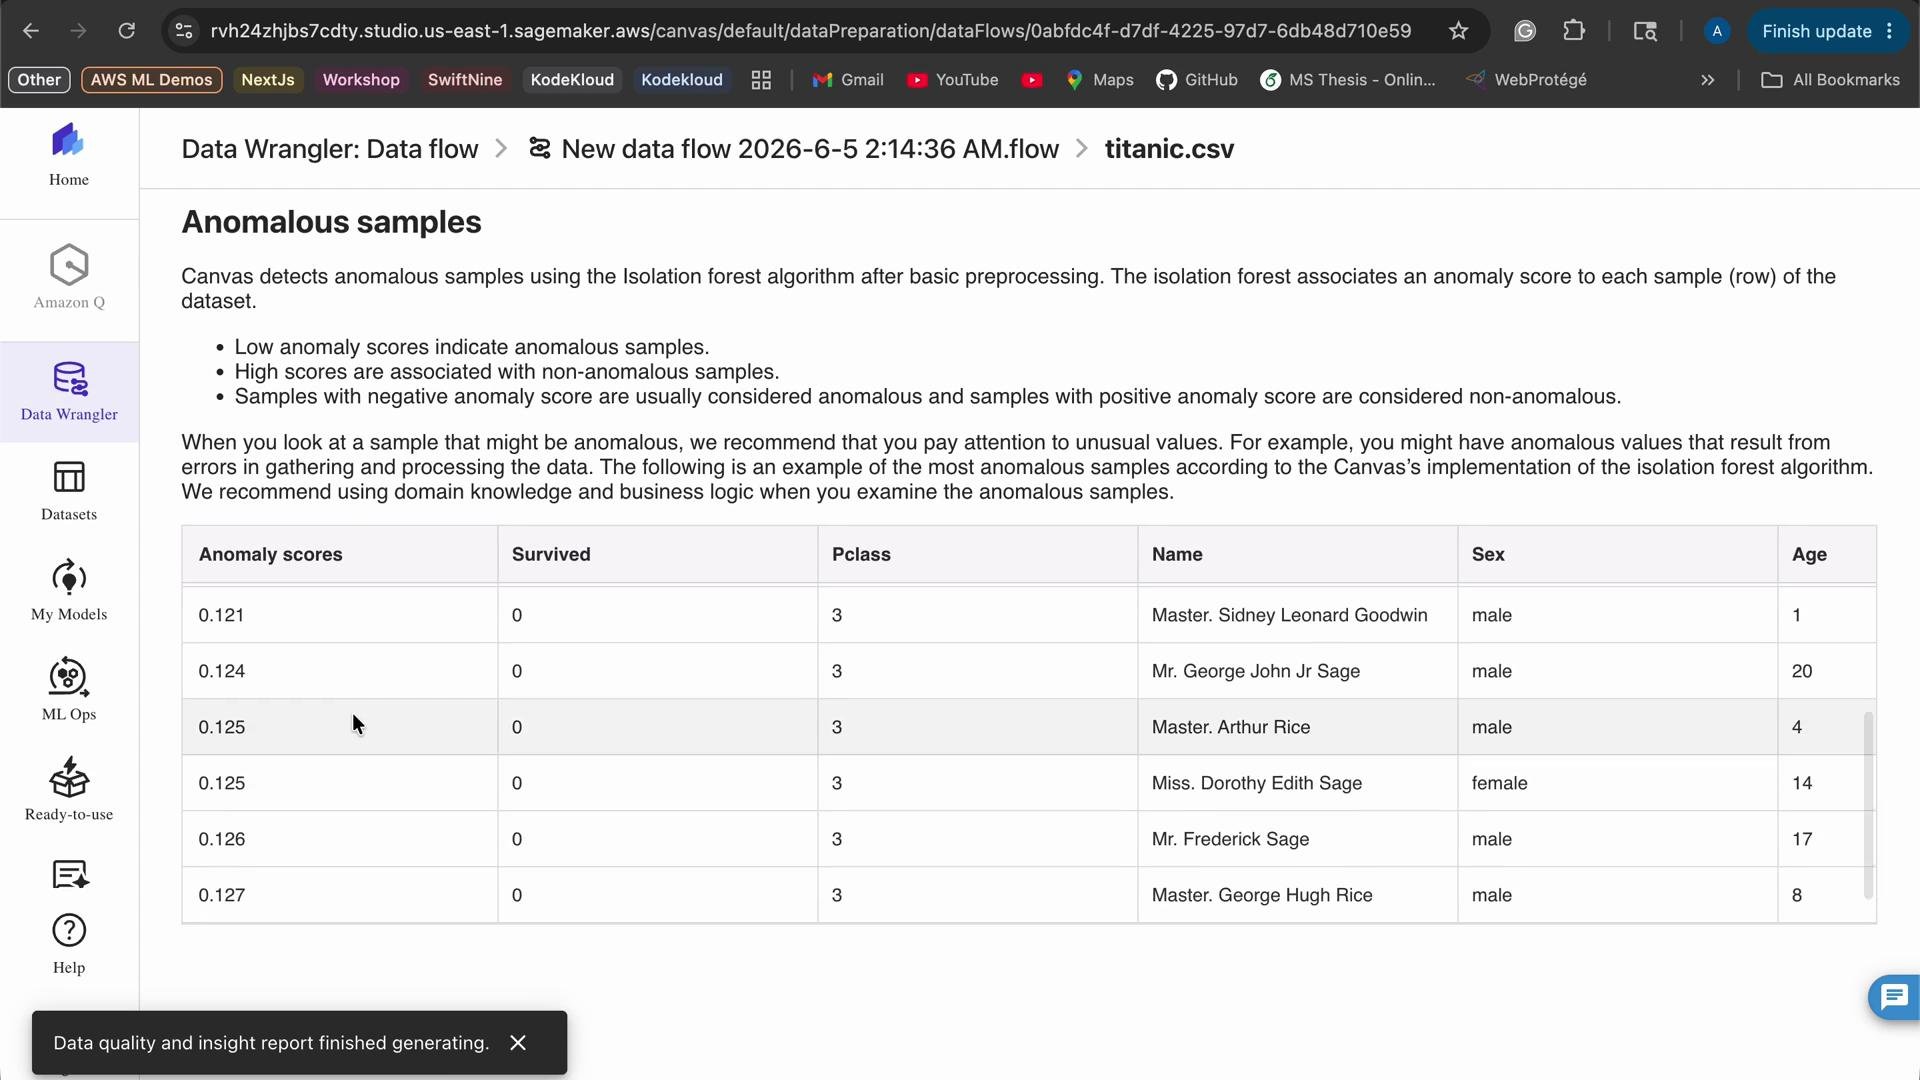
The image shows a table from a data analysis tool displaying anomalous samples from a Titanic dataset. It includes fields for anomaly scores, survival status, class, name, sex, and age of individuals.
For any feature (for example, Survived) you can drill down to view:
  • Histograms and distributions
  • Validity and missing-value percentages
  • Value counts or percentiles for numeric columns
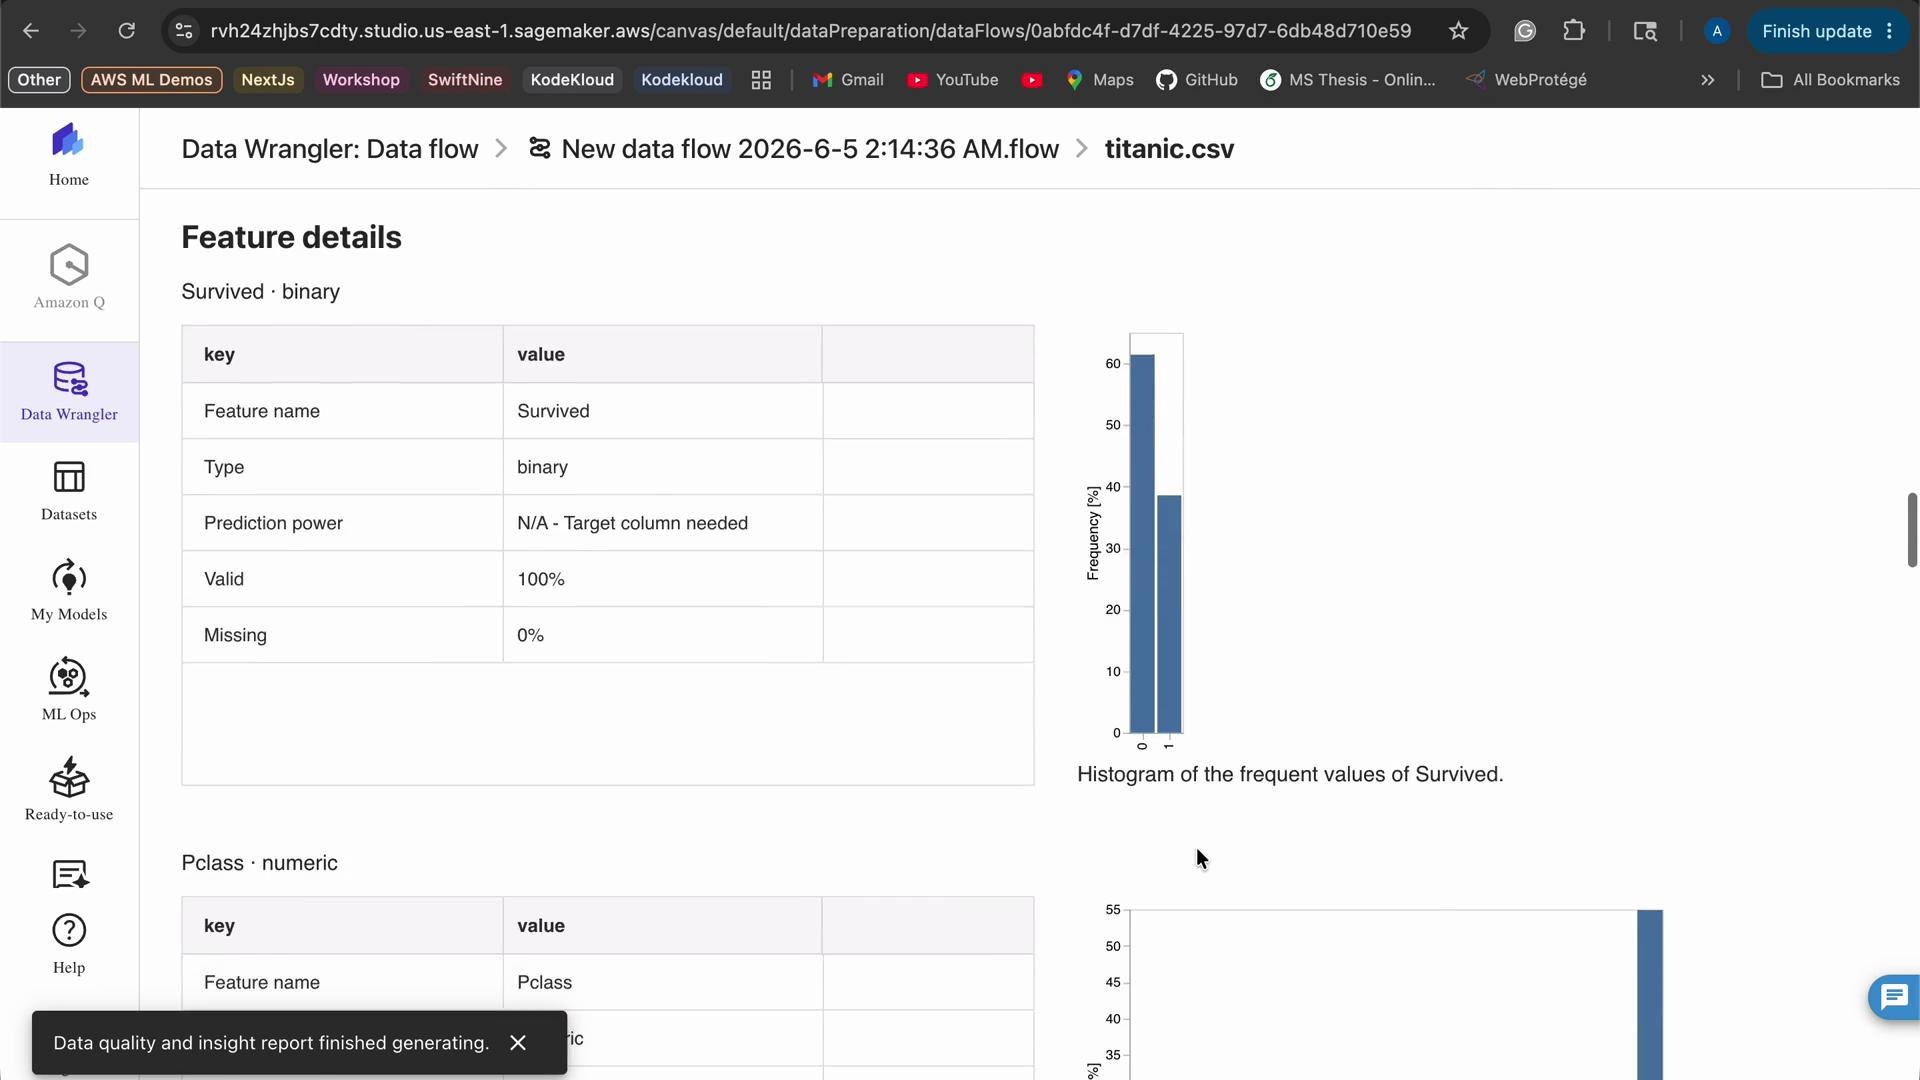
These visual diagnostics inform decisions on encoding, scaling, binning, or additional cleaning before export.
The image shows a data analysis interface from AWS Data Wrangler featuring details about a binary feature named "Survived," including its type, validity, and missing data percentage, alongside a histogram displaying the frequency of the feature's values.

Quick Step-by-Step Summary

  1. Open SageMaker Canvas / Studio and launch Data Wrangler.
  2. Import your dataset (e.g., CSV from Amazon S3).
  3. Inspect inferred schema, distributions, and missing values.
  4. Add transforms (imputation, encoding, normalization, custom formulas).
  5. Run the flow and review the dataset summary and anomaly table.
  6. Export the cleaned dataset to your training pipeline or notebook.

Common Data Sources (examples)

SageMaker Data Wrangler streamlines data import, visualization, cleaning, and transformation so you can prepare high-quality datasets for downstream model training and evaluation.

Watch Video

Practice Lab