

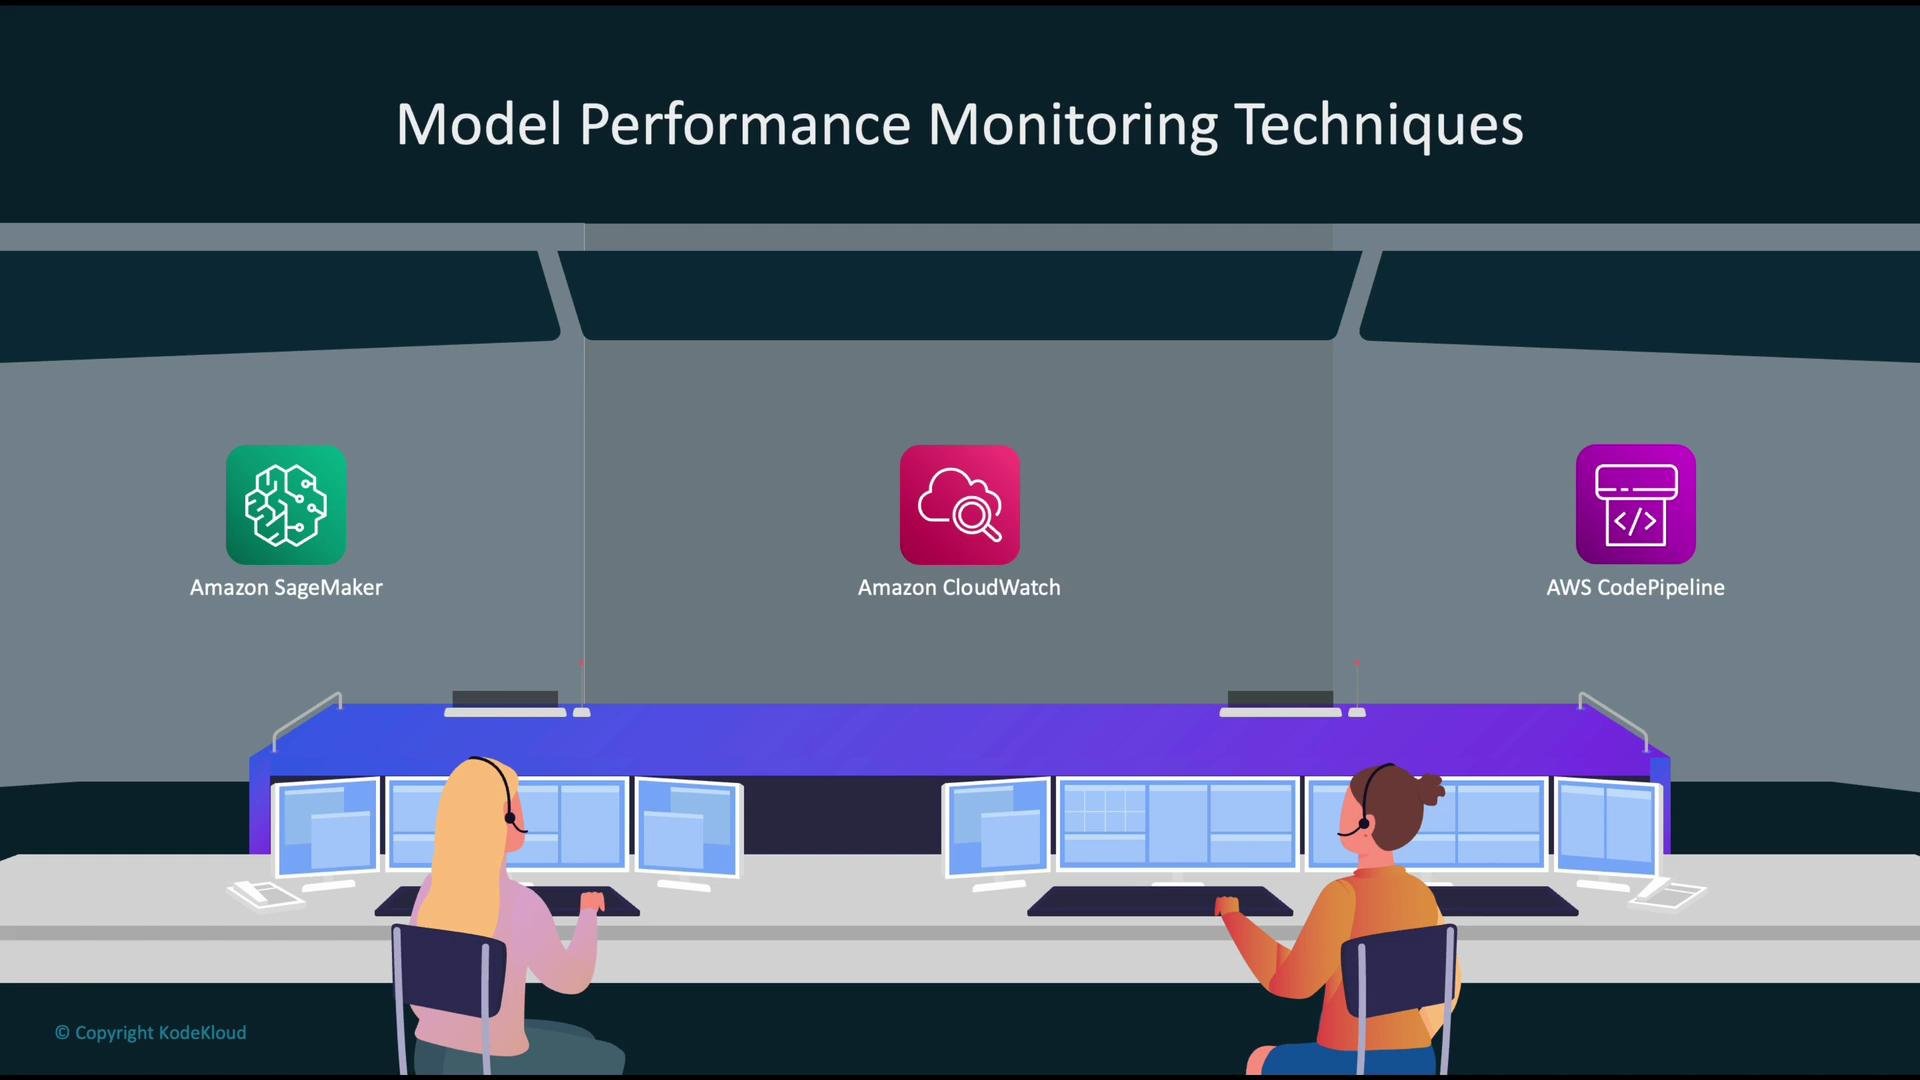
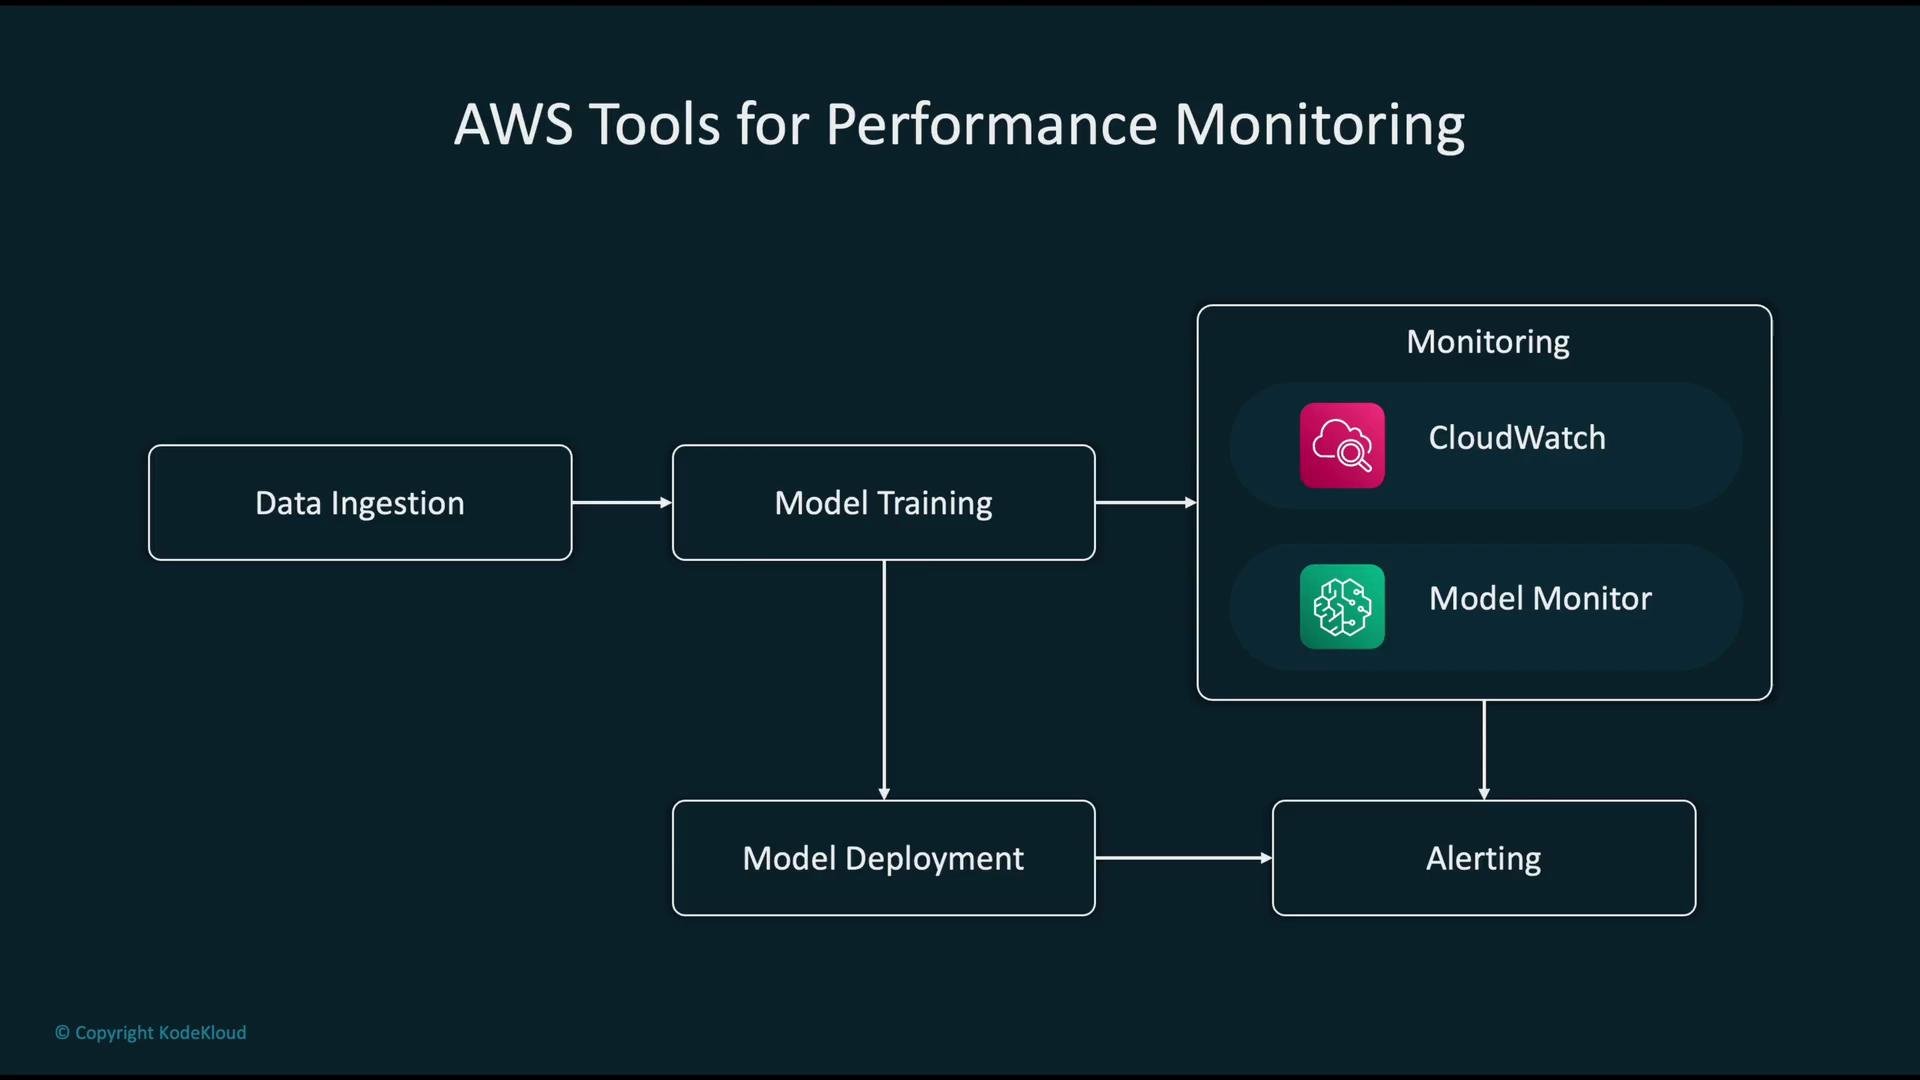
- Amazon SageMaker (Model Monitor) — model-specific monitoring (data drift, prediction drift, distribution changes).
- Amazon CloudWatch — centralized metrics, dashboards, logs, traces, and alarms.
- AWS CodePipeline and related DevOps services — automate retraining, testing, and redeployment as part of an MLOps workflow.
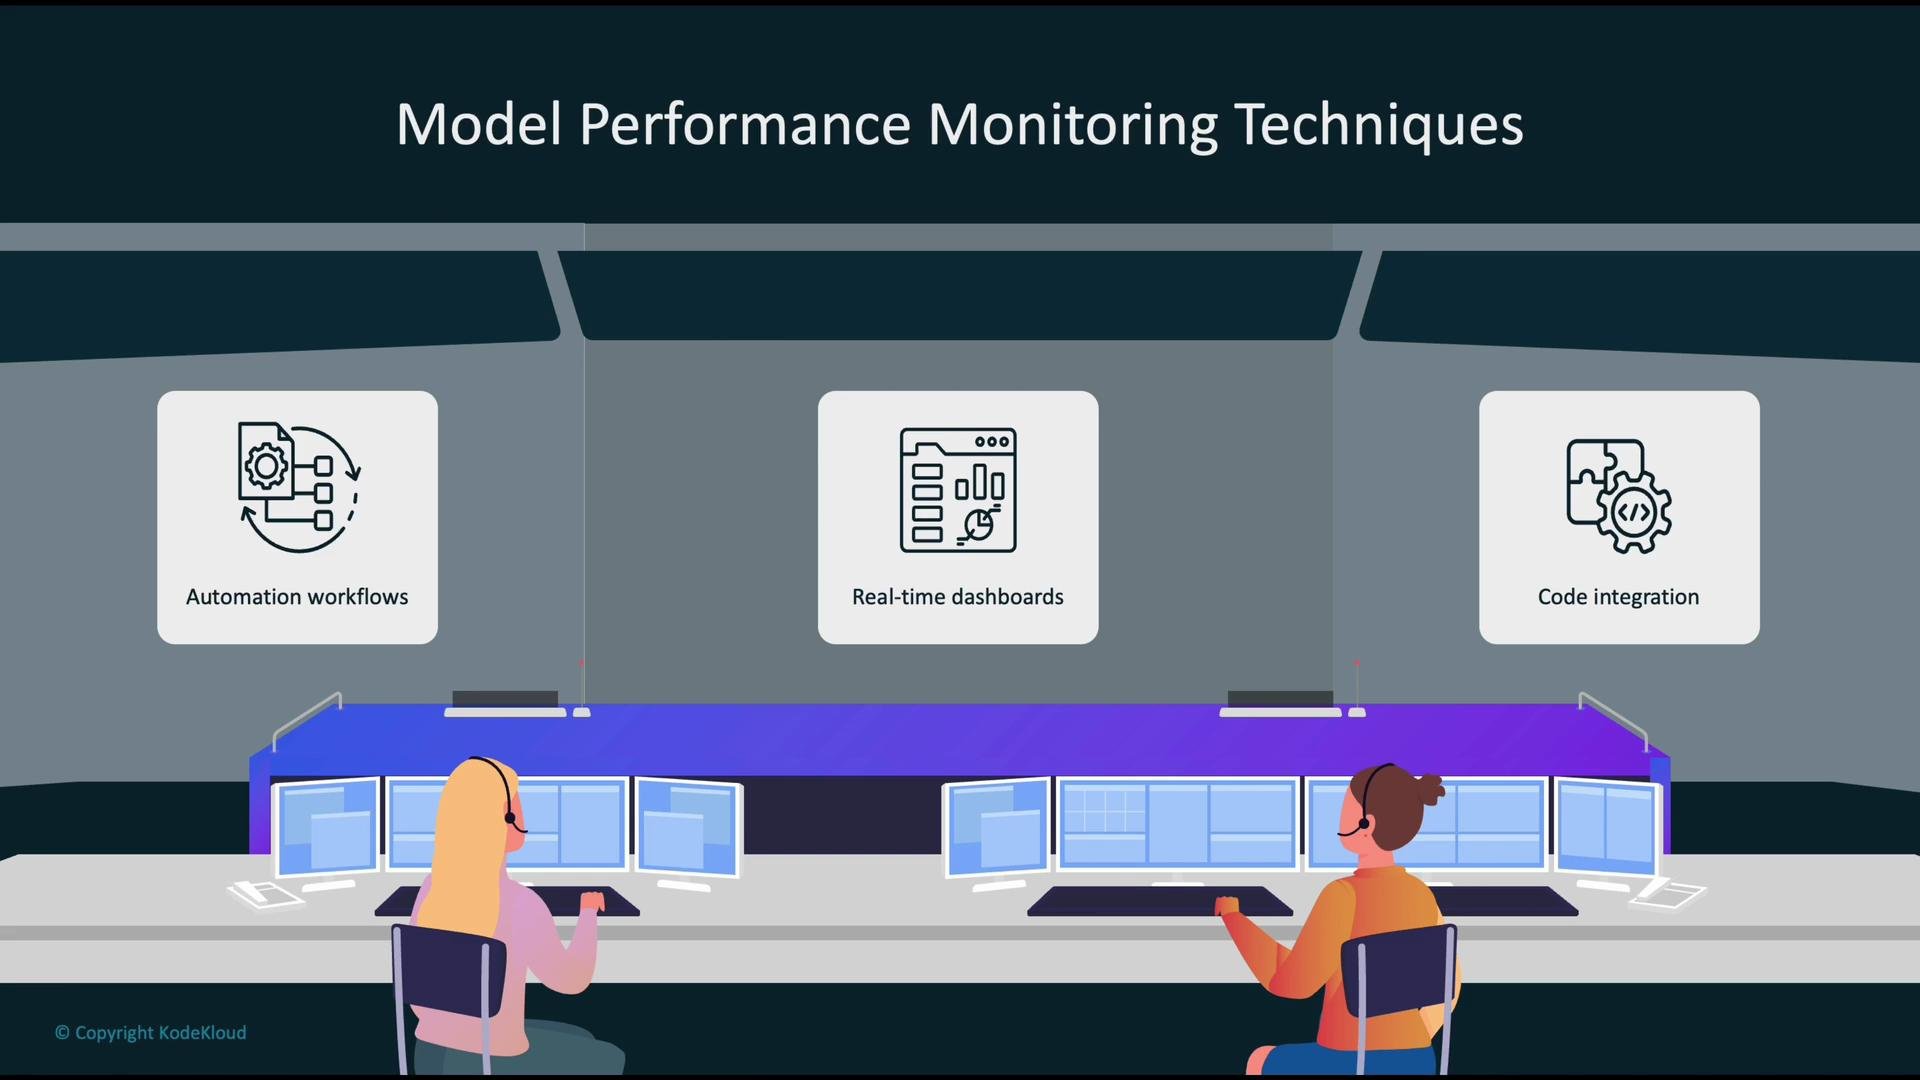
- Automation workflows that continuously evaluate model performance, raise alerts, and trigger retraining or rollback when needed.
- Real-time dashboards that display critical KPIs and health signals for rapid situational awareness.
- Code-level integration to collect fine-grained telemetry (inputs, predictions, latency) for diagnostics and root-cause analysis.
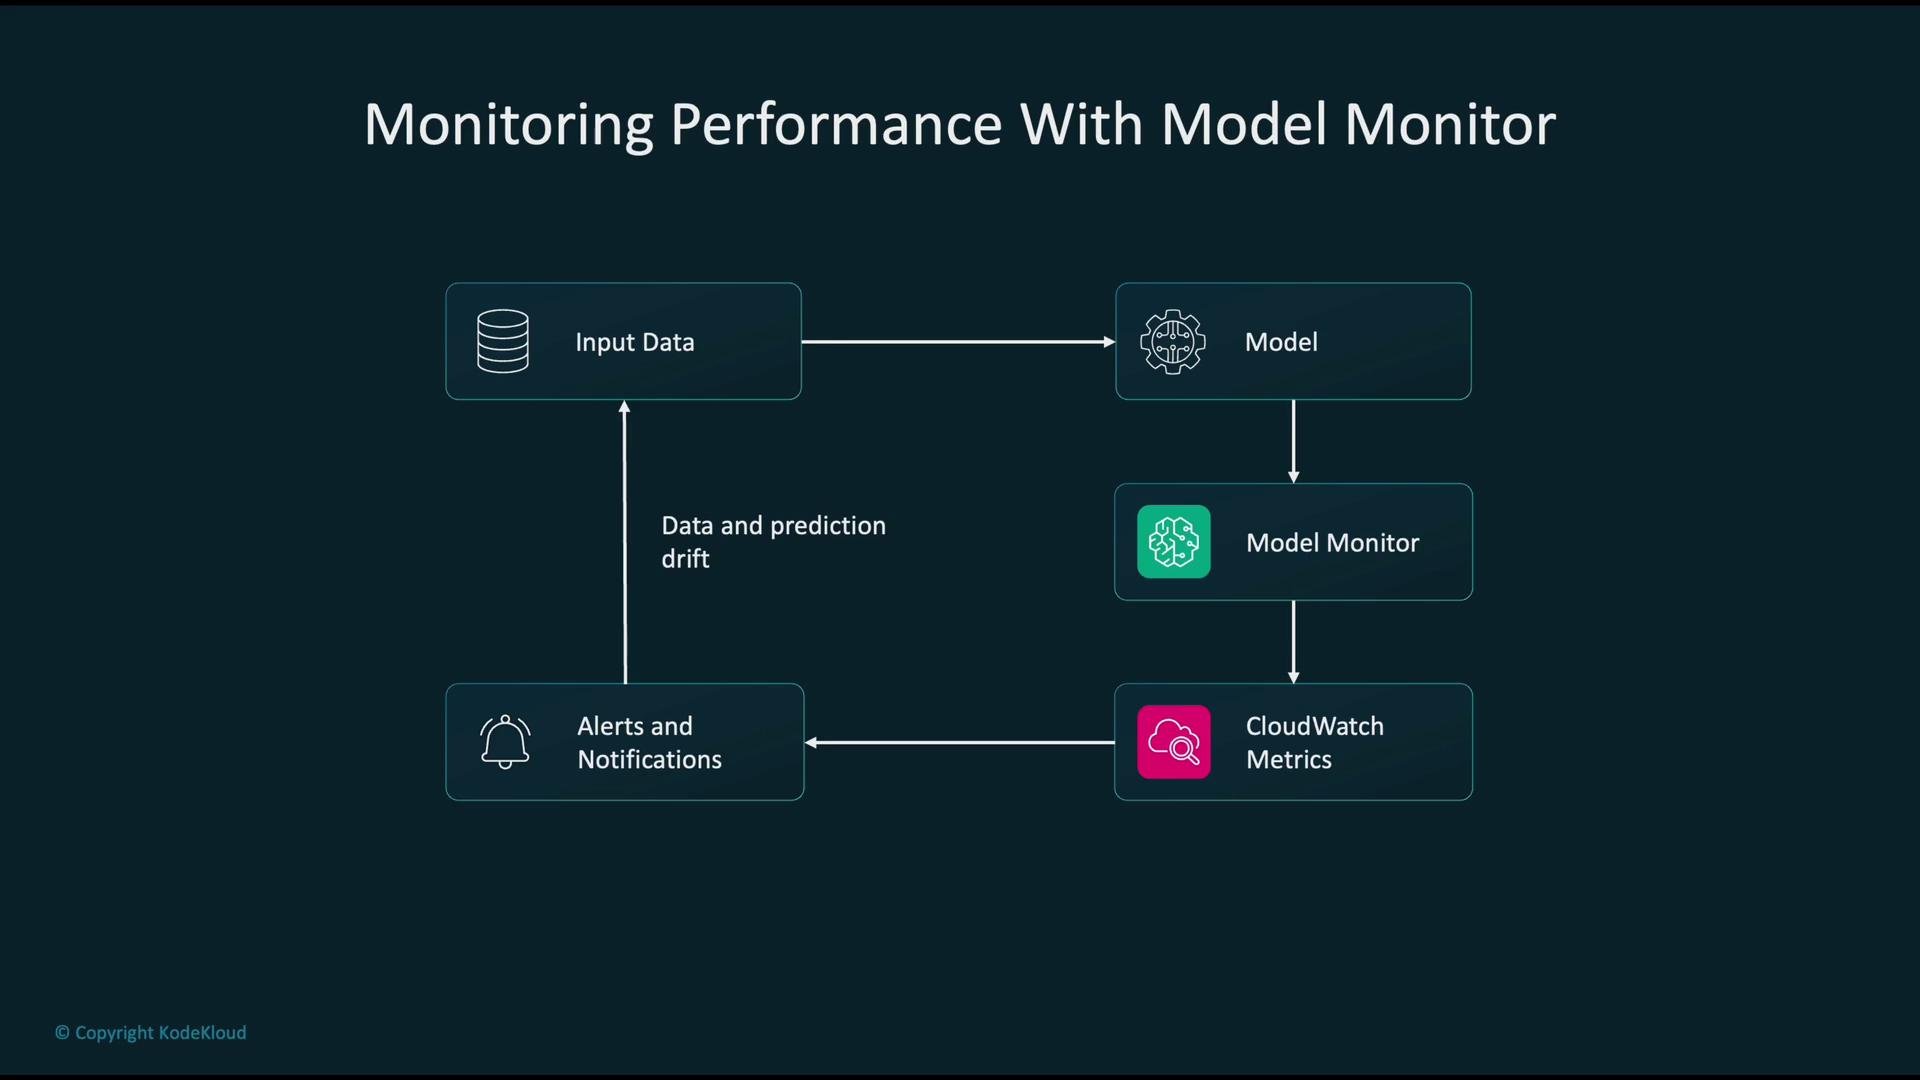
A typical ML lifecycle with monitoring integrated: data ingestion → model training → deployment → monitoring → alerting → (automated) retraining.
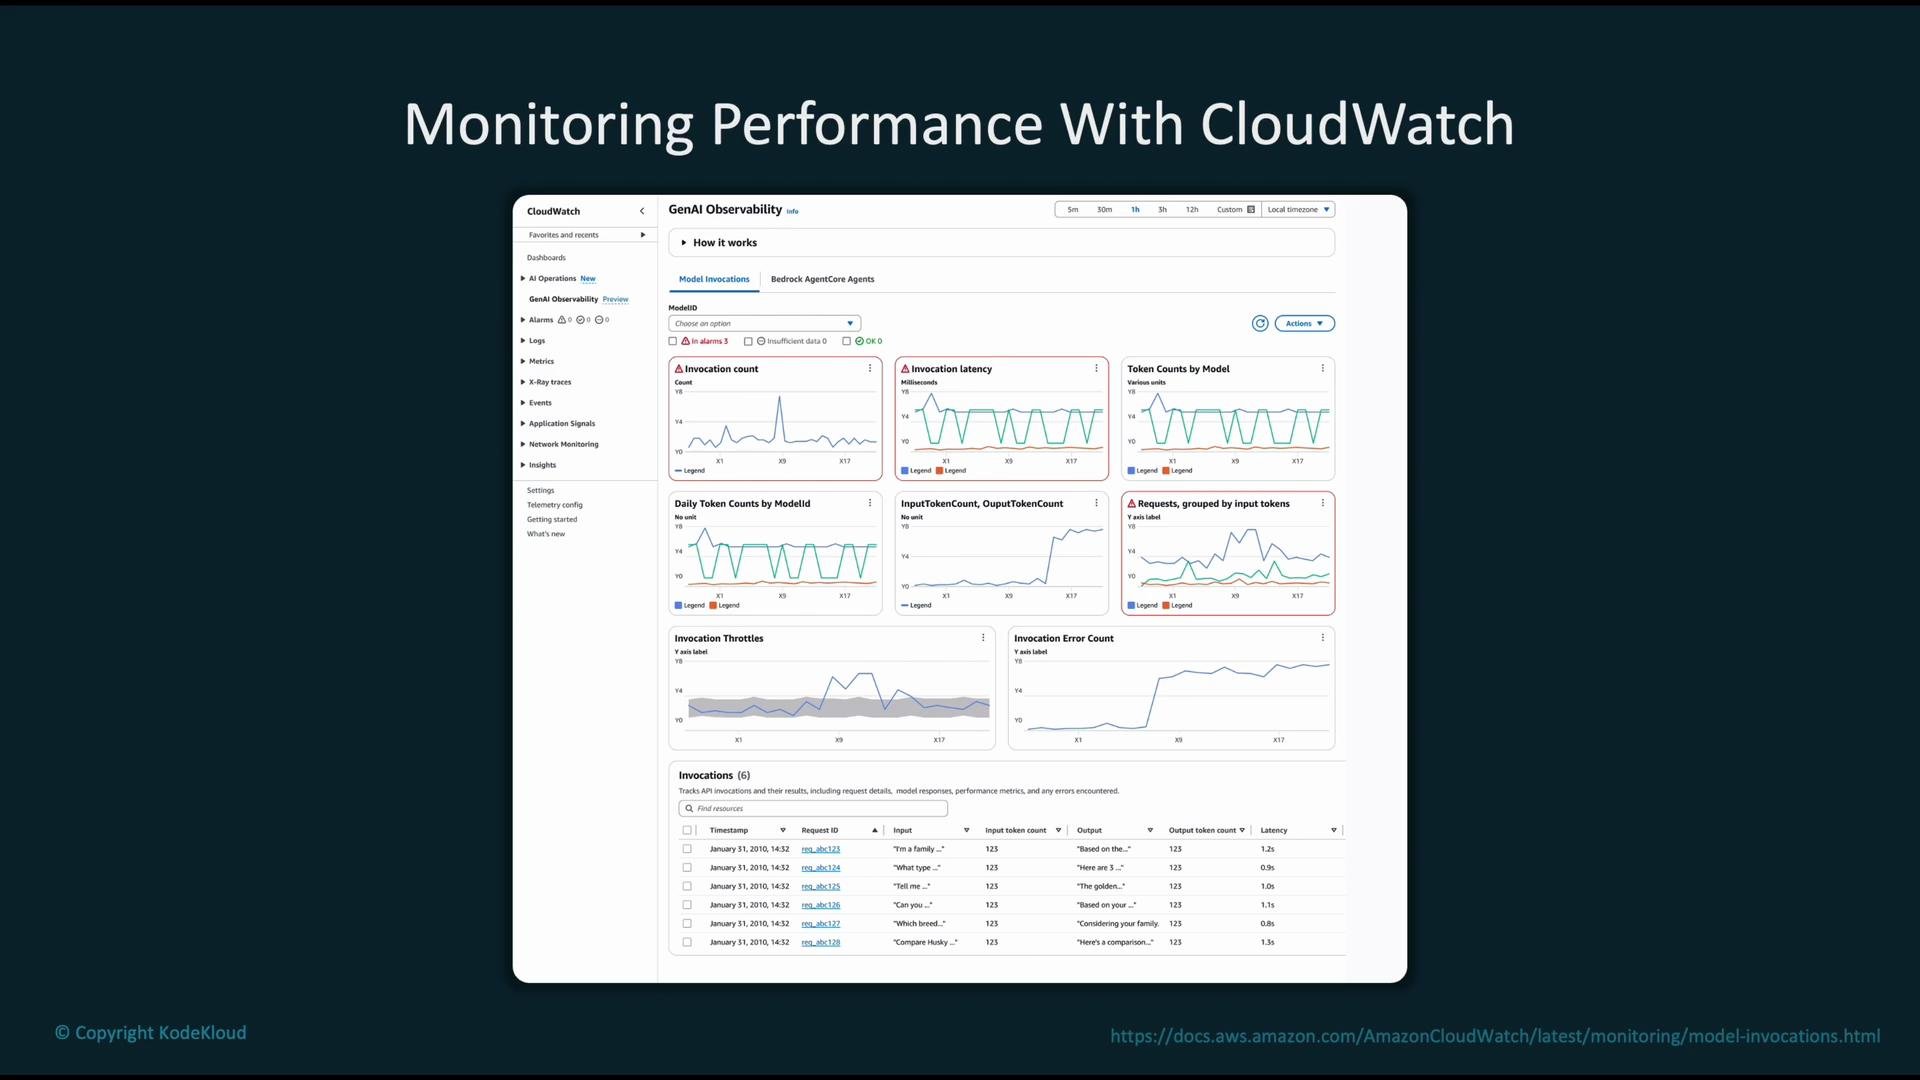
- Emit and collect performance metrics from SageMaker endpoints: invocation counts, latency (p50/p95/p99), success/error counts, and custom application metrics.
- Aggregate and visualize metrics on a centralized CloudWatch dashboard for operations and business stakeholders.
- Configure automated alarms and notifications to inform teams (SNS, Lambda, or ticketing integrations) when thresholds or anomaly patterns are observed.
- Drill into logs/traces (if enabled) to inspect individual API calls, inputs/outputs, stack traces, and latency breakdowns for root-cause analysis.
- Route a sample or all live input requests to a monitoring pipeline (via inference logging, event streaming, or scheduled capture).
- Continuously analyze input feature distributions and model outputs using SageMaker Model Monitor.
- Model Monitor can emit metrics and anomaly signals that are published to CloudWatch for centralized alerting and visualization.
- When drift or anomalies are detected, trigger automated investigation steps (snapshot data, notify teams, start drift analysis jobs) and, if configured, initiate retraining pipelines.
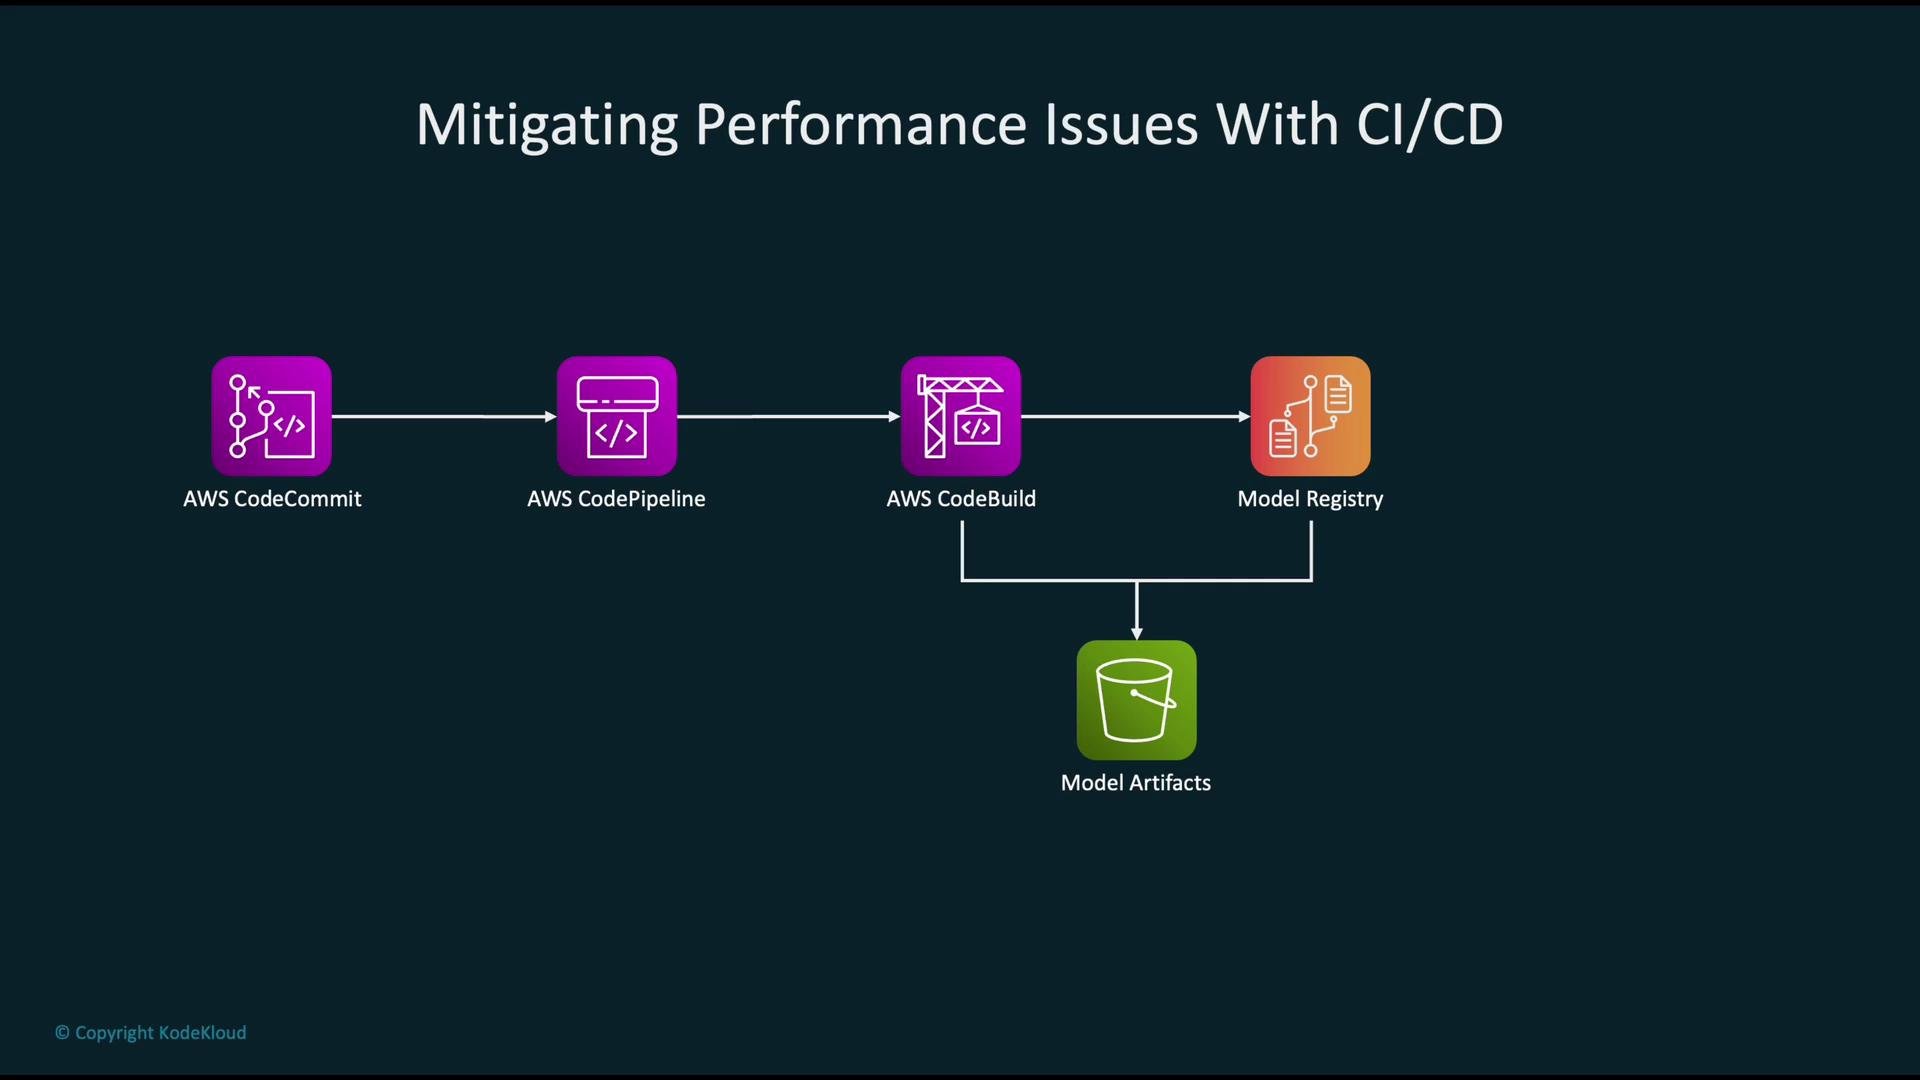
- Developer pushes code or model changes to a source repository (e.g., AWS CodeCommit or GitHub).
- A change triggers an AWS CodePipeline workflow.
- AWS CodeBuild or managed training jobs execute training/testing and produce model artifacts.
- Artifacts are versioned and stored (e.g., in
S3) and optionally registered in a SageMaker model registry. - Release pipelines promote models through stages (staging → canary → production) with automated tests, performance gates, and monitoring checks before full rollout.
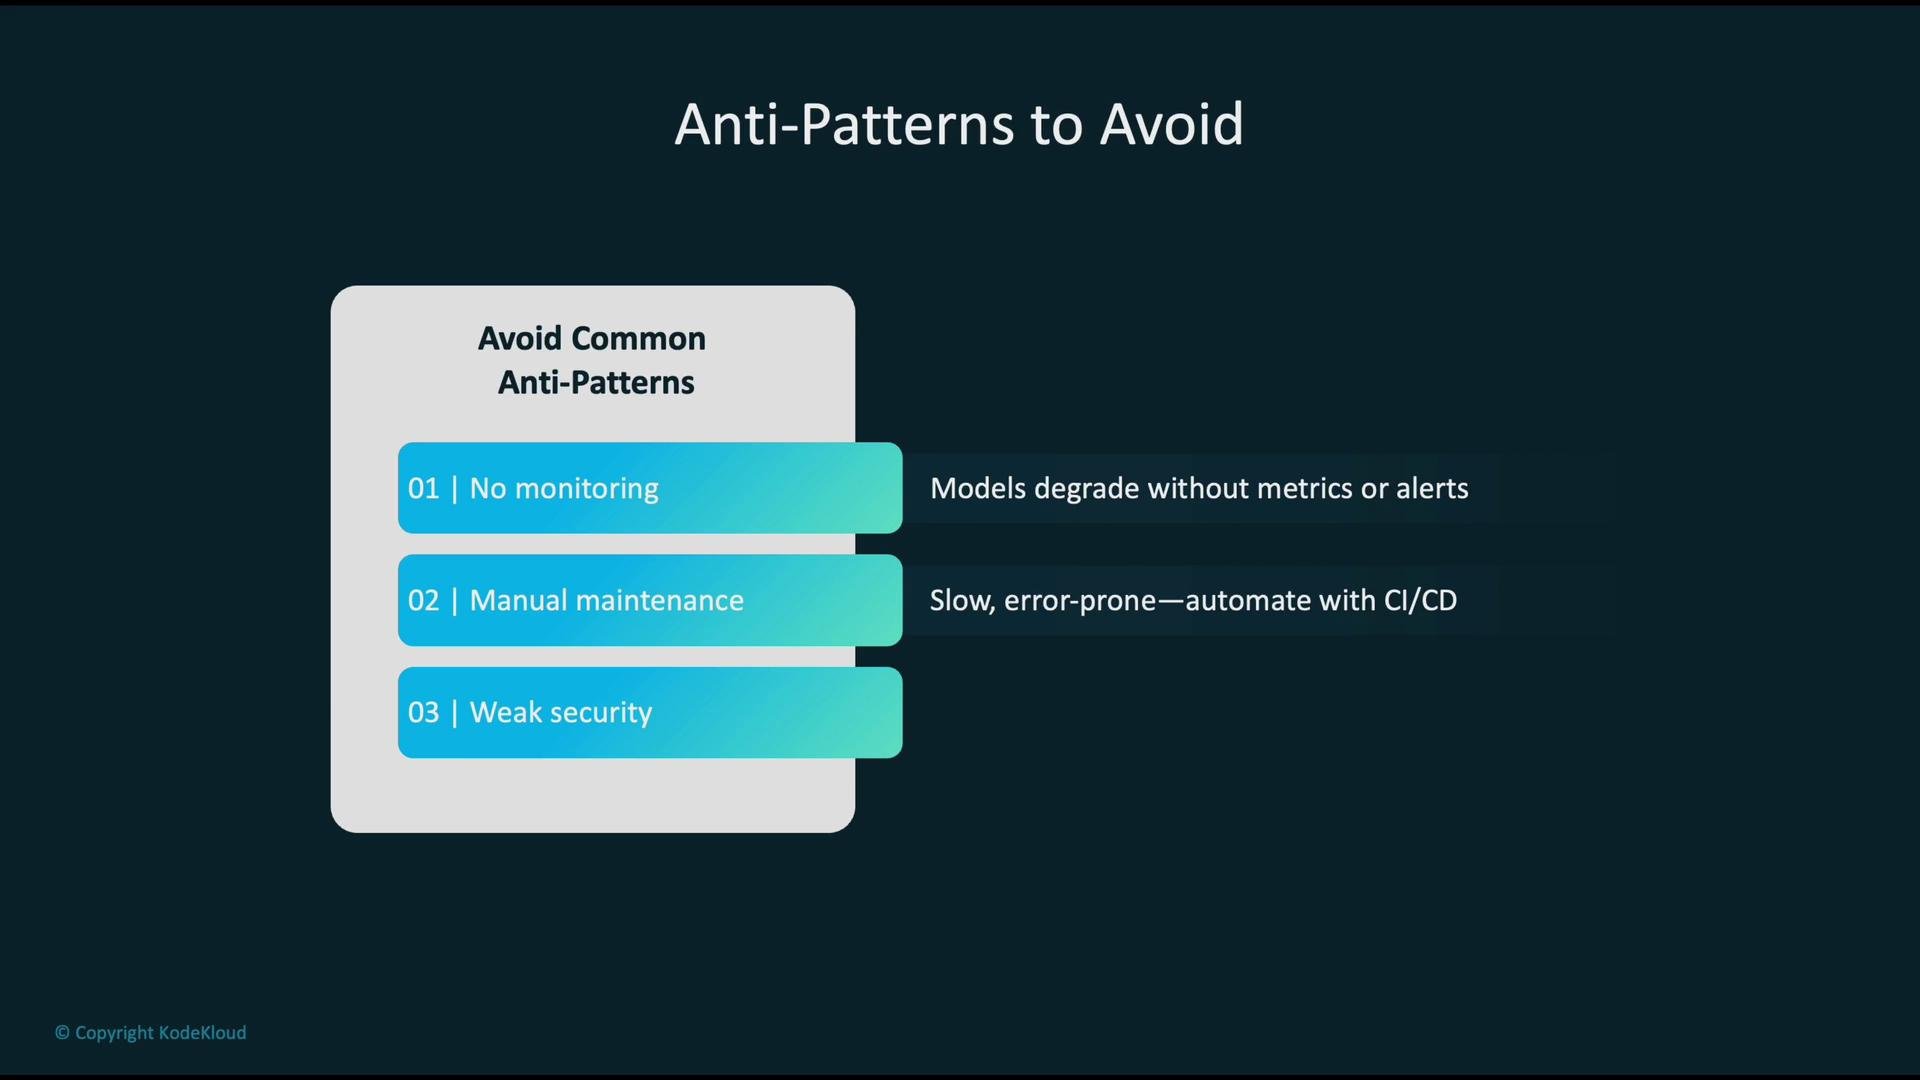
- No monitoring: models deployed without metrics or alerts will degrade silently.
- Manual maintenance: relying on human-driven retraining/deployment processes is slow and error-prone — automate with CI/CD.
- Weak security: insufficient access controls, missing encryption, or exposed networks increase risk of data leakage or tampering — use IAM, encryption at rest/in transit, and VPCs.
Avoid relying solely on human inspection. Automated, measurable monitoring with alerting and retraining automation is essential to maintain production model quality.
- Define clear performance metrics and SLAs (accuracy, precision/recall, latency percentiles, throughput, token usage, cost per inference).
- Establish baselines using validation data and initial production traffic to detect meaningful deviation.
- Instrument models at the code-level to capture essential telemetry (input schema, outputs, prediction probabilities/confidences, request metadata).
- Continuously monitor both system and model-level metrics to detect drift and degradation early.
- Configure alerting so the right teams are notified with actionable context (metric, threshold, recent trends, sample data).
- Automate retraining, evaluation, and promotion via CI/CD pipelines, and include monitoring gates in your release process.
- Secure the pipeline with least-privilege IAM roles, encrypted S3 buckets, and VPC endpoints for private network traffic.
Checklist: define metrics, set baselines, instrument models (Model Monitor + CloudWatch), automate CI/CD retraining and deployment, and secure the pipeline (IAM, encryption, VPCs).
- Amazon SageMaker Model Monitor documentation
- Amazon CloudWatch documentation
- SageMaker model registry overview
- CI/CD for machine learning on AWS (best practices)