

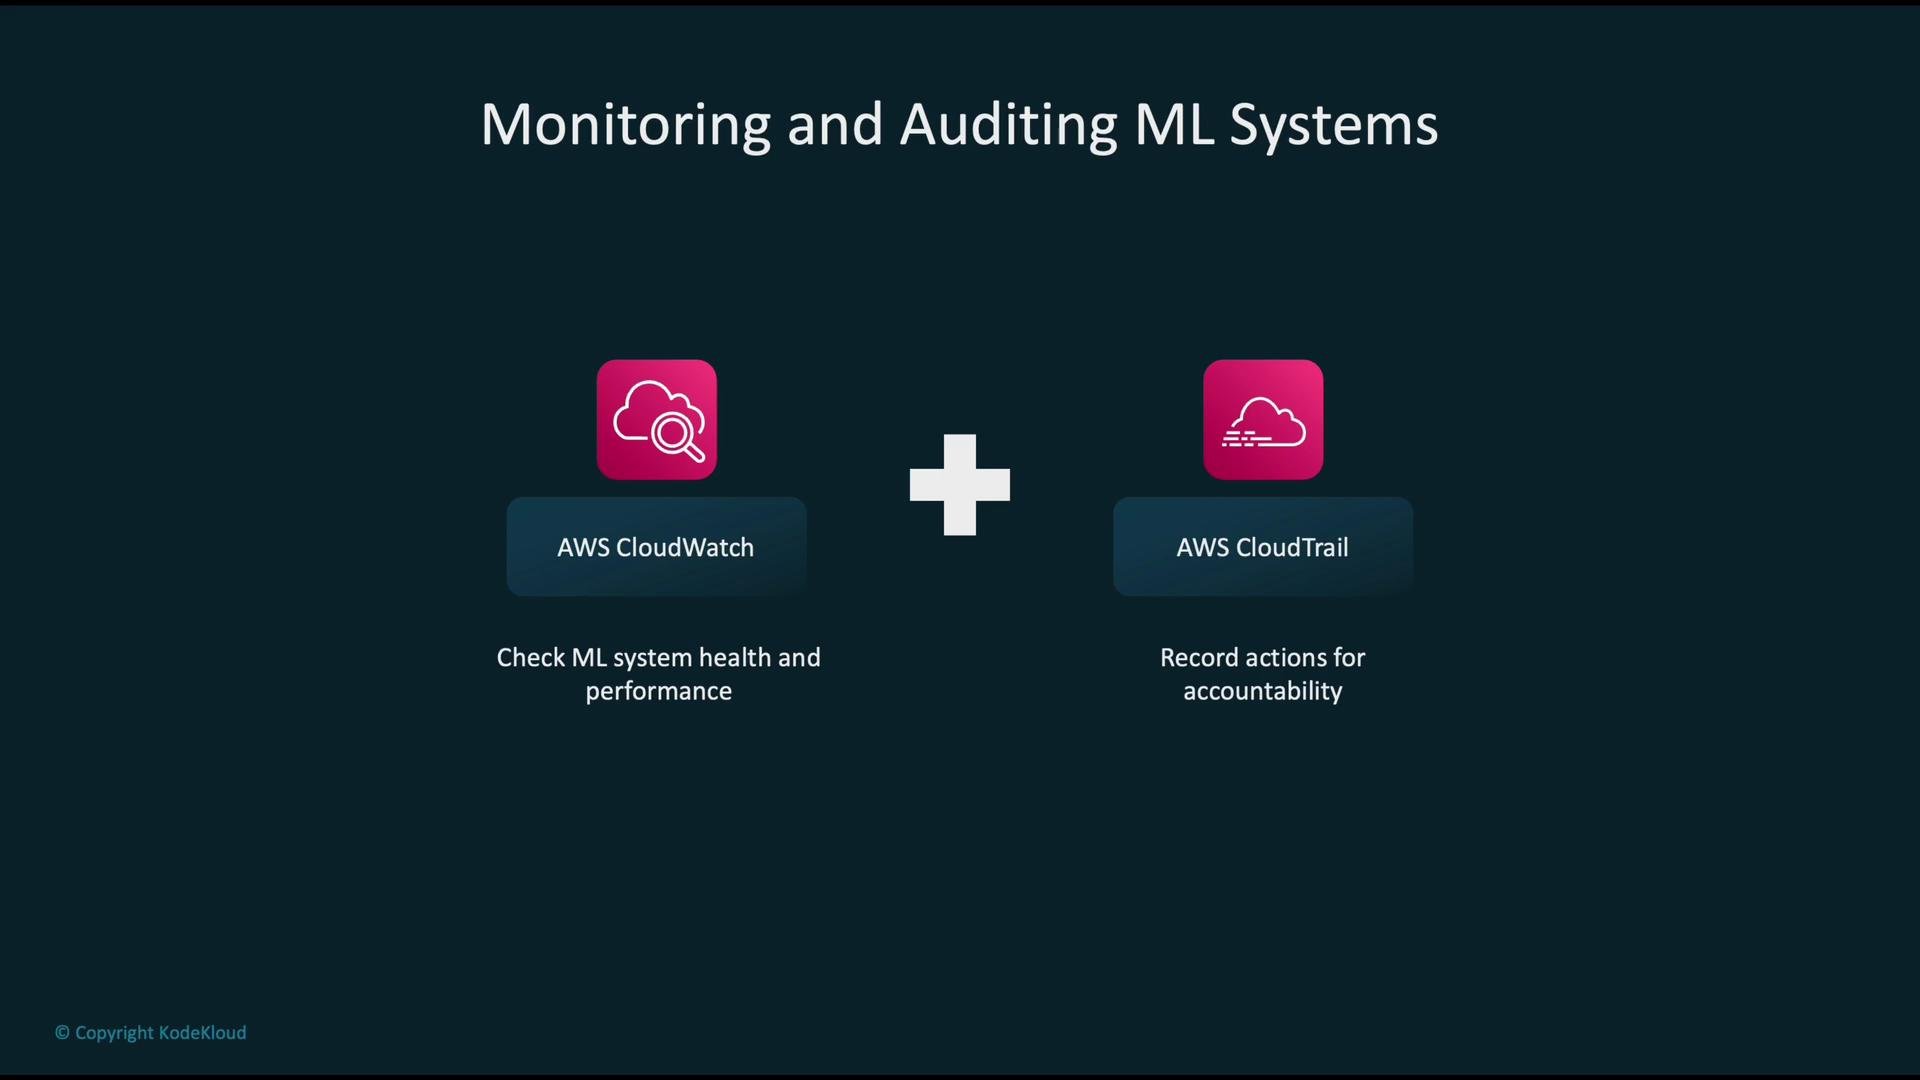
Monitoring gives you runtime visibility to detect and respond to issues quickly; auditing preserves a historical record required for investigations, governance, and compliance.
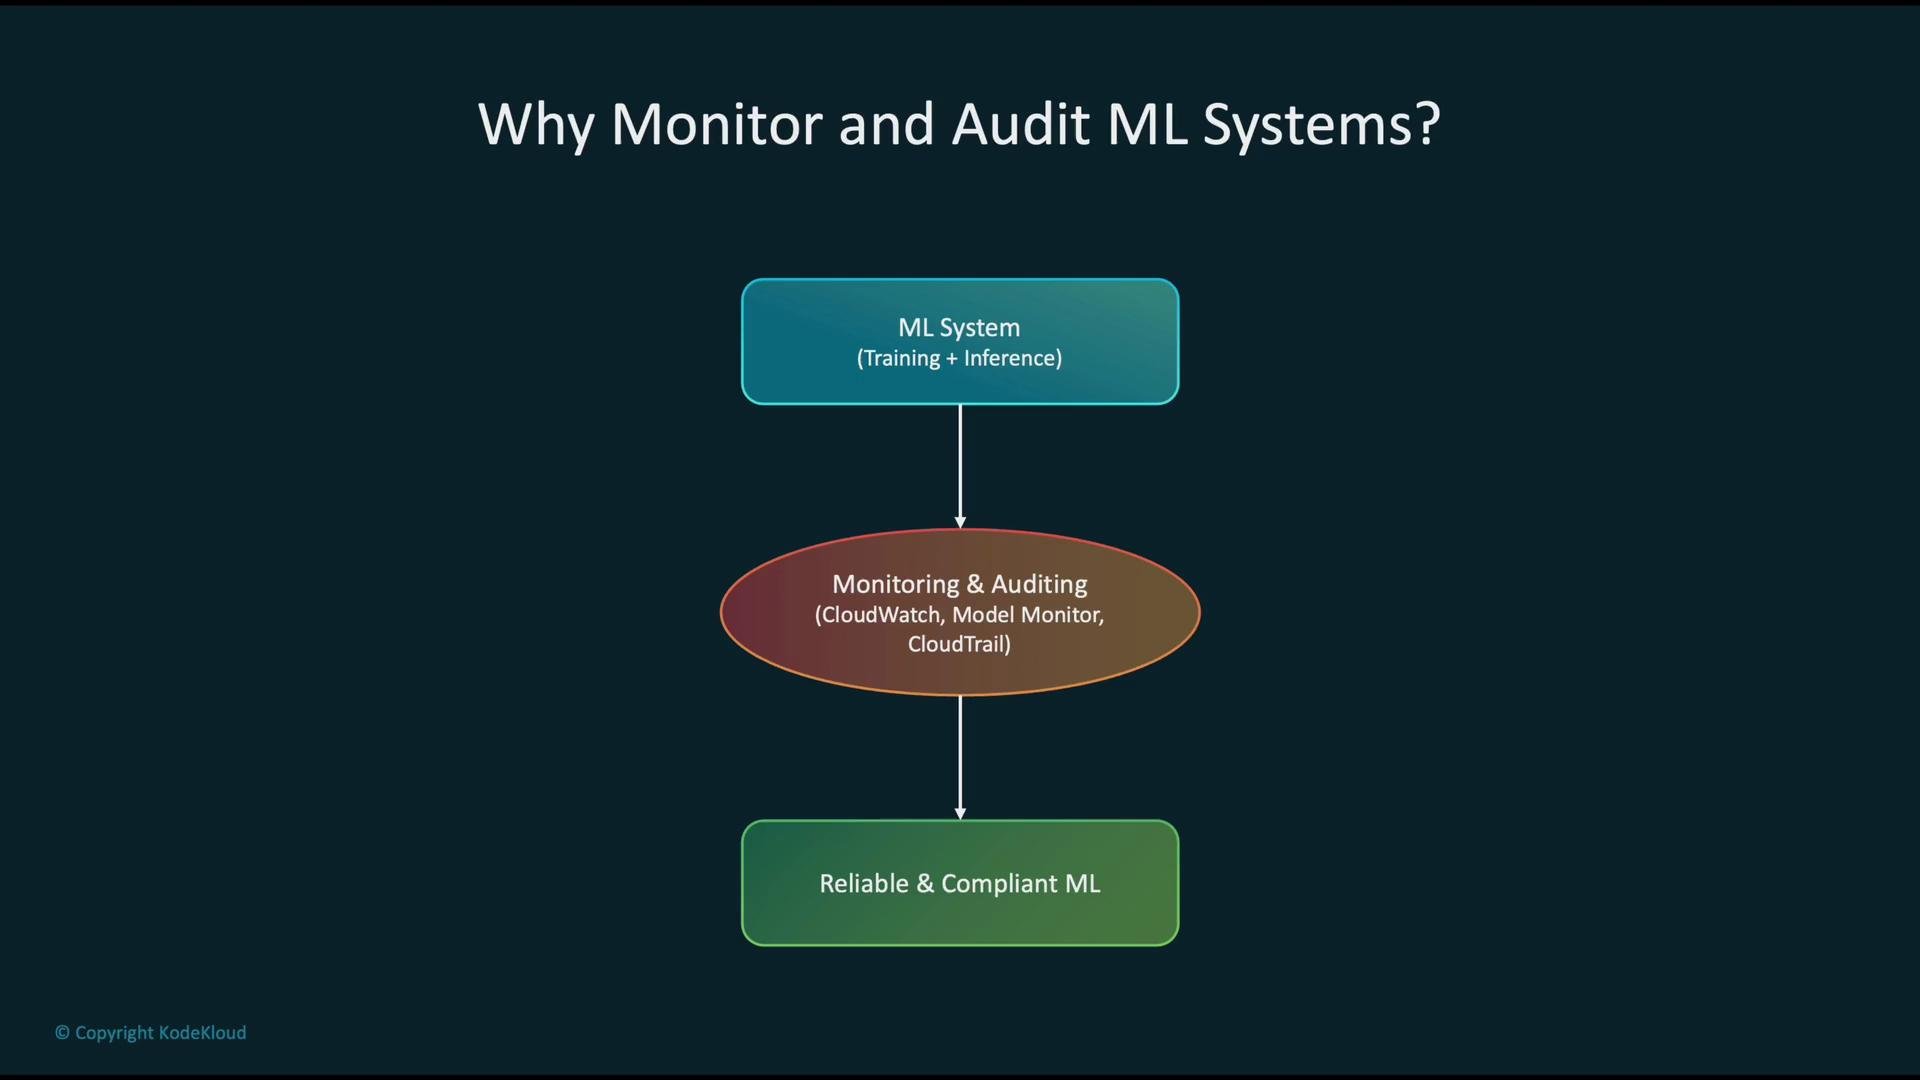
Why monitor and audit ML systems?
Consider the full ML lifecycle: training pipelines, model artifacts, and inference endpoints. Continuous monitoring and auditing enable you to:- Detect runtime issues (e.g., latency spikes, increased error rates).
- Detect data and concept drift that degrade model performance.
- Maintain a verifiable history of who did what and when for compliance, debugging, and reproducibility.
- Automate incident workflows to reduce mean time to detection and recovery.
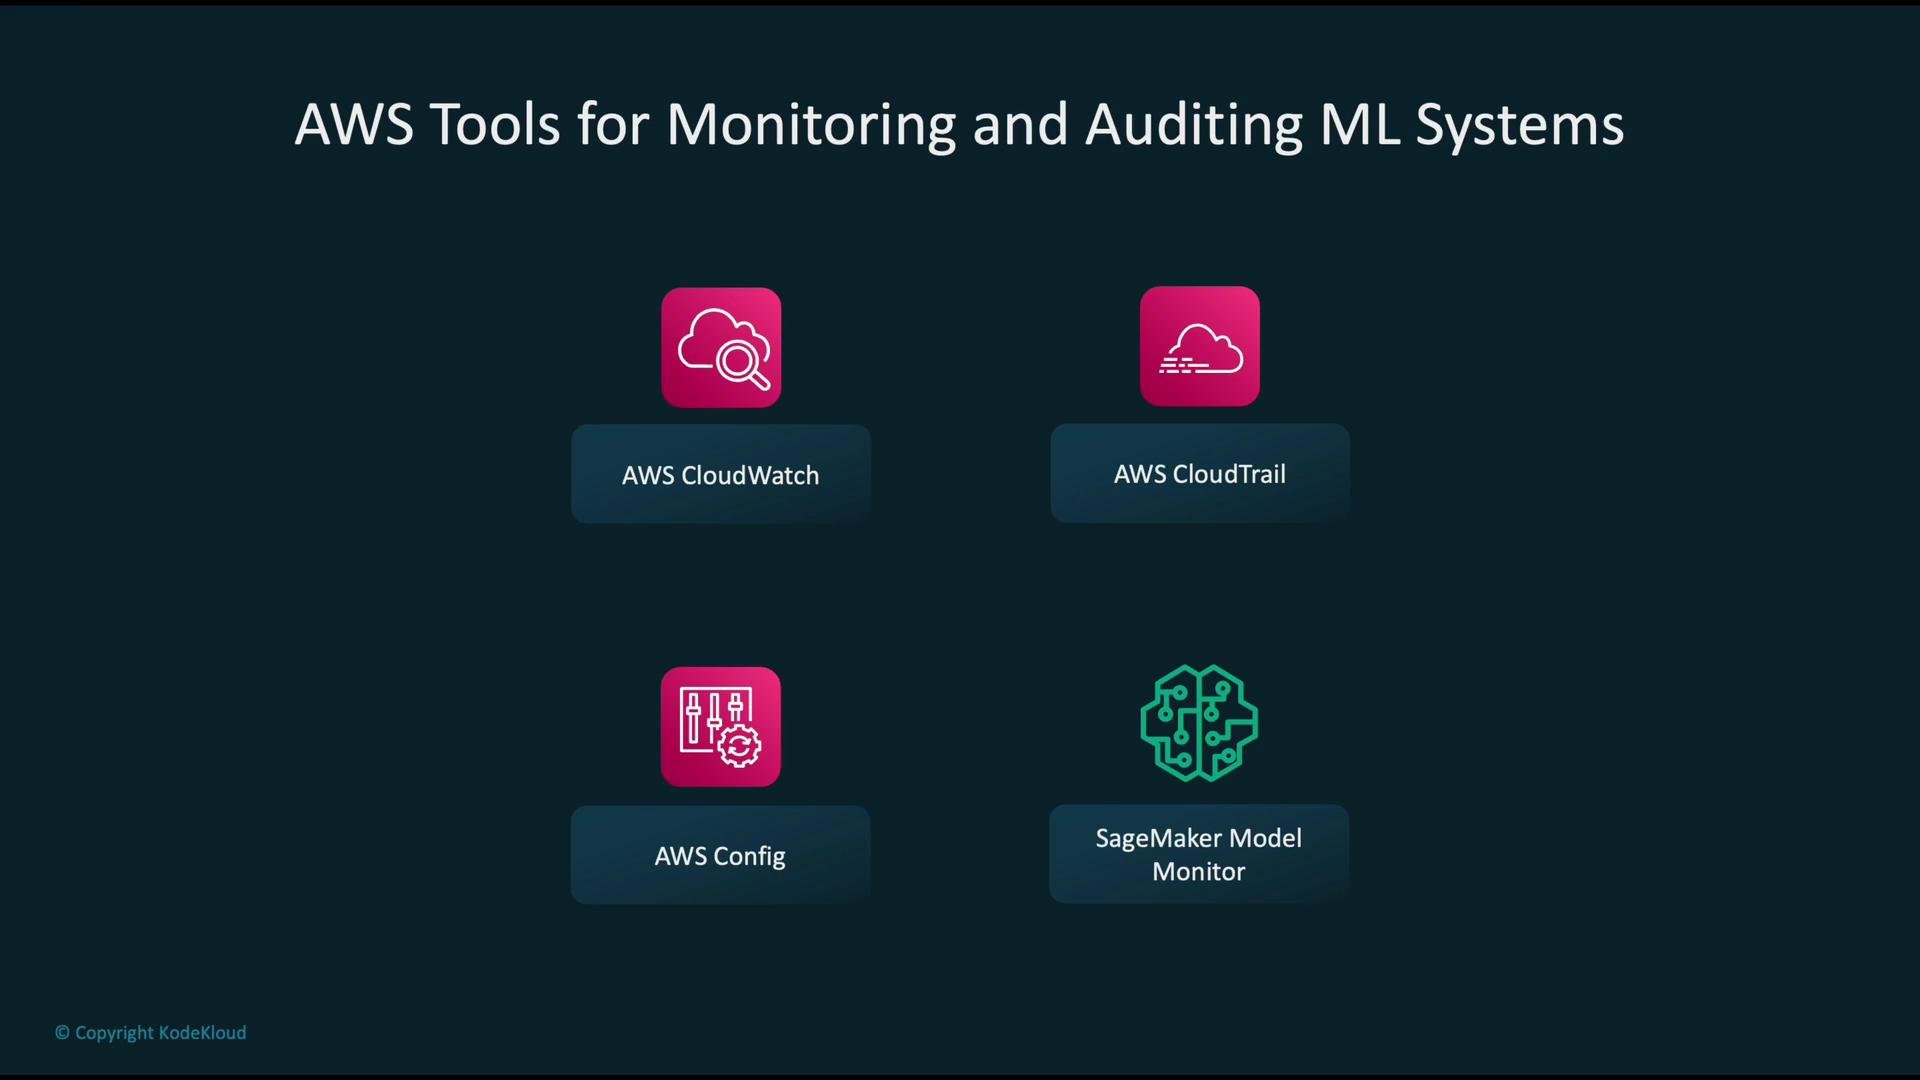
Key AWS services and their roles
Monitoring with CloudWatch (runtime telemetry)
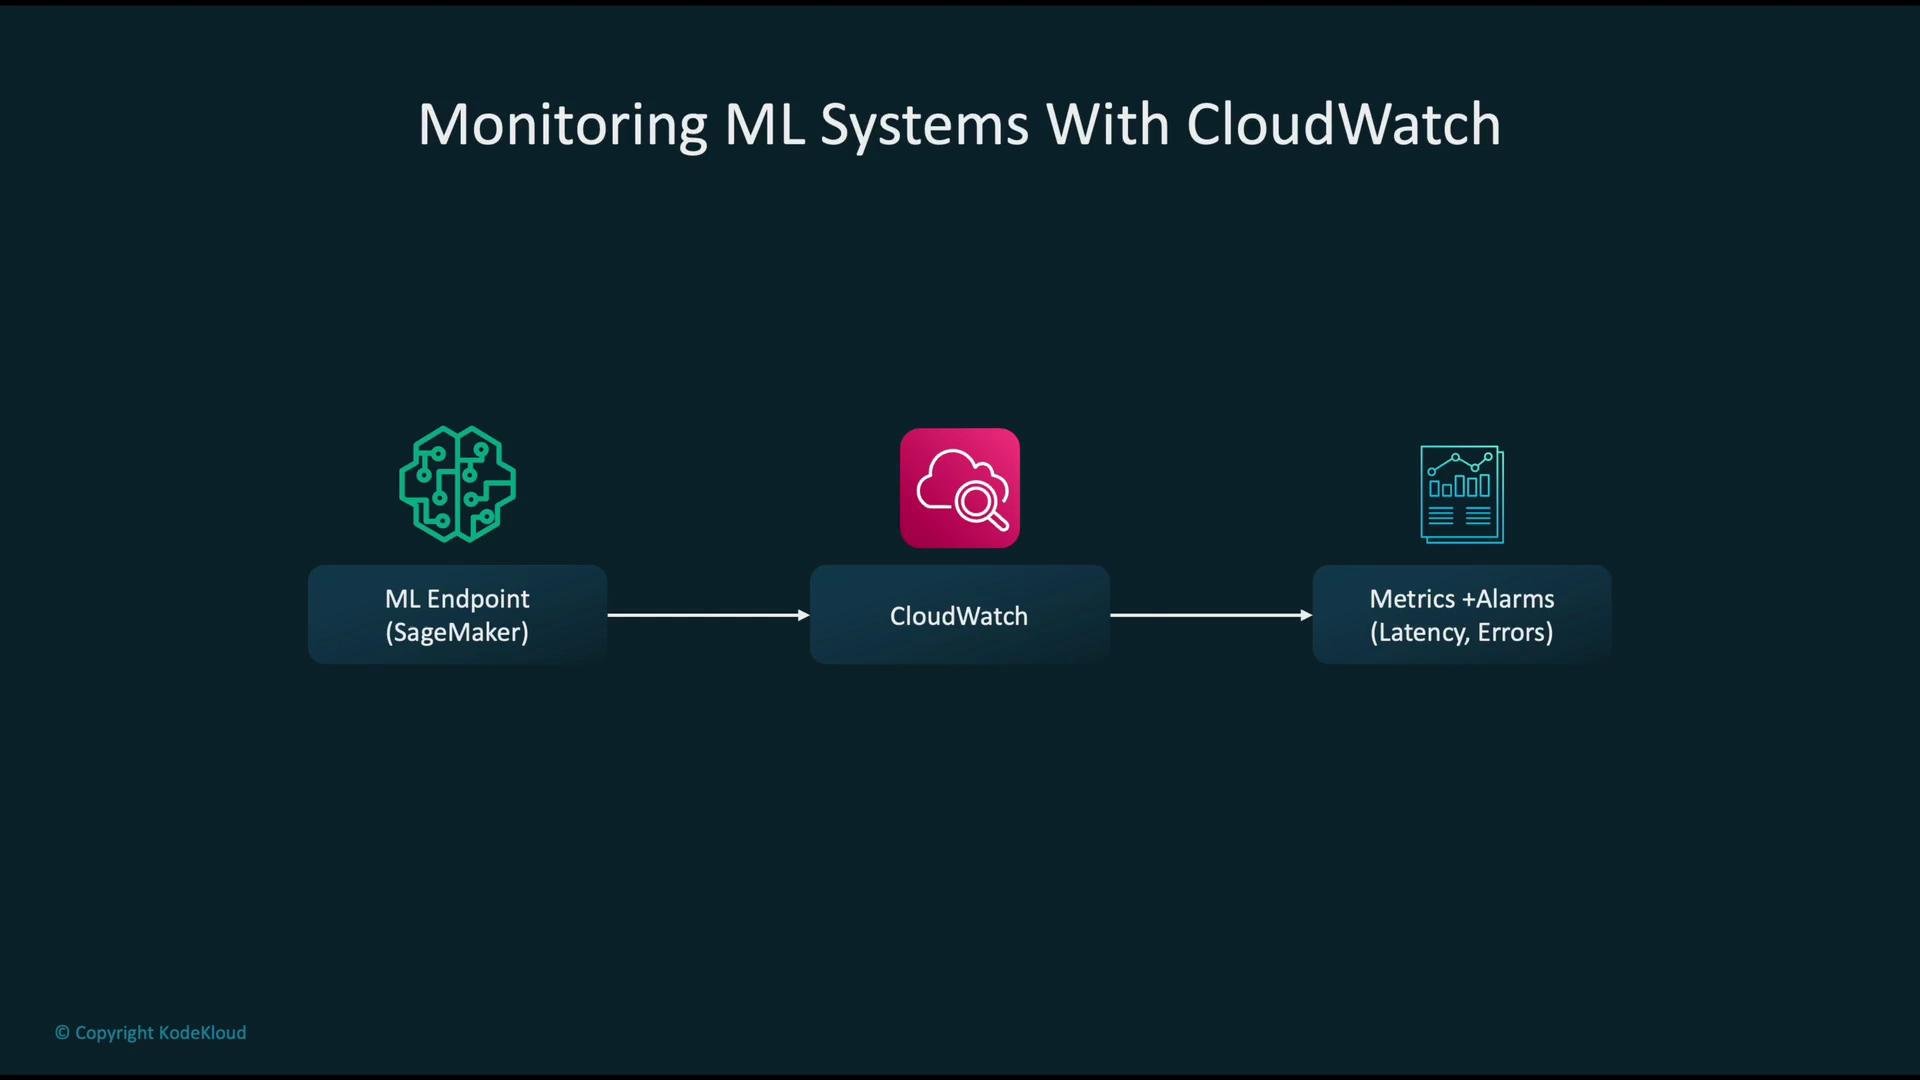
A typical runtime monitoring flow:- Your ML endpoint (for example, a SageMaker endpoint) emits metrics—latency, request counts, error counts—and streams logs.
- CloudWatch ingests those metrics and logs.
- You define alarms (threshold or anomaly-based), dashboards, and automated responses using EventBridge and Lambda to handle incidents.
When an alarm fires, route it to an incident playbook: create a ticket, trigger auto-scaling, block suspicious traffic, or route captured data to a drift analysis pipeline.
Detecting data drift with SageMaker Model Monitor
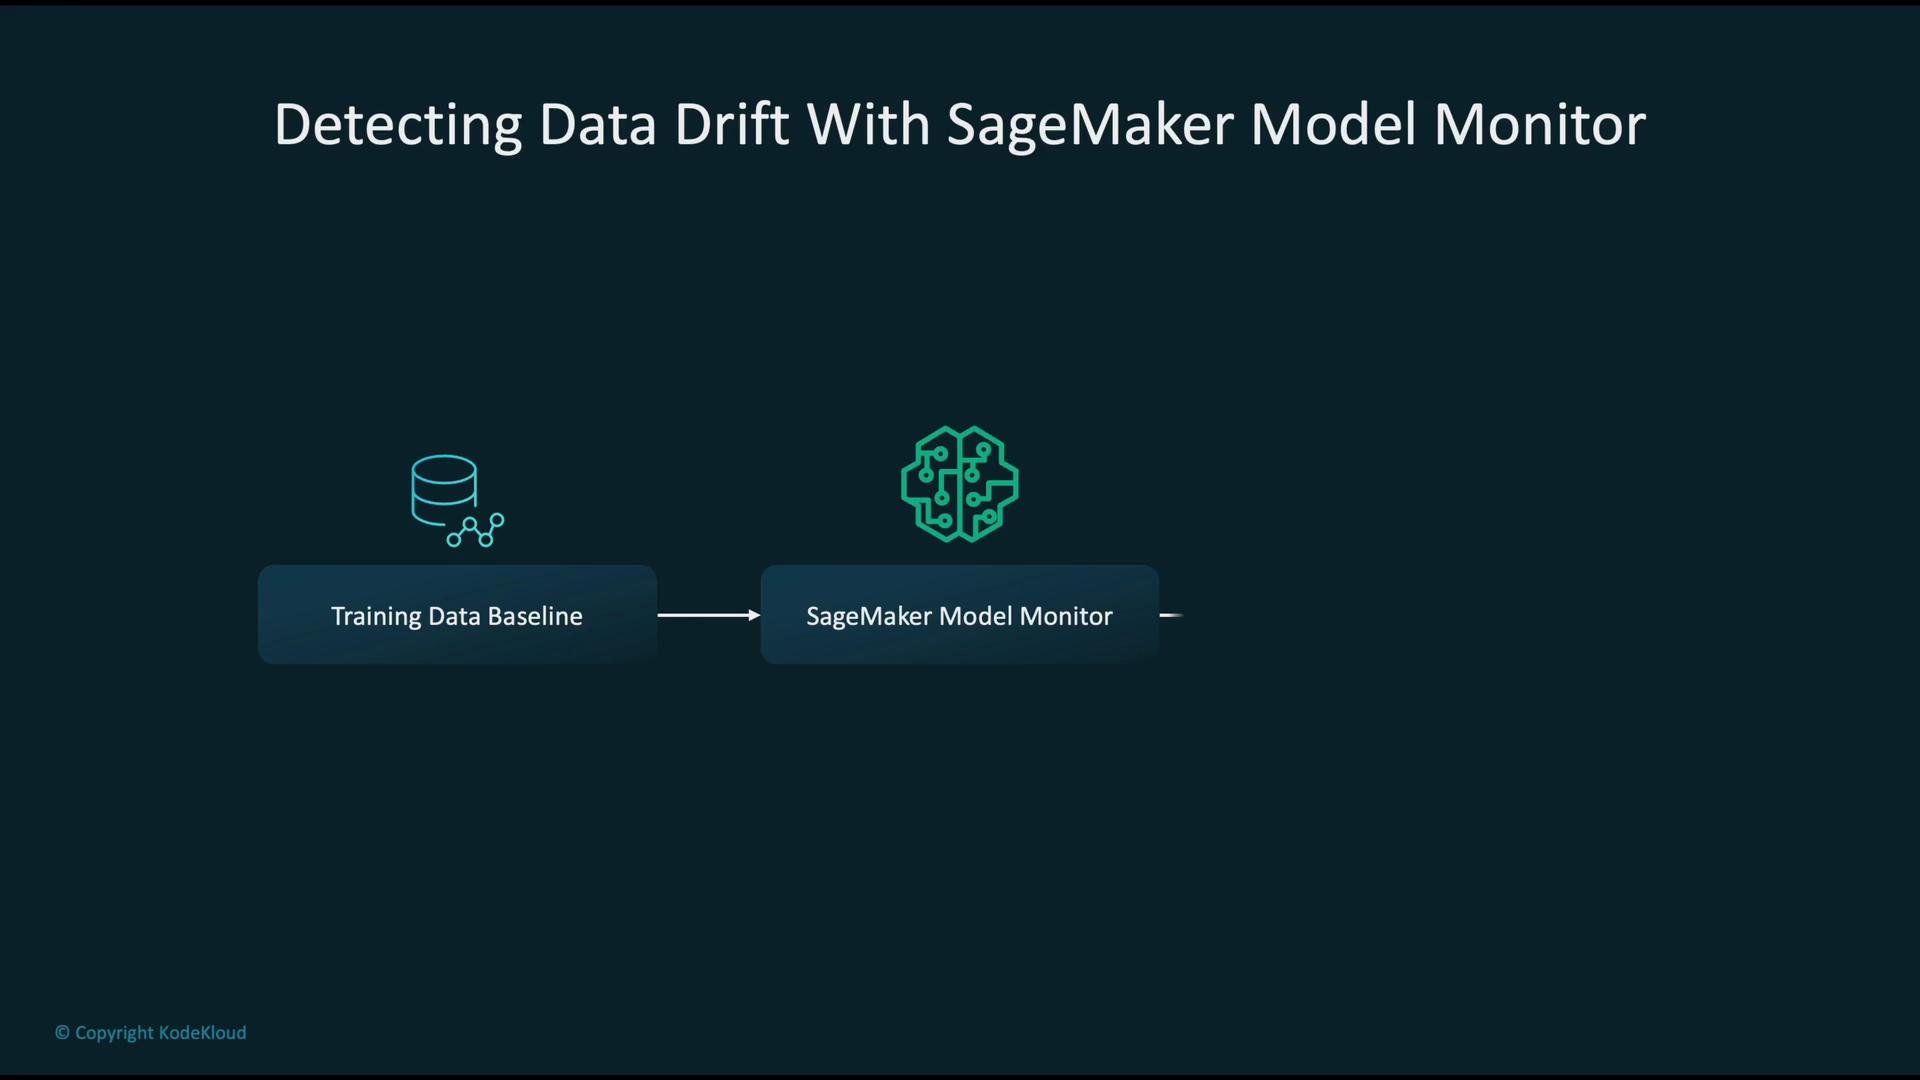
SageMaker Model Monitor helps you detect changes in input feature distributions and schema deviations by comparing production inference data to a baseline derived from training data. Typical implementation steps:- Create a baseline from training data (or a validated representative sample).
- Enable data capture on the endpoint or configure scheduled batch captures.
- Configure Model Monitor jobs and alerts for distribution drift, missing values, and schema mismatches.
- Feed Model Monitor reports and metrics into CloudWatch and your incident pipeline.
- Investigate drift: decide whether to retrain, rollback, or correct upstream data issues.
Auditing with CloudTrail
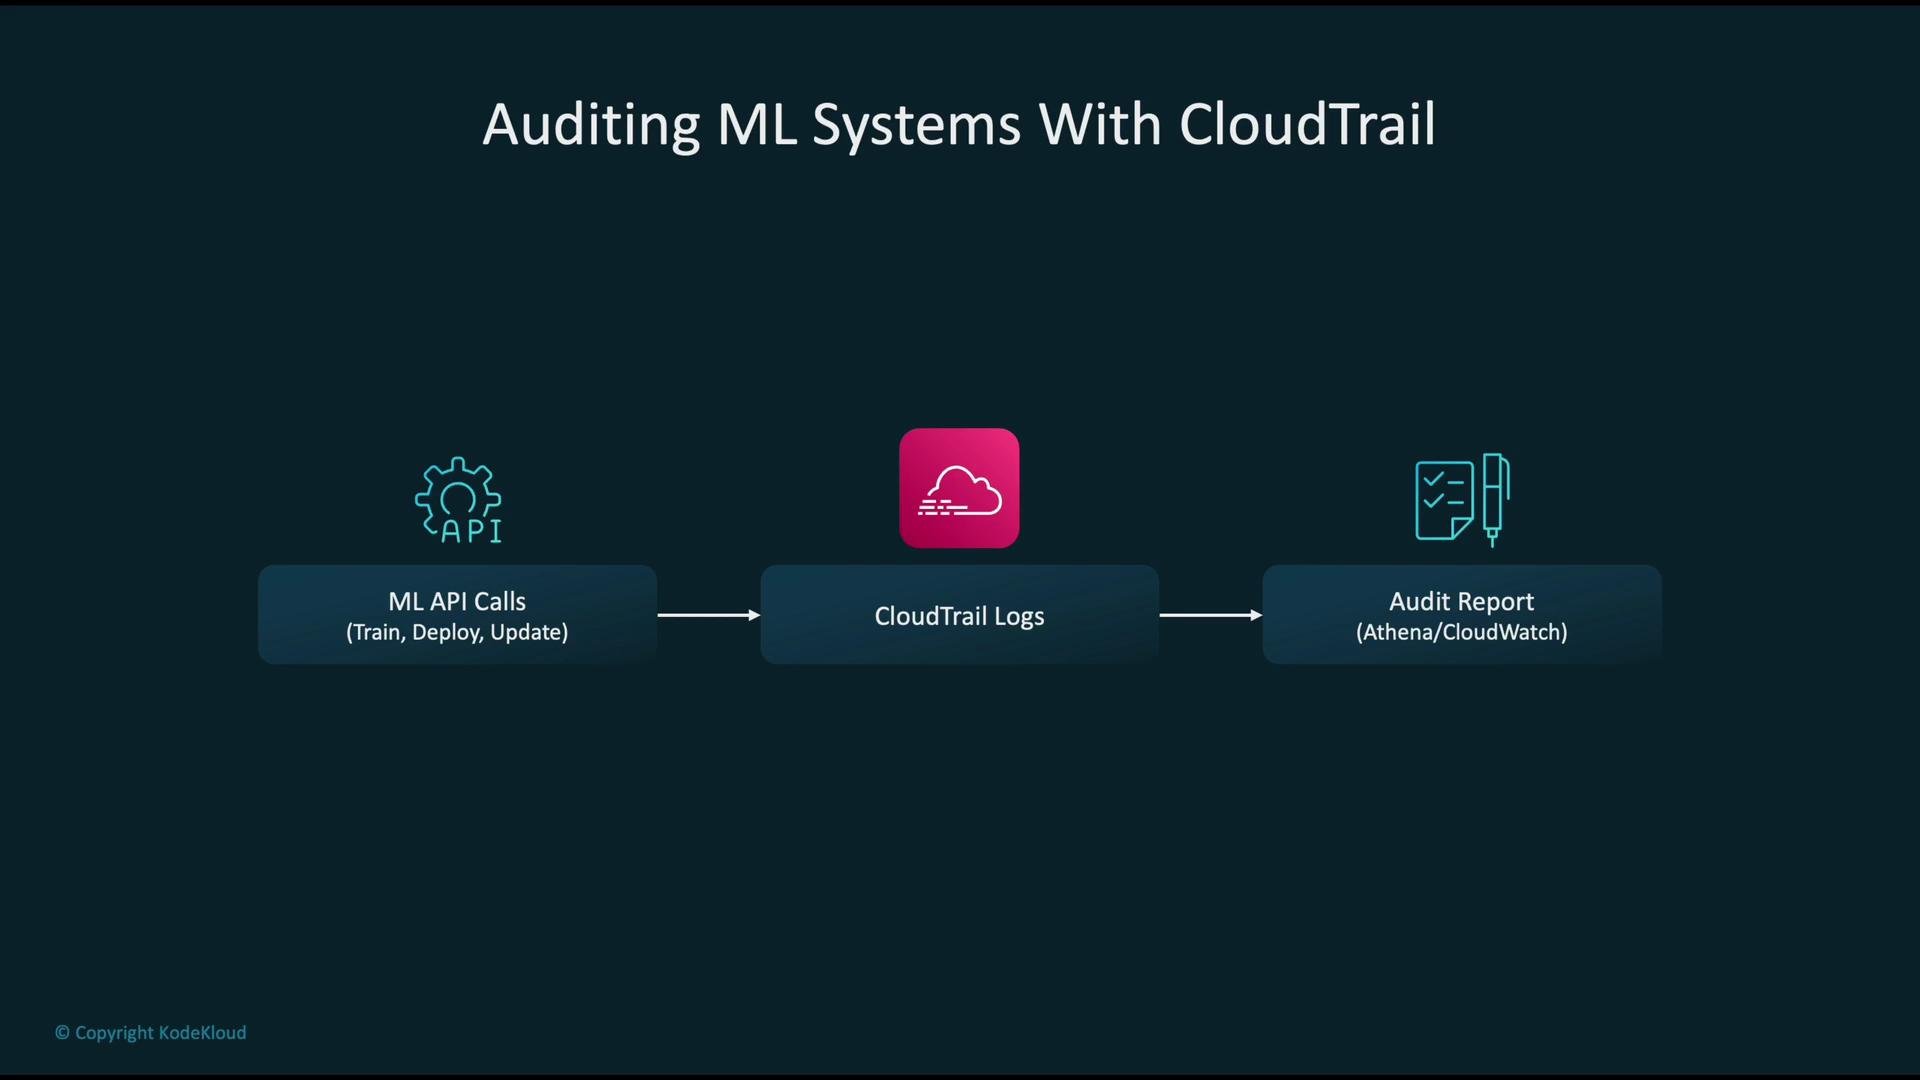
CloudTrail records API activity (management and data-plane) and stores events in an S3 bucket (optionally encrypted). Those logs are searchable and analyzable with Athena, CloudWatch Logs Insights, or a SIEM. Common audit use cases:- Identify who deployed or updated a model artifact and when.
- Determine which principal invoked an endpoint at a specific time.
- Track changes to IAM policies and who authorized them.
Security and compliance best practices
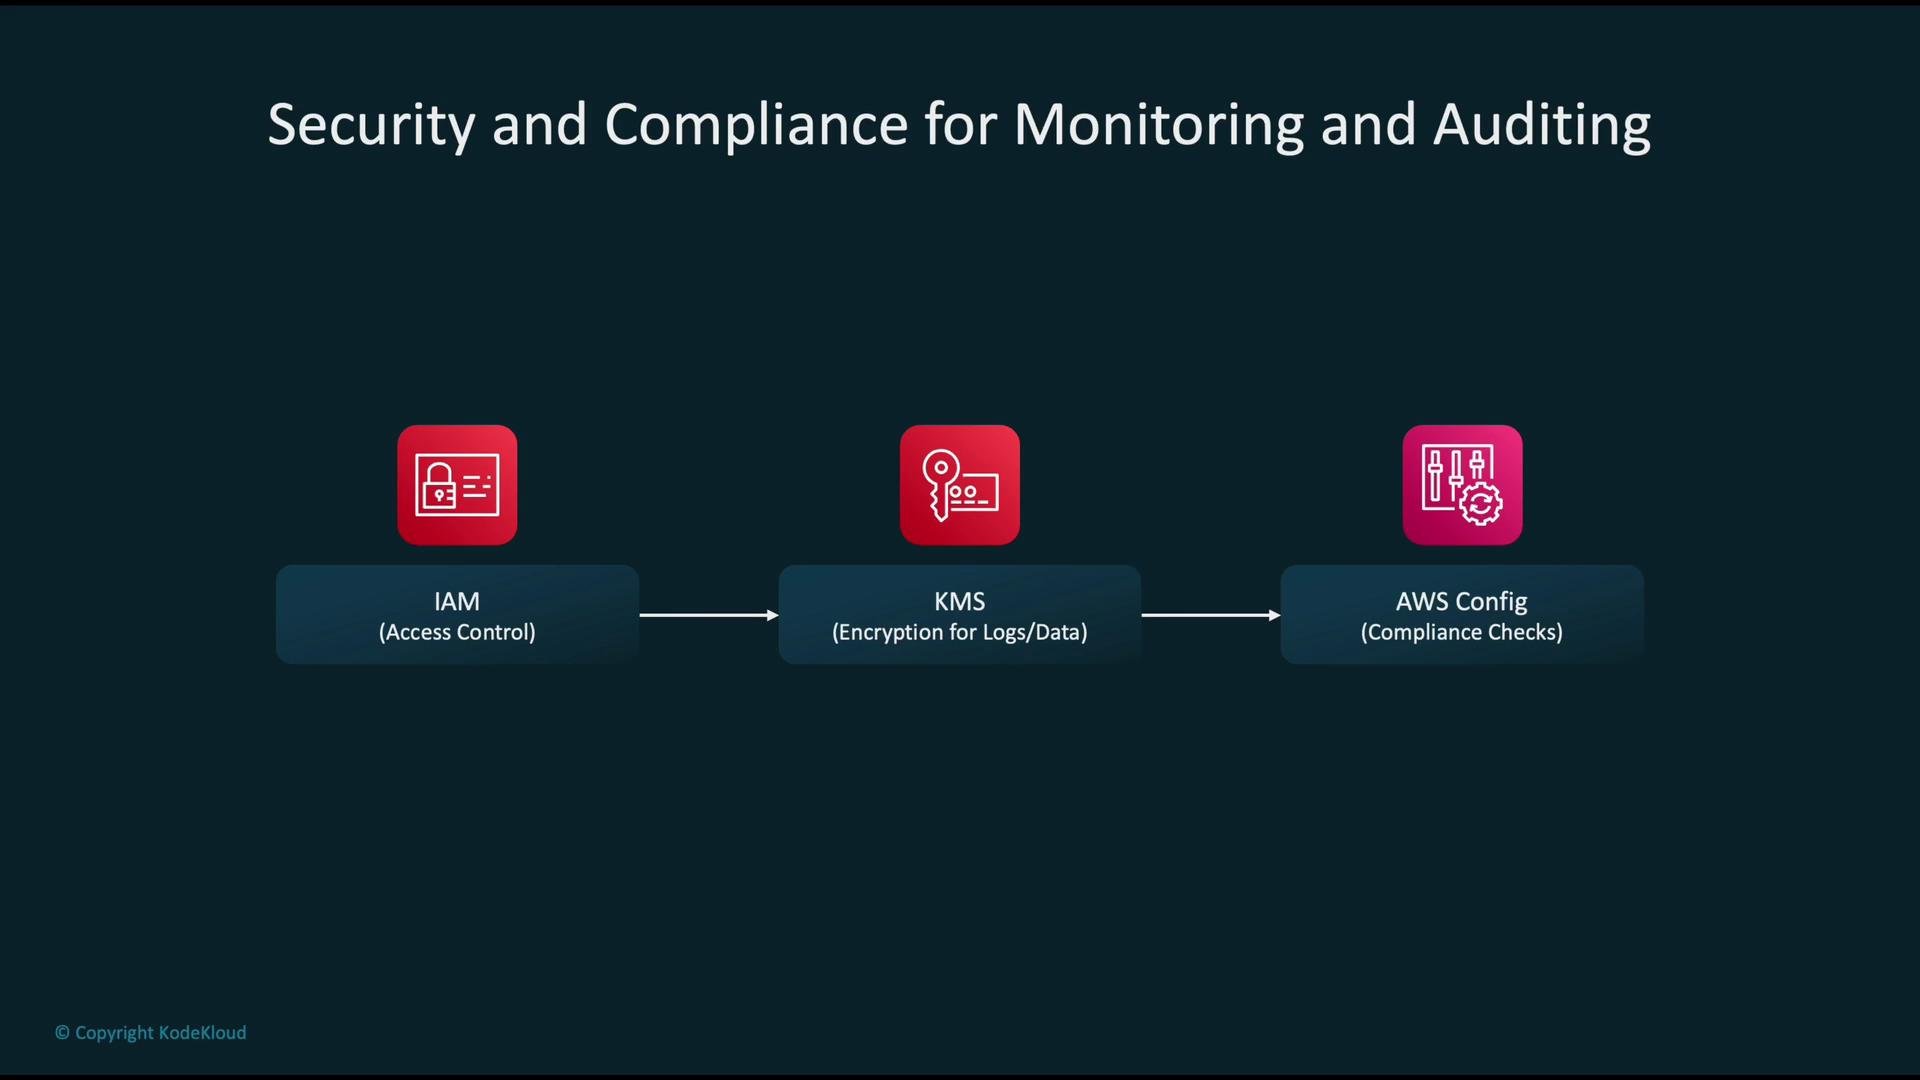
Adopt layered controls to protect telemetry, model artifacts, and audit evidence:- IAM: enforce least privilege and use service roles instead of long-lived credentials when possible.
- KMS: encrypt logs, model artifacts, and captured data at rest using AWS KMS keys with strict key policies and rotation.
- AWS Config: continuously evaluate resource configurations against organizational rules (for example, CloudTrail enabled, S3 buckets encrypted, endpoints in approved VPC subnets).
- Logging integrity: ensure CloudTrail and CloudWatch logs are centralized, immutable, and protected from tampering.
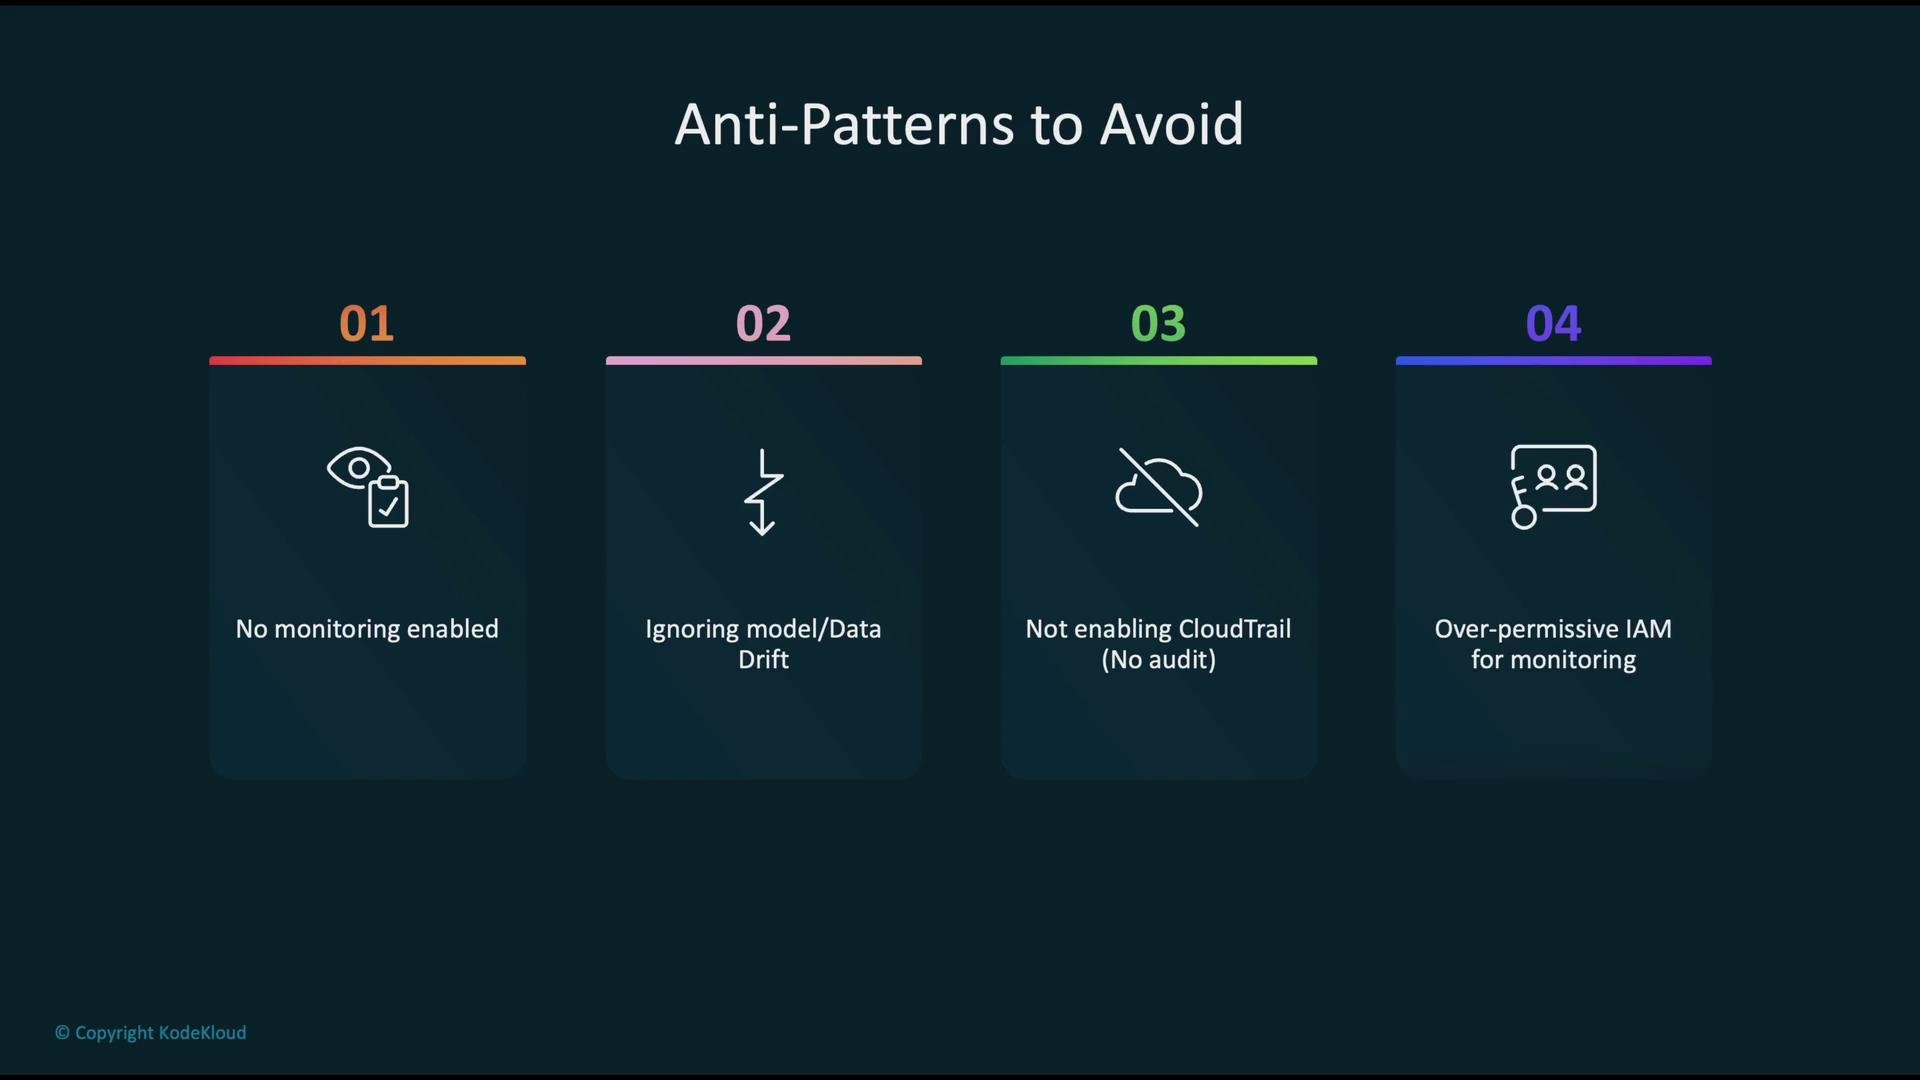
Avoid these anti-patterns. They undermine observability, security, and compliance and make debugging or audits much harder.
Anti-patterns to avoid
- No monitoring at all — you won’t be alerted when production degrades.
- Ignoring model and data drift — models degrade over time without detection.
- Not enabling CloudTrail — you lose the forensic history needed for investigations.
- Overly permissive IAM for monitoring — increases blast radius and insider risk.
Summary
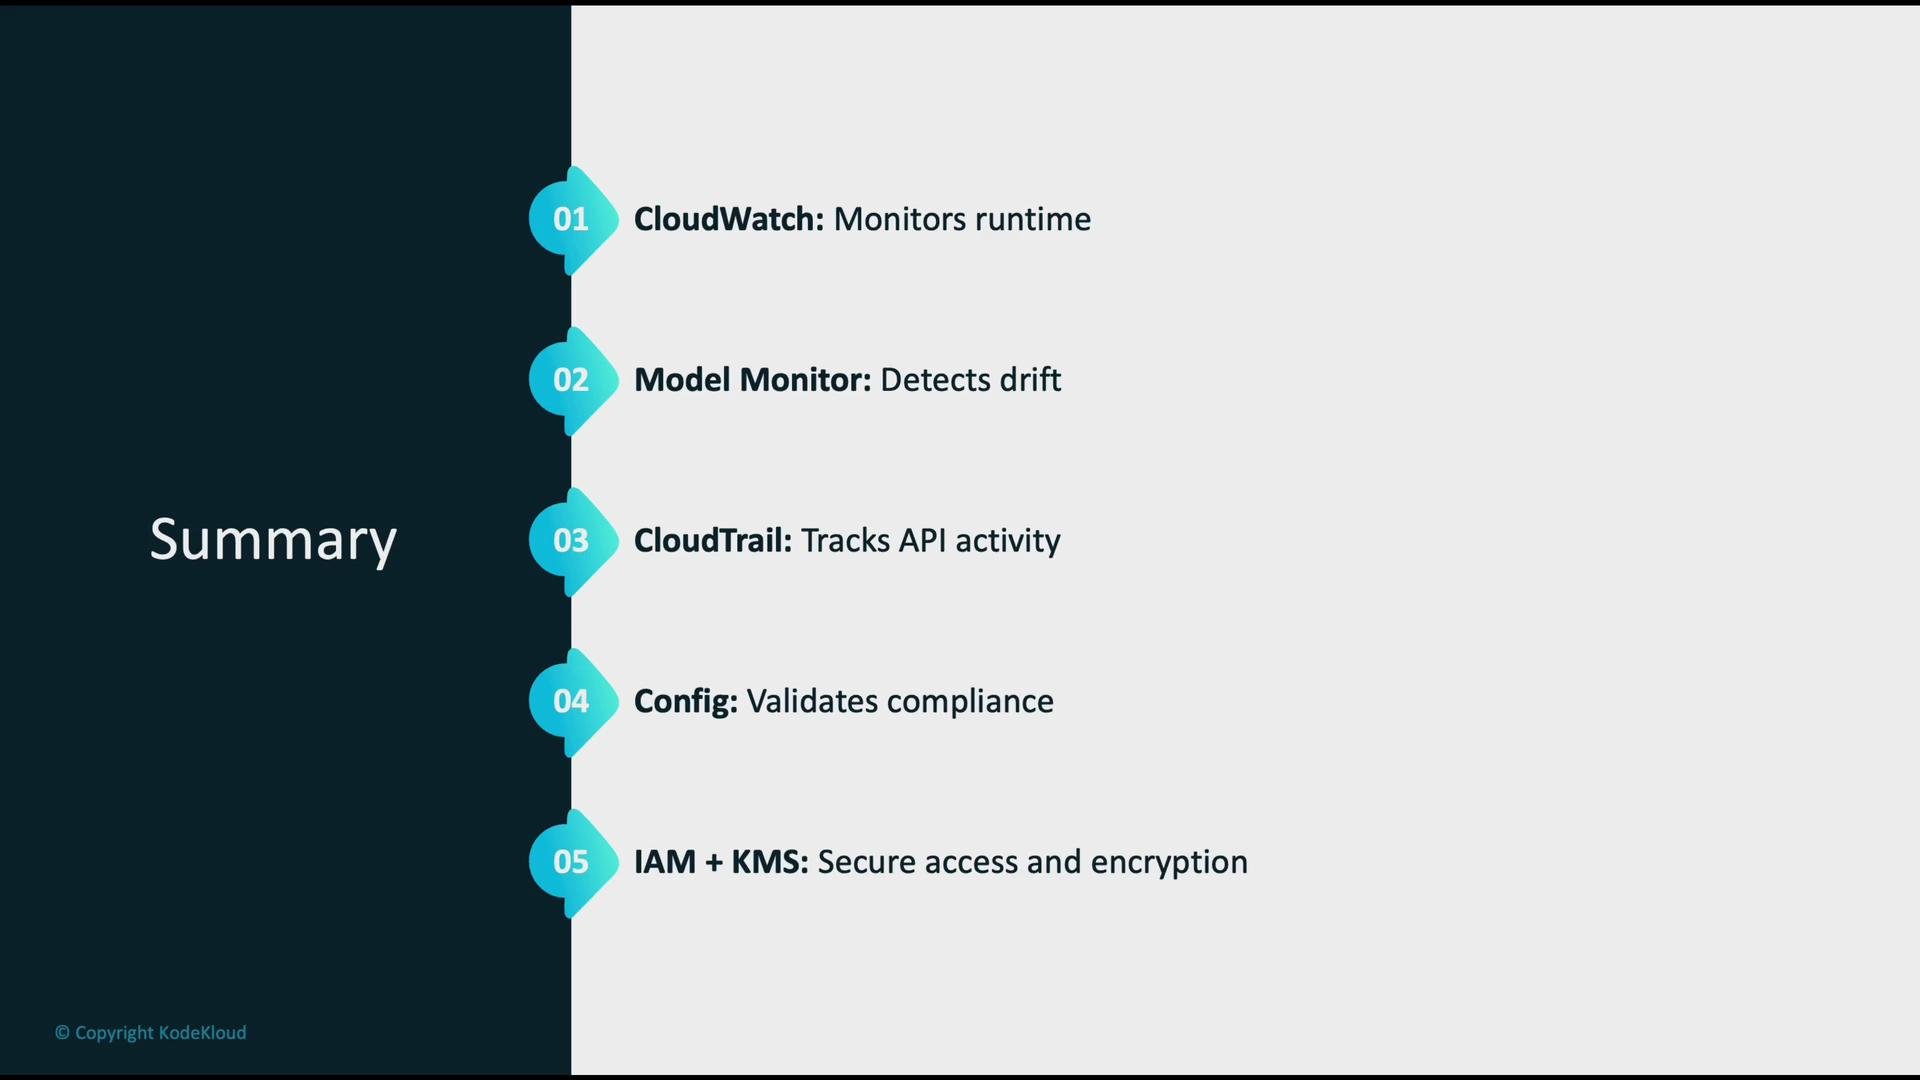
- CloudWatch provides runtime telemetry, alarms, and dashboards for operational monitoring.
- SageMaker Model Monitor detects data and concept drift and reports model quality issues.
- CloudTrail records API activity to create an auditable history of actions.
- AWS Config enforces and reports on resource configuration compliance.
- IAM and KMS form the foundation for secure access control and encryption of telemetry and artifacts.
Links and references
- AWS CloudWatch — https://aws.amazon.com/cloudwatch/
- AWS CloudTrail — https://aws.amazon.com/cloudtrail/
- AWS Config — https://aws.amazon.com/config/
- SageMaker Model Monitor — https://docs.aws.amazon.com/sagemaker/latest/dg/model-monitor.html
- Amazon Athena — https://aws.amazon.com/athena/
- AWS KMS — https://aws.amazon.com/kms/
- AWS IAM — https://aws.amazon.com/iam/