

- The model/container logs (linked from the model page).
- Operational metrics displayed on the dashboard (these are sourced from CloudWatch).
- Any configured alarms or notification triggers.
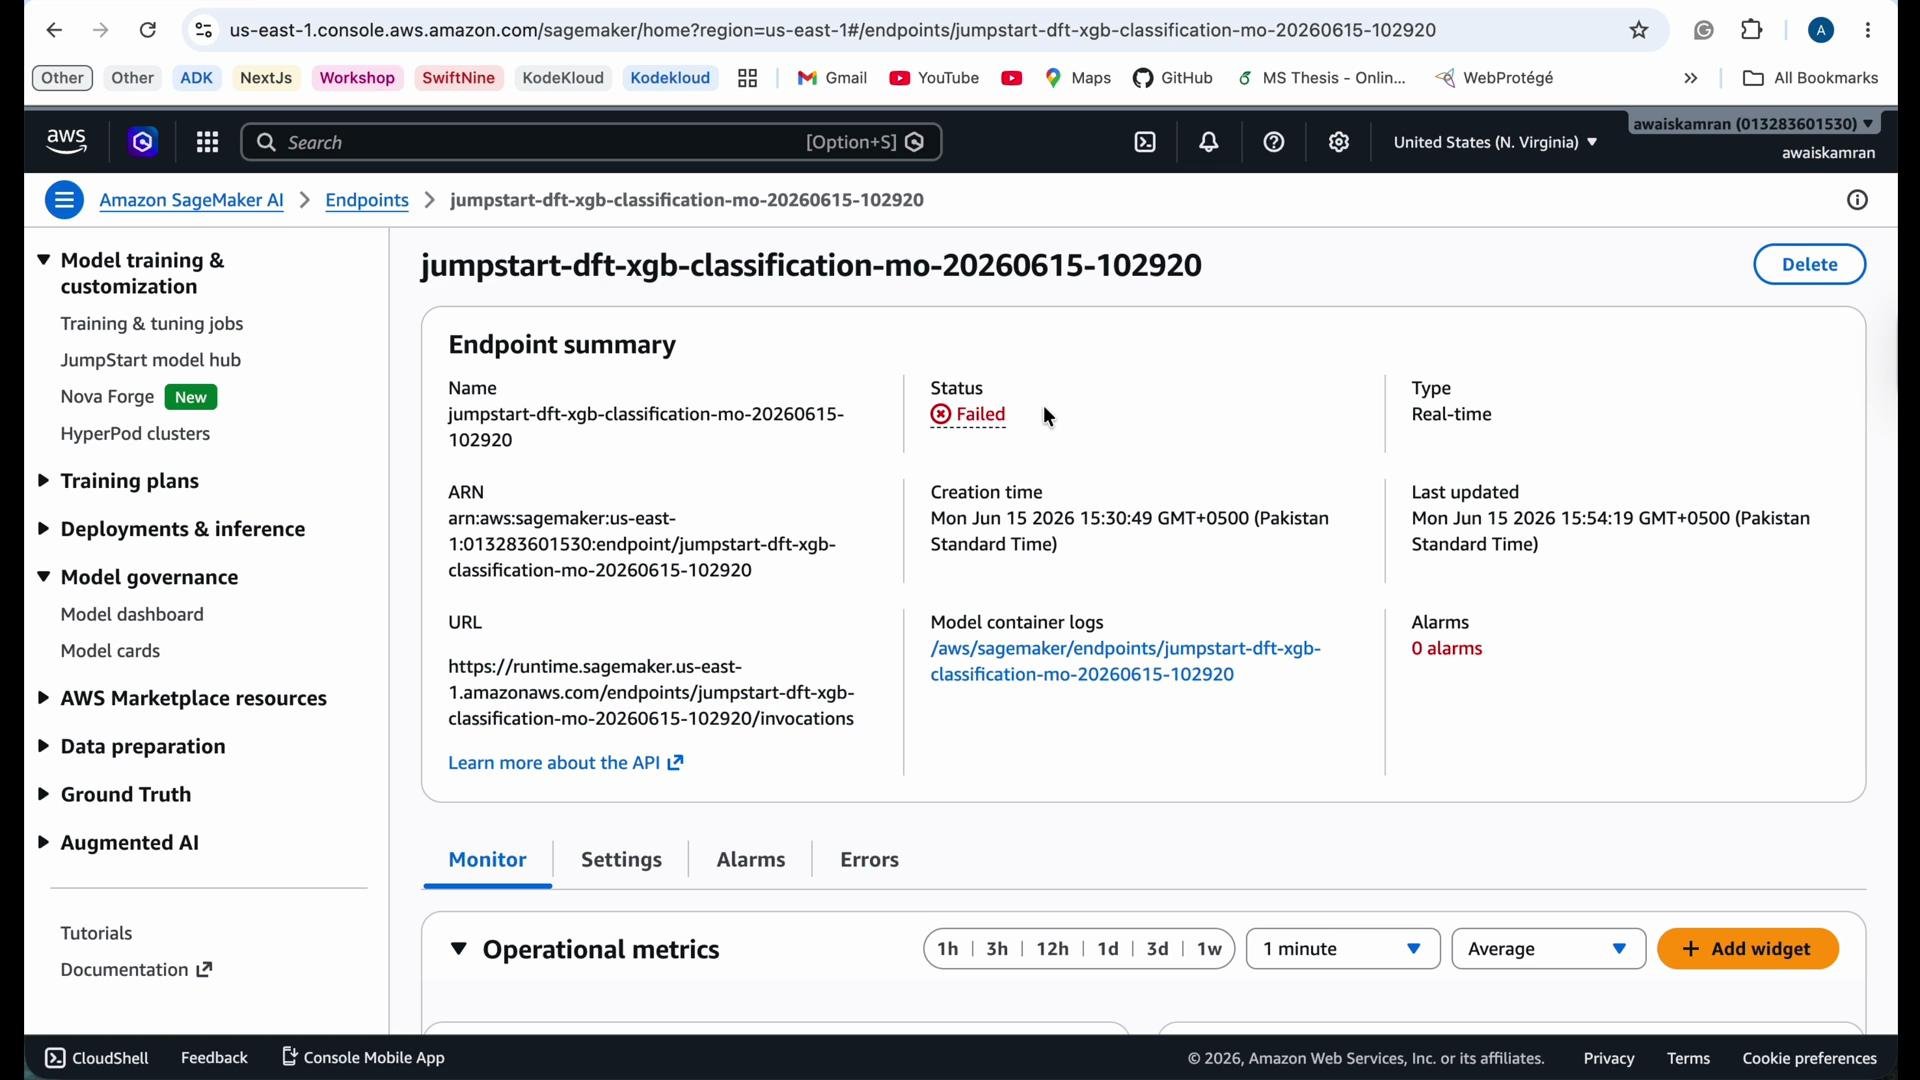
- Endpoint name, ARN, and invocation URL.
- Current status (e.g.,
Failed). - A link to CloudWatch Logs for the endpoint’s log group.
- A monitoring section with charts for
CPUUtilization,MemoryUtilization,DiskUtilization, and (if applicable) GPU metrics. - Controls to create alarms from the displayed metrics.
-
Open CloudWatch Logs from the Model Dashboard
- Click the CloudWatch Logs link on the model detail page to open the Logs console for the endpoint’s log group.
- Within the log group, open the relevant log stream(s). Logs contain installation, build, and runtime output from the container and the inference server.
-
Inspect logs for tracebacks and warnings
- Scroll the log stream from the time the resource was registered through the failure event and look for Python tracebacks,
ModuleNotFoundError, orImportError. - Example container install + runtime log excerpt:
- Scroll the log stream from the time the resource was registered through the failure event and look for Python tracebacks,
- The root cause is the Python import error:
ModuleNotFoundError: No module named 'inference'. This means the runtime cannot find the package the server expects. - Common causes:
- The package was installed into a different environment or path.
setup.pyhas incorrect package/module names orpackages/py_modulesare mis-specified.- The container image or build artifact does not include the expected module.
- The Nginx/Gunicorn error
connect() to unix:/tmp/gunicorn.sock failedis a downstream symptom: the inference server never started, so the Nginx proxy failed to connect to the application socket and returned upstream errors.
Avoid installing packages as root inside your container where possible. Packaging or installation problems are a common cause of
ModuleNotFoundError at runtime. Verify your setup.py and package layout, and ensure the module is present in the container image or in the build artifact that SageMaker uses.- Narrow the time range and filter logs
- Use CloudWatch’s time-range selector to focus on the minute/hour surrounding the failure.
- Change display formats (expanded rows, plain text) and export logs if required.
- Logs Insights can speed up searching across many log streams.
- Basic Logs Insights query to list recent events in the selected log group:
- Use the Logs Insights editor in the CloudWatch console to refine queries by search terms, fields, or parsing rules to zero in on specific error messages, IPs, or request IDs.
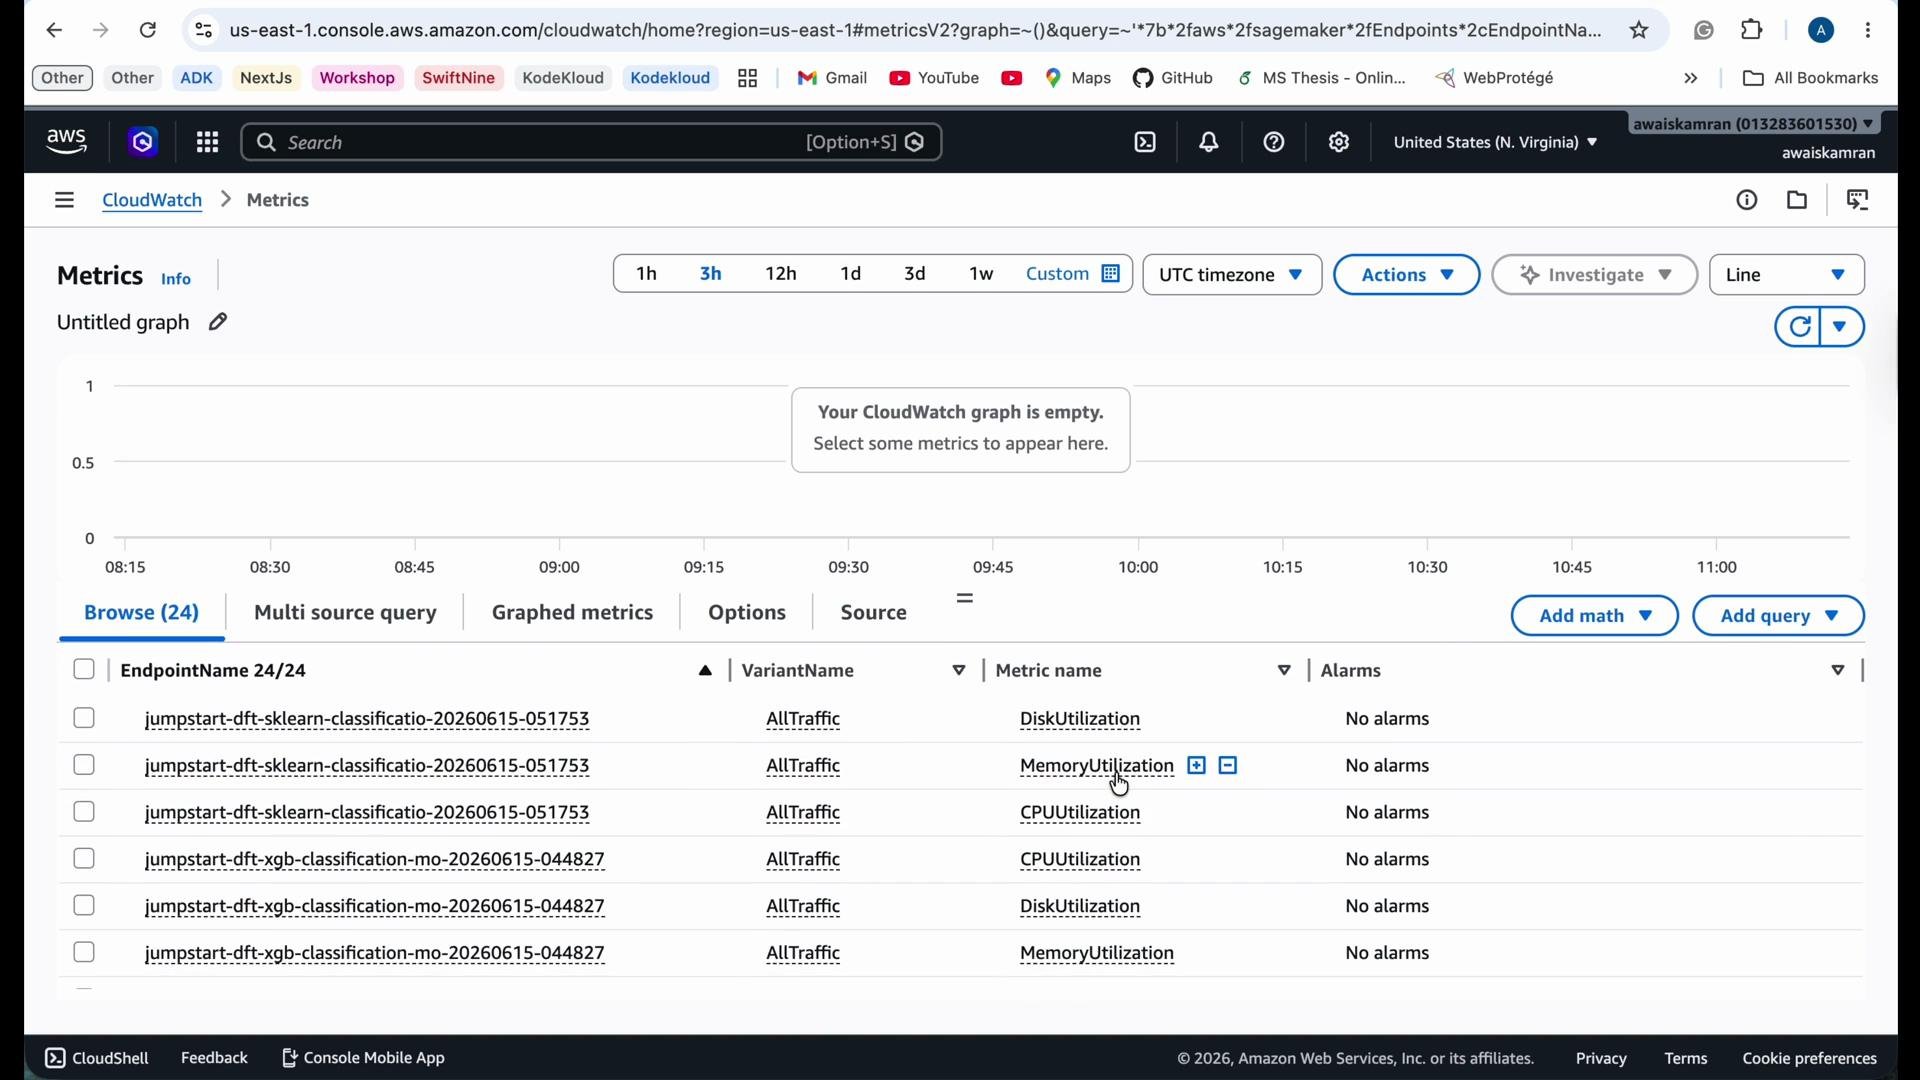
- Check Metrics (CPU / Memory / Disk / GPU)
- Correlate resource metrics with log timestamps. High memory or disk contention can cause processes to crash or fail to start.
- Use CloudWatch Metrics charts for
DiskUtilization,MemoryUtilization, andCPUUtilizationto identify anomalies that coincide with the error.
- If your endpoint uses Nginx as a front proxy to Gunicorn, you may see related config and errors in logs. A minimal Nginx snippet used by some SageMaker containers:
Additional tips
- Rebuild and test your container locally (or in a CI pipeline) to confirm all packages are installed and imports succeed.
- Ensure
setup.pyaccurately lists packages or usepyproject.tomlwith a modern build backend if appropriate. - Avoid running
pip installasrootin production images; instead, use a dedicated virtual environment or ensure correct file ownership and permissions.
- [AWS CloudWatch — Course] (https://learn.kodekloud.com/user/courses/aws-cloudwatch)
- [AWS SageMaker — Course] (https://learn.kodekloud.com/user/courses/aws-sagemaker)
- [NGINX for Beginners — Course] (https://learn.kodekloud.com/user/courses/nginx-for-beginners)
- Gunicorn documentation