

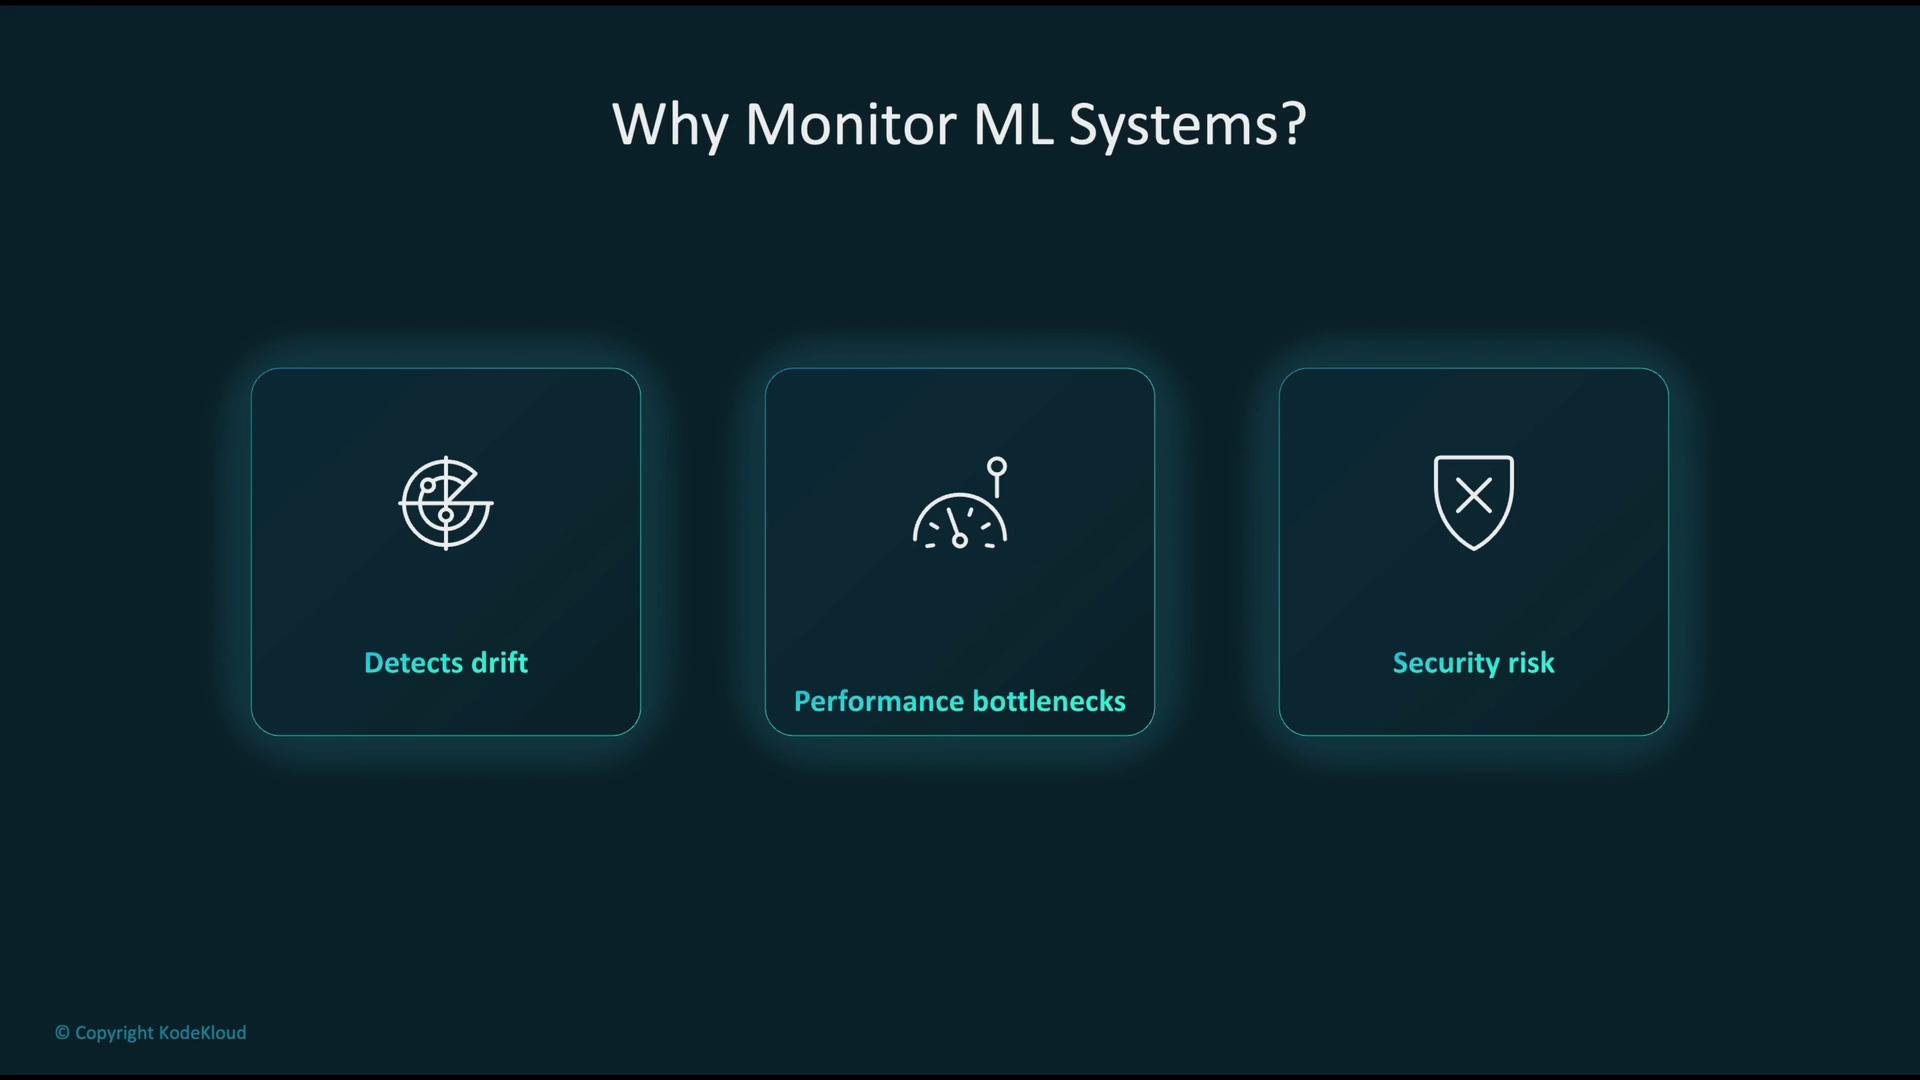
- Detect model and data drift so predictions remain accurate and relevant.
- Identify performance bottlenecks to keep latency and throughput within SLAs.
- Uncover and mitigate security or compliance risks to protect systems and data.
Continuous monitoring should cover model quality, infrastructure metrics, and responsible-AI concerns (bias, explainability). Configure automated alerts and remediation pipelines to ensure timely detection and recovery.
Overview: key AWS monitoring tools for ML
Use the following AWS services together to observe, alert, and remediate production ML issues.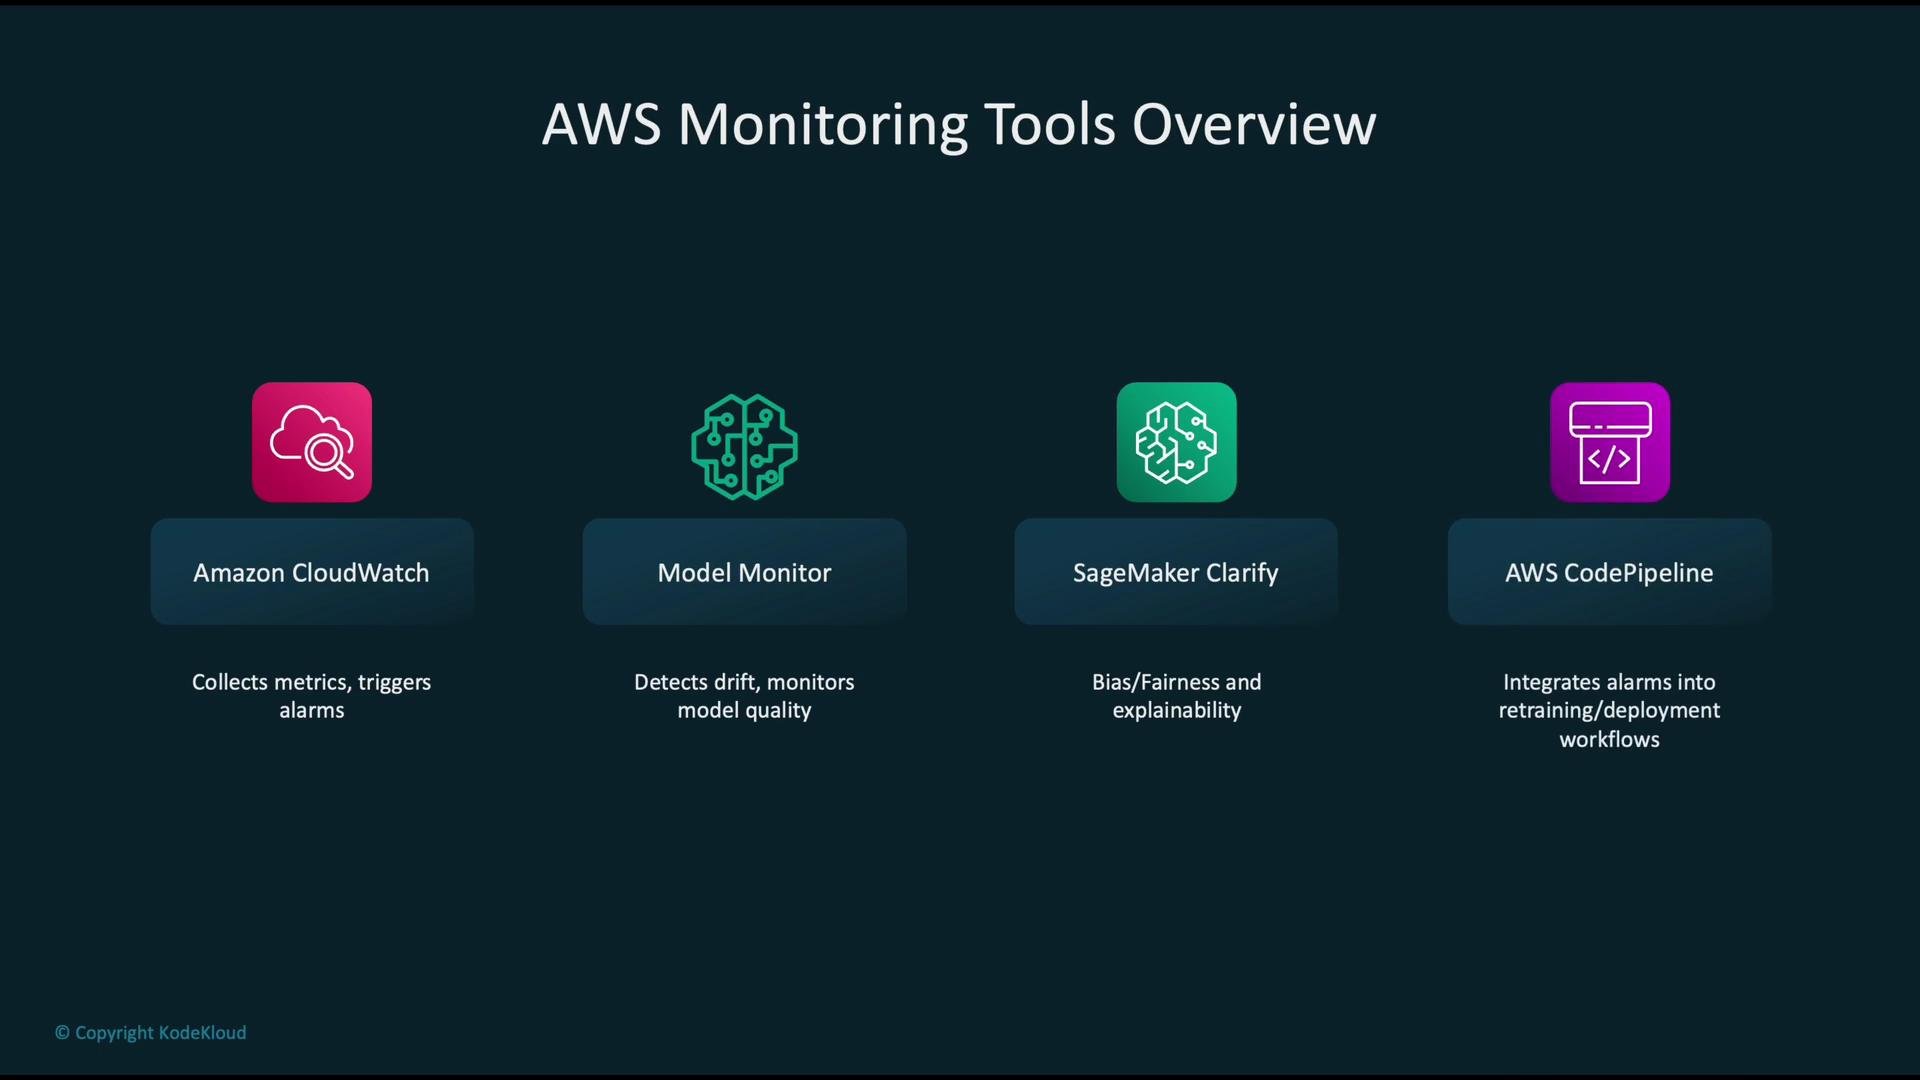
Amazon CloudWatch for ML system monitoring
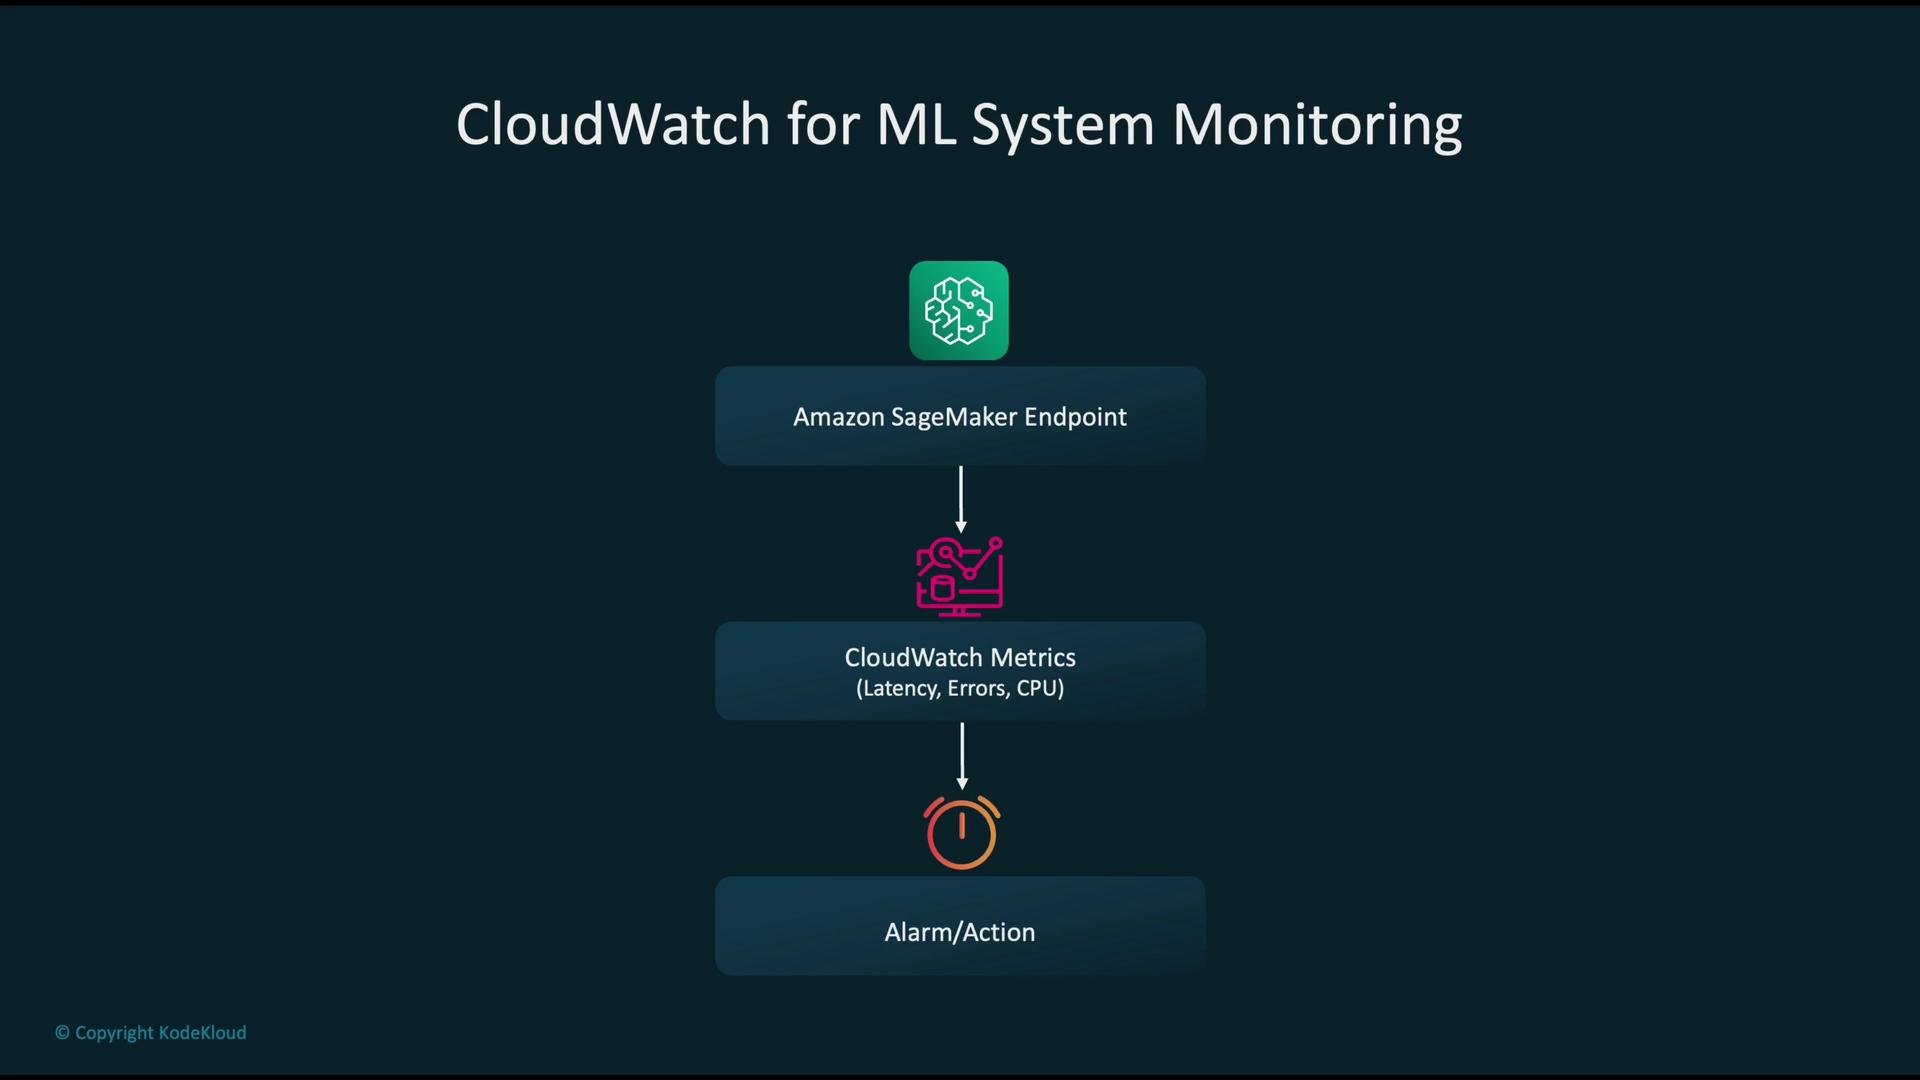
SageMaker endpoints and other components emit operational telemetry to CloudWatch. Use CloudWatch for real-time visibility, alarms, and automated actions.- Common metrics: latency/p99, request count, error rates, instance CPU/GPU utilization.
- For GPU metrics, consider the CloudWatch Agent or custom metrics from the instance.
- Create alarms for SLA breaches and connect them to SNS, Lambda, autoscaling, or pipeline triggers.
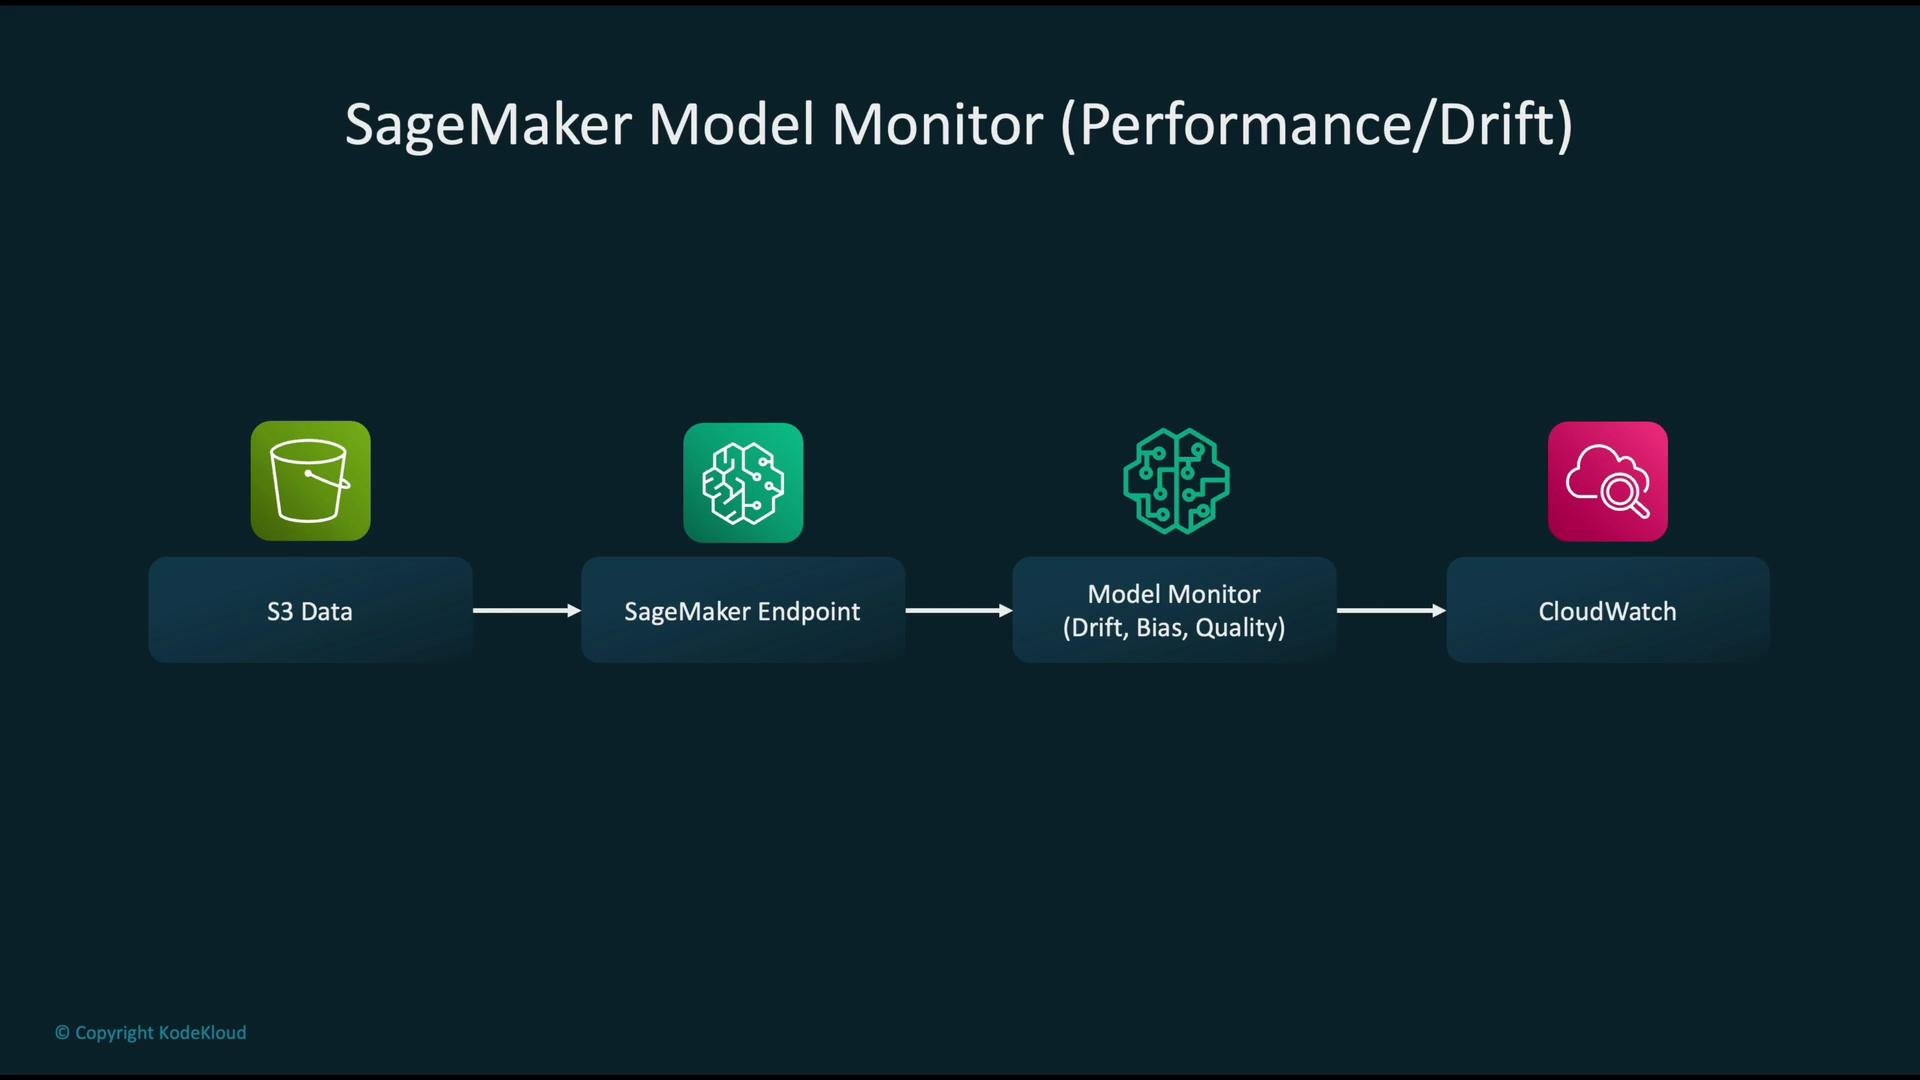
SageMaker Model Monitor — tracking drift, bias, and quality
Model Monitor captures inference requests (and ground-truth labels when available) and evaluates incoming data against a baseline derived from training data.- Capture inputs/outputs to S3 and register a baseline dataset.
- Schedule Model Monitor jobs or trigger them by events for continuous evaluation.
- Detect: distribution drift, missing features, target drift, and quality violations.
- Publish violations and aggregated metrics to CloudWatch for alerting and dashboards.
SageMaker Clarify — fairness and explainability
SageMaker Clarify helps you enforce responsible AI practices by measuring bias and generating model explanations.- Evaluate datasets and prediction outputs for bias across protected attributes.
- Produce SHAP-based feature attributions for both local (per prediction) and global explanations.
- Integrate Clarify checks into training and pre-deployment gates to prevent biased models from reaching production.
CI/CD and pipeline monitoring with AWS
Integrate monitoring signals into your ML CI/CD pipeline so quality gates, tests, and alerts can stop or roll back deployments.- Typical pipeline stages: source (CodeCommit/Git), build & test (CodeBuild), deploy (CodeDeploy/SageMaker), production.
- Feed CloudWatch alarms, Model Monitor results, and Clarify reports into pipeline gates.
- Automate remediation (retrain, rollback, or patch) using Lambda or dedicated pipeline stages.
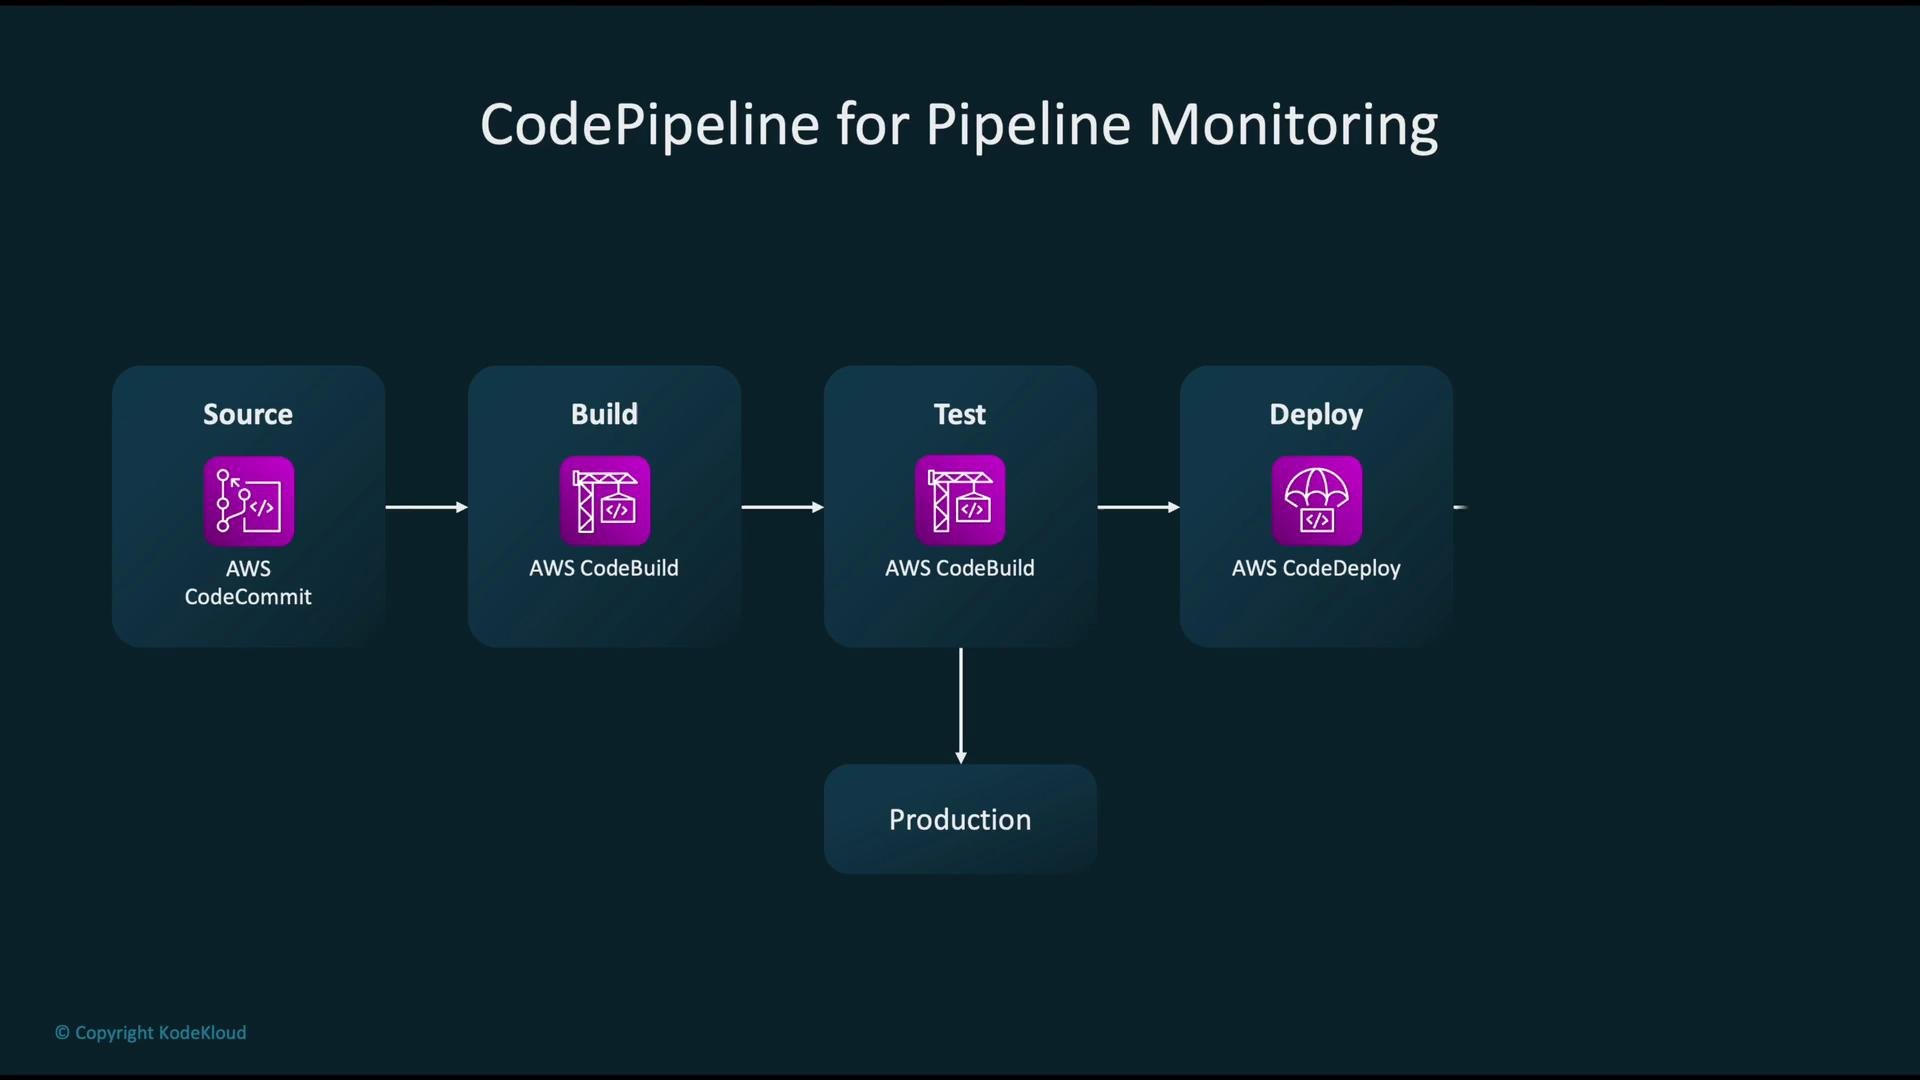
Automated remediation example (CI/CD + Lambda)
- A pipeline failure or CloudWatch alarm invokes a Lambda function.
- Lambda can: start a retraining job, re-evaluate model performance, or scale resources.
- If the new model passes validation, the pipeline proceeds to deploy to the SageMaker endpoint.
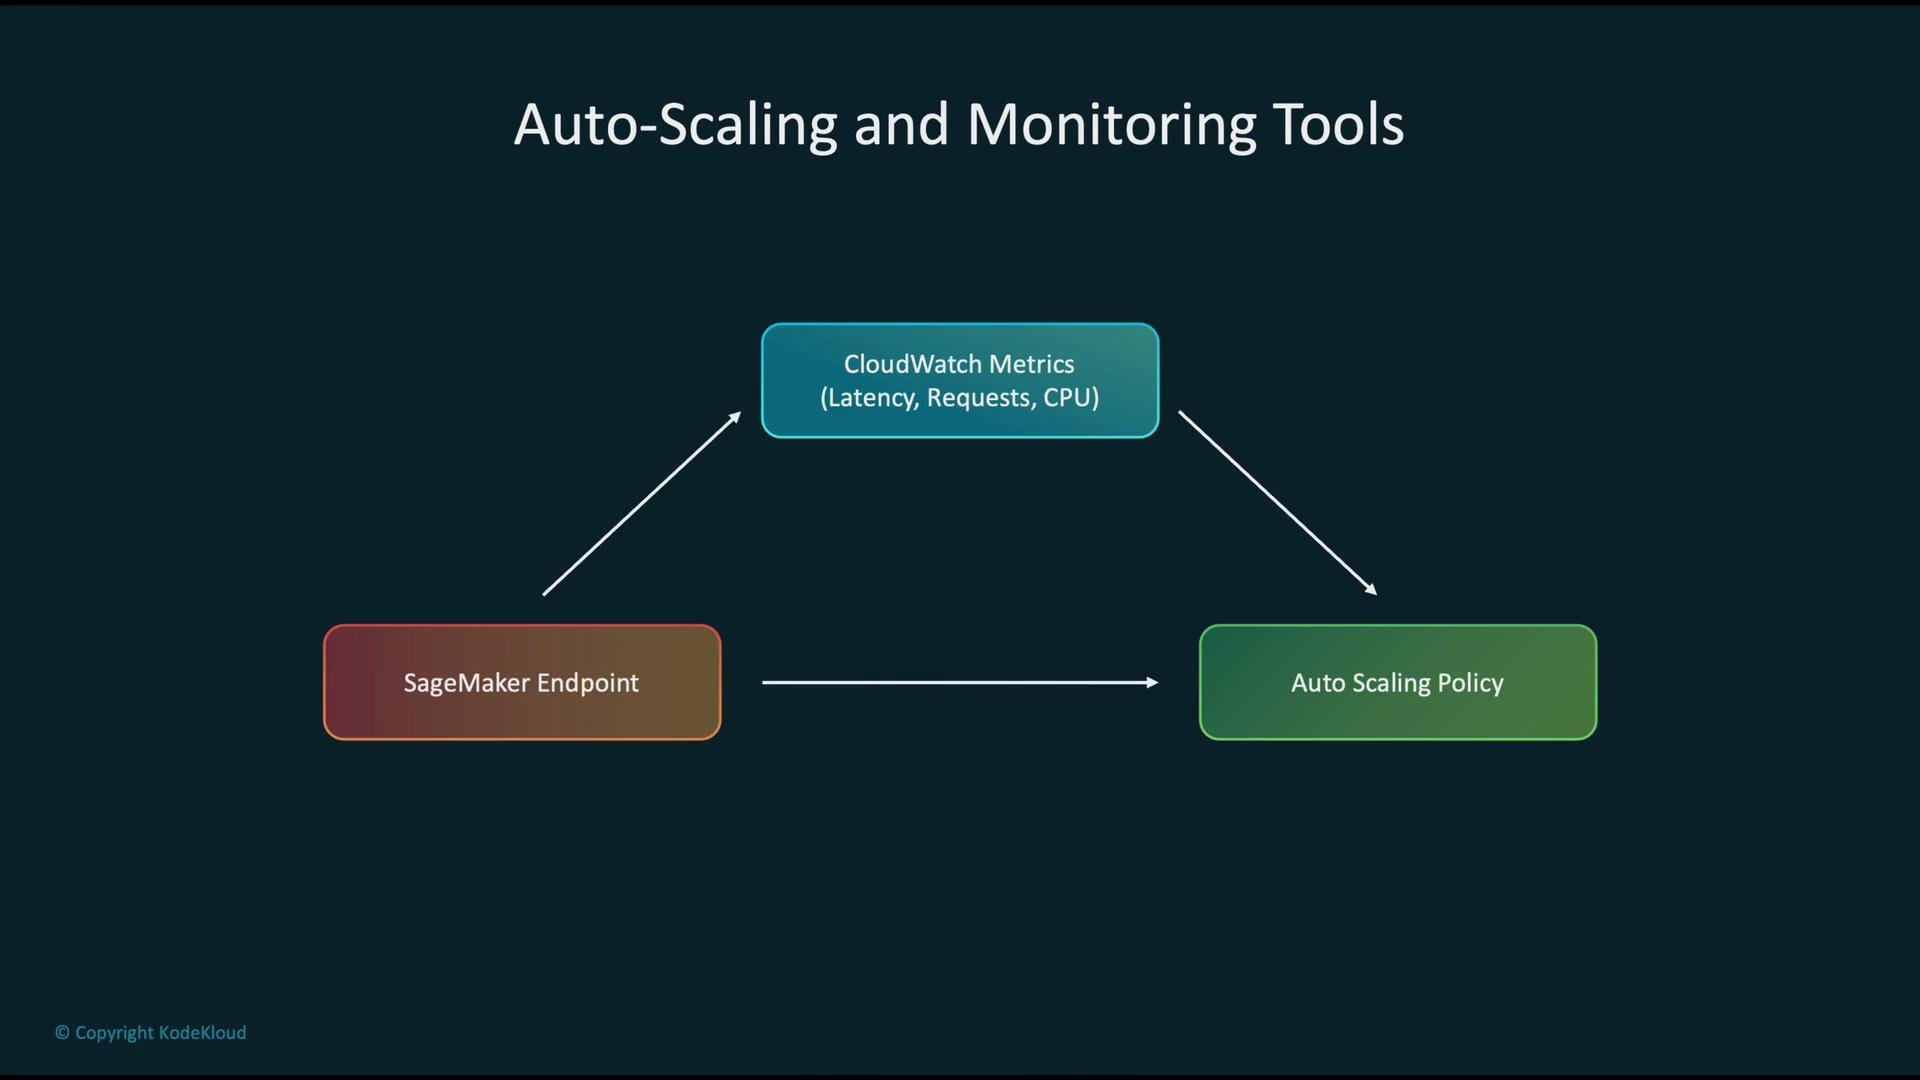
Auto scaling SageMaker endpoints using CloudWatch metrics
Use autoscaling to adapt capacity to demand while controlling costs and maintaining SLAs.- Endpoints publish request count, latency, and CPU utilization metrics to CloudWatch.
- Configure target tracking or step-scaling policies using those metrics.
- Tune thresholds and cooldown periods to avoid flapping and to balance cost/performance.
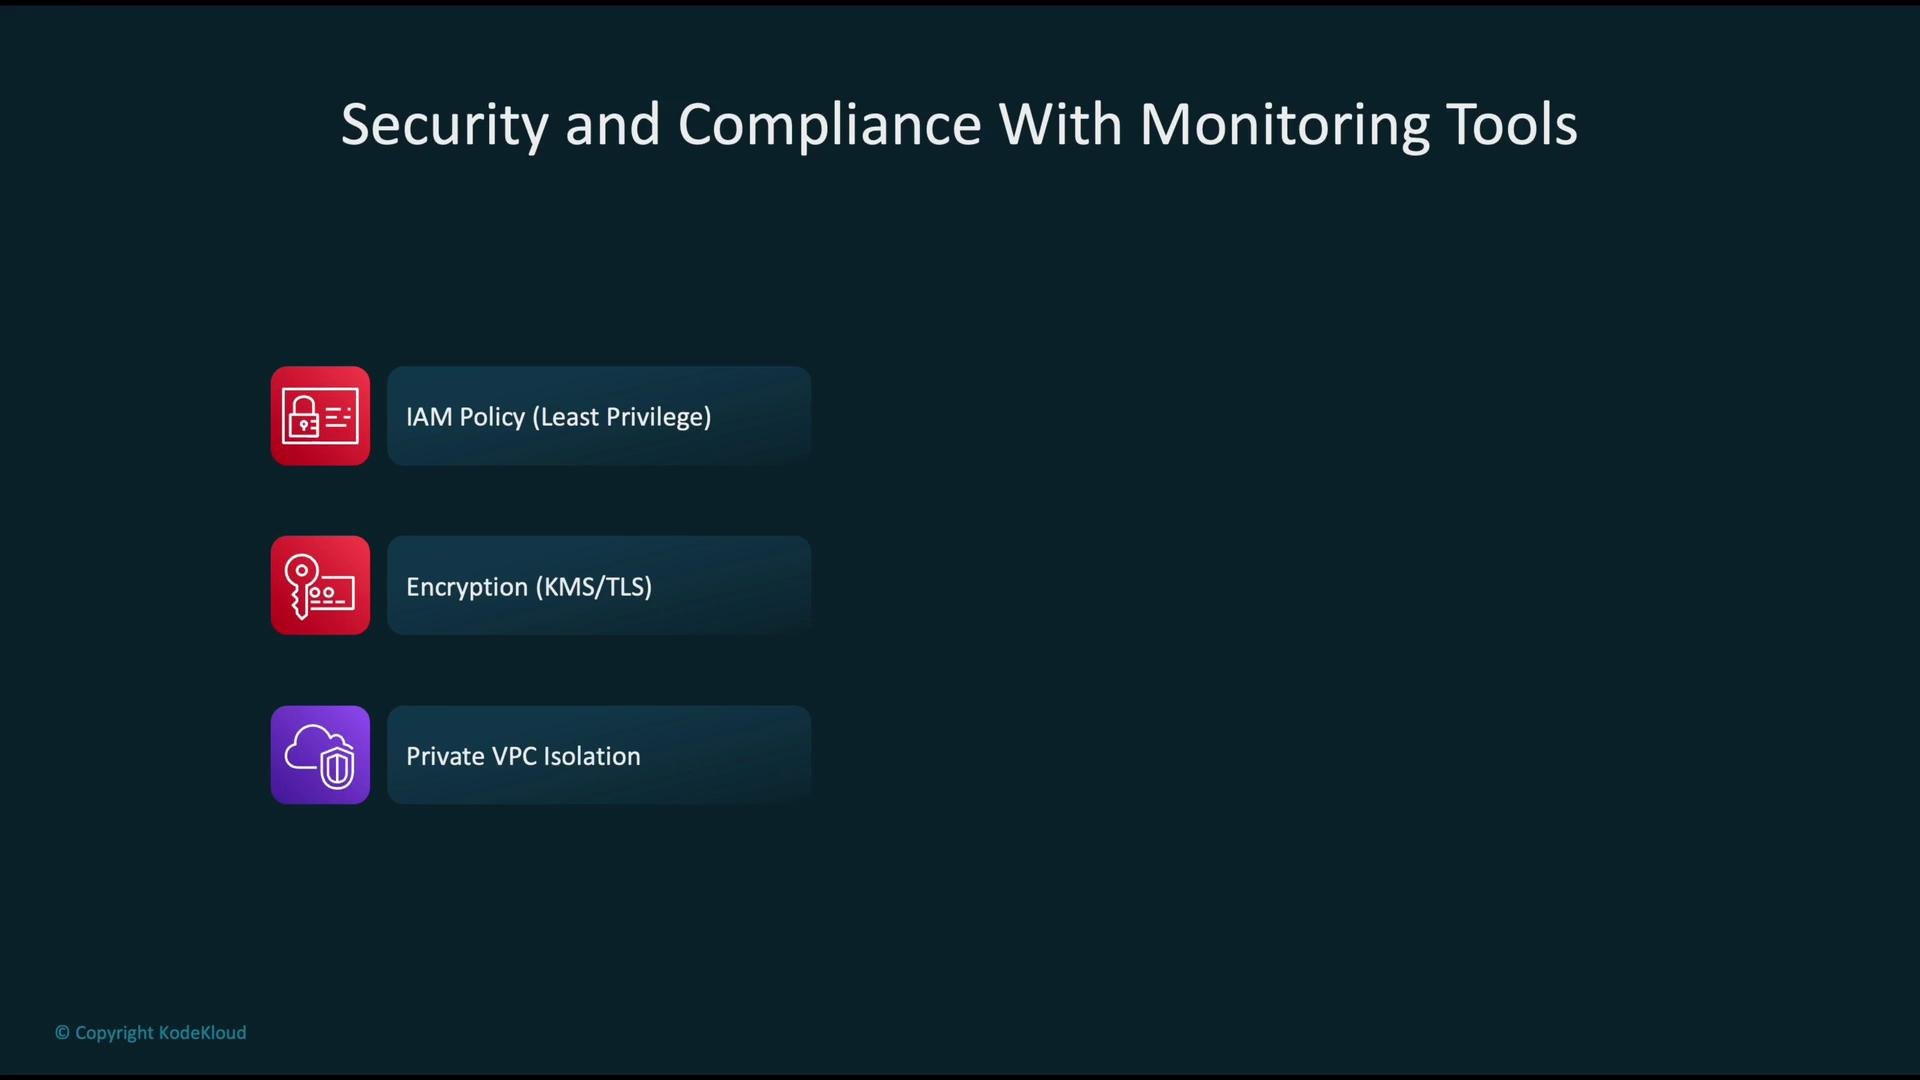
Security and compliance for endpoints
Security controls are key to safe production deployments:- Enforce least-privilege IAM roles for training, hosting, and monitoring components.
- Encrypt data in transit (TLS) and at rest (KMS).
- Use VPC endpoints or private VPC hosting to limit network exposure.
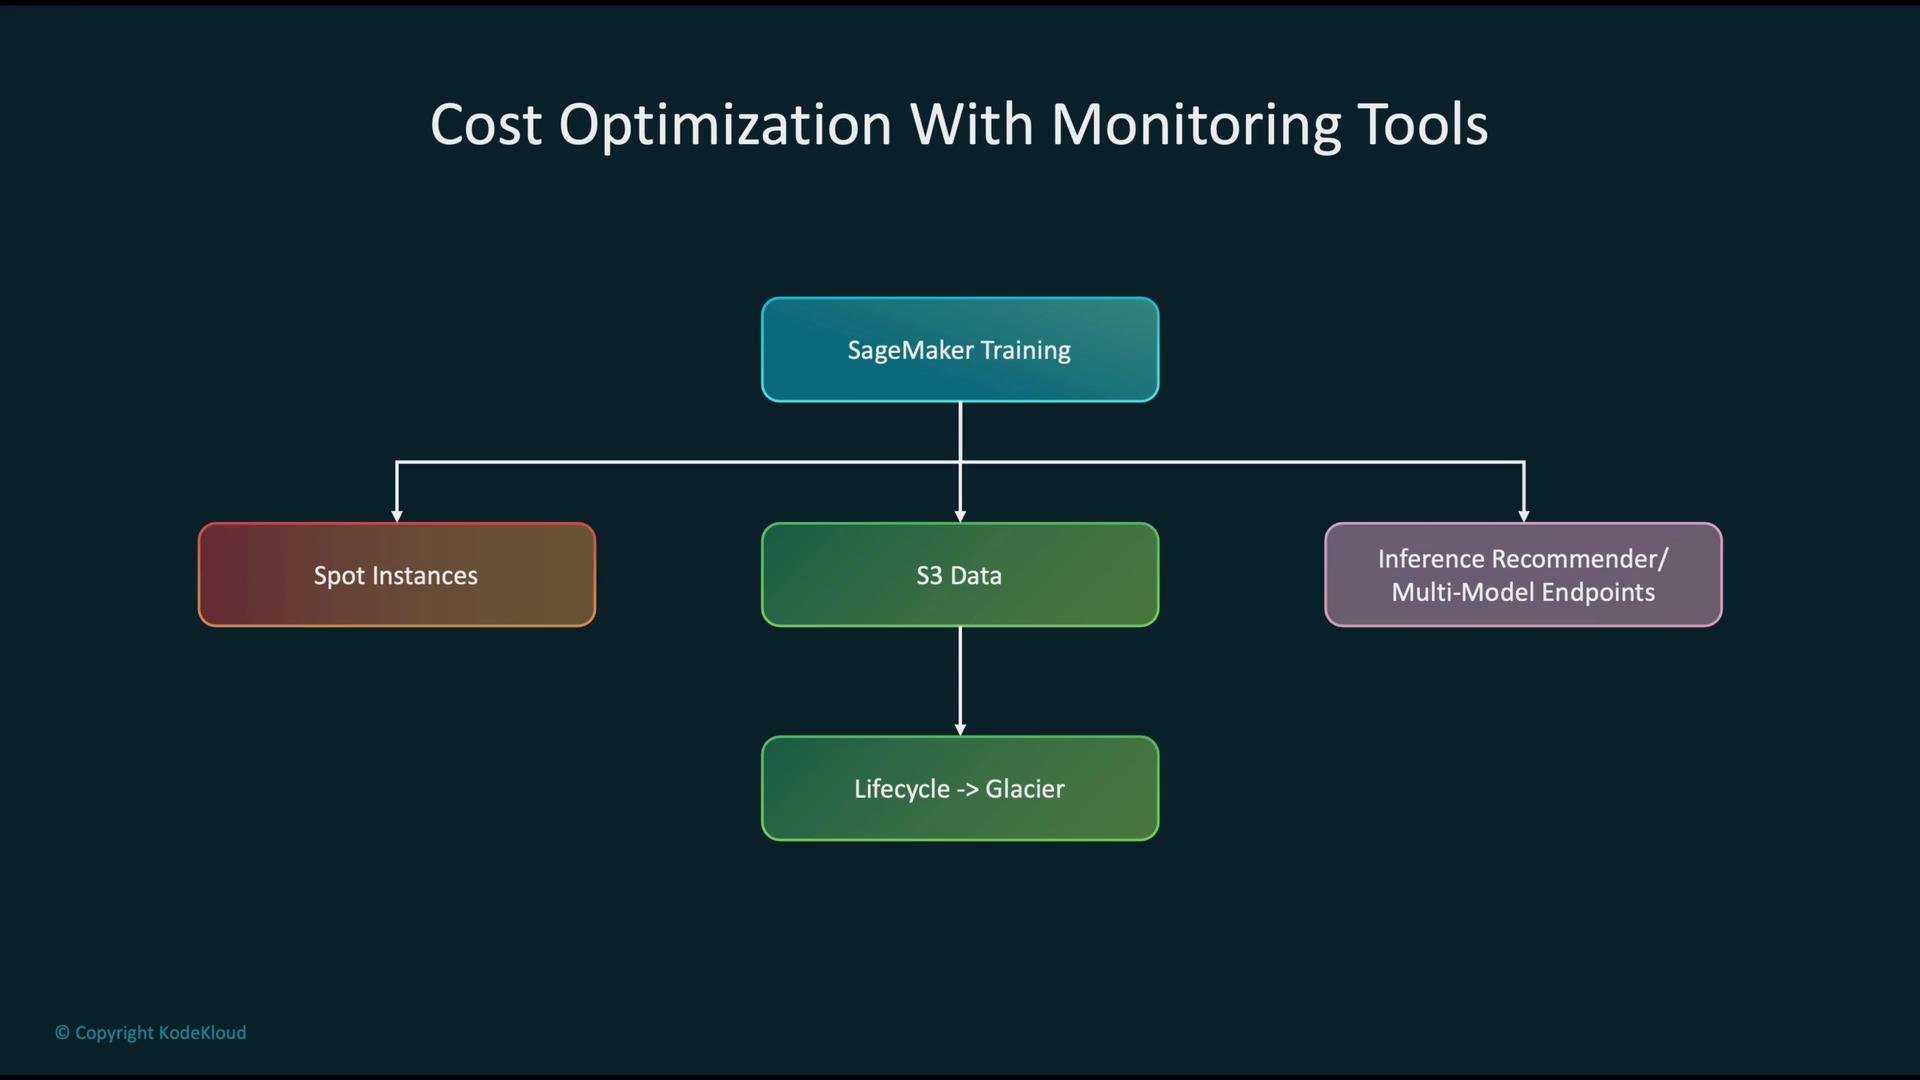
Cost optimization strategies
Monitoring helps control costs by informing placement, scaling, and storage policies.- Use Spot Instances for non-critical or checkpointed training runs to reduce compute costs.
- Use the SageMaker Inference Recommender to select optimal instance types.
- Consider multi-model endpoints to host multiple small models on a single endpoint for spiky workloads.
- Apply S3 lifecycle rules to move older artifacts to infrequent access or Glacier.
Common anti-patterns to avoid
Avoid these common mistakes: running without monitoring, ignoring drift/bias, hard-coding scaling rules, and using overly permissive IAM roles. Each increases risk to model quality, performance, and security.
- Operating without monitoring or alarms — you’ll detect issues only via user complaints.
- Ignoring model/data drift and bias — leads to accuracy and fairness degradation.
- Hard-coding scaling rules instead of tying autoscaling to real metrics.
- Overly permissive IAM roles — increases blast radius.
Key takeaways
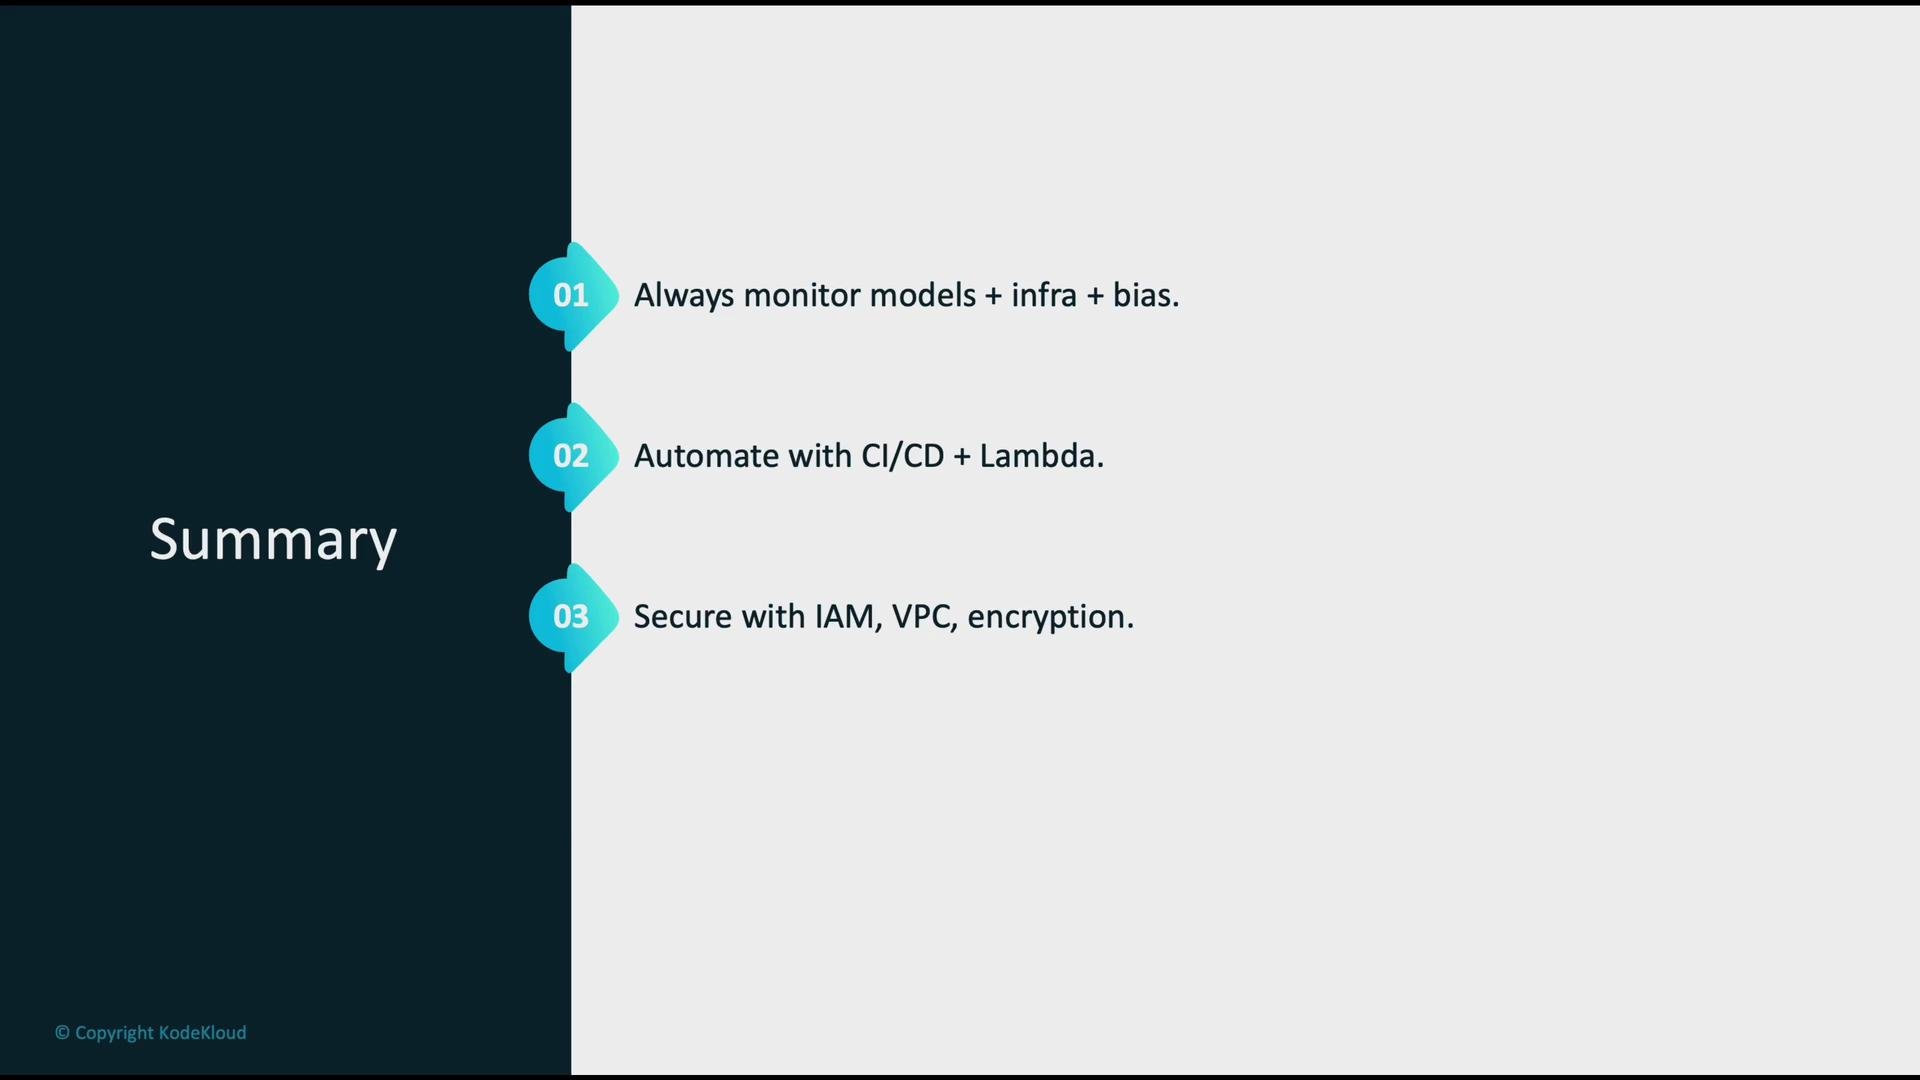
- Continuously monitor model quality, infrastructure health, and model fairness/explainability.
- Publish Model Monitor and Clarify findings to CloudWatch and gate deployments with CI/CD (CodePipeline, CodeBuild, CodeDeploy) and Lambda.
- Secure endpoints with least-privilege IAM, VPC isolation, and encryption (KMS/TLS).
- Optimize costs using Spot Instances, the Inference Recommender, multi-model endpoints, and S3 lifecycle policies.
Links and references
- Amazon CloudWatch documentation
- Amazon SageMaker documentation
- SageMaker Model Monitor overview
- SageMaker Clarify overview
- AWS CodePipeline documentation
- AWS Lambda documentation
- AWS IAM best practices