

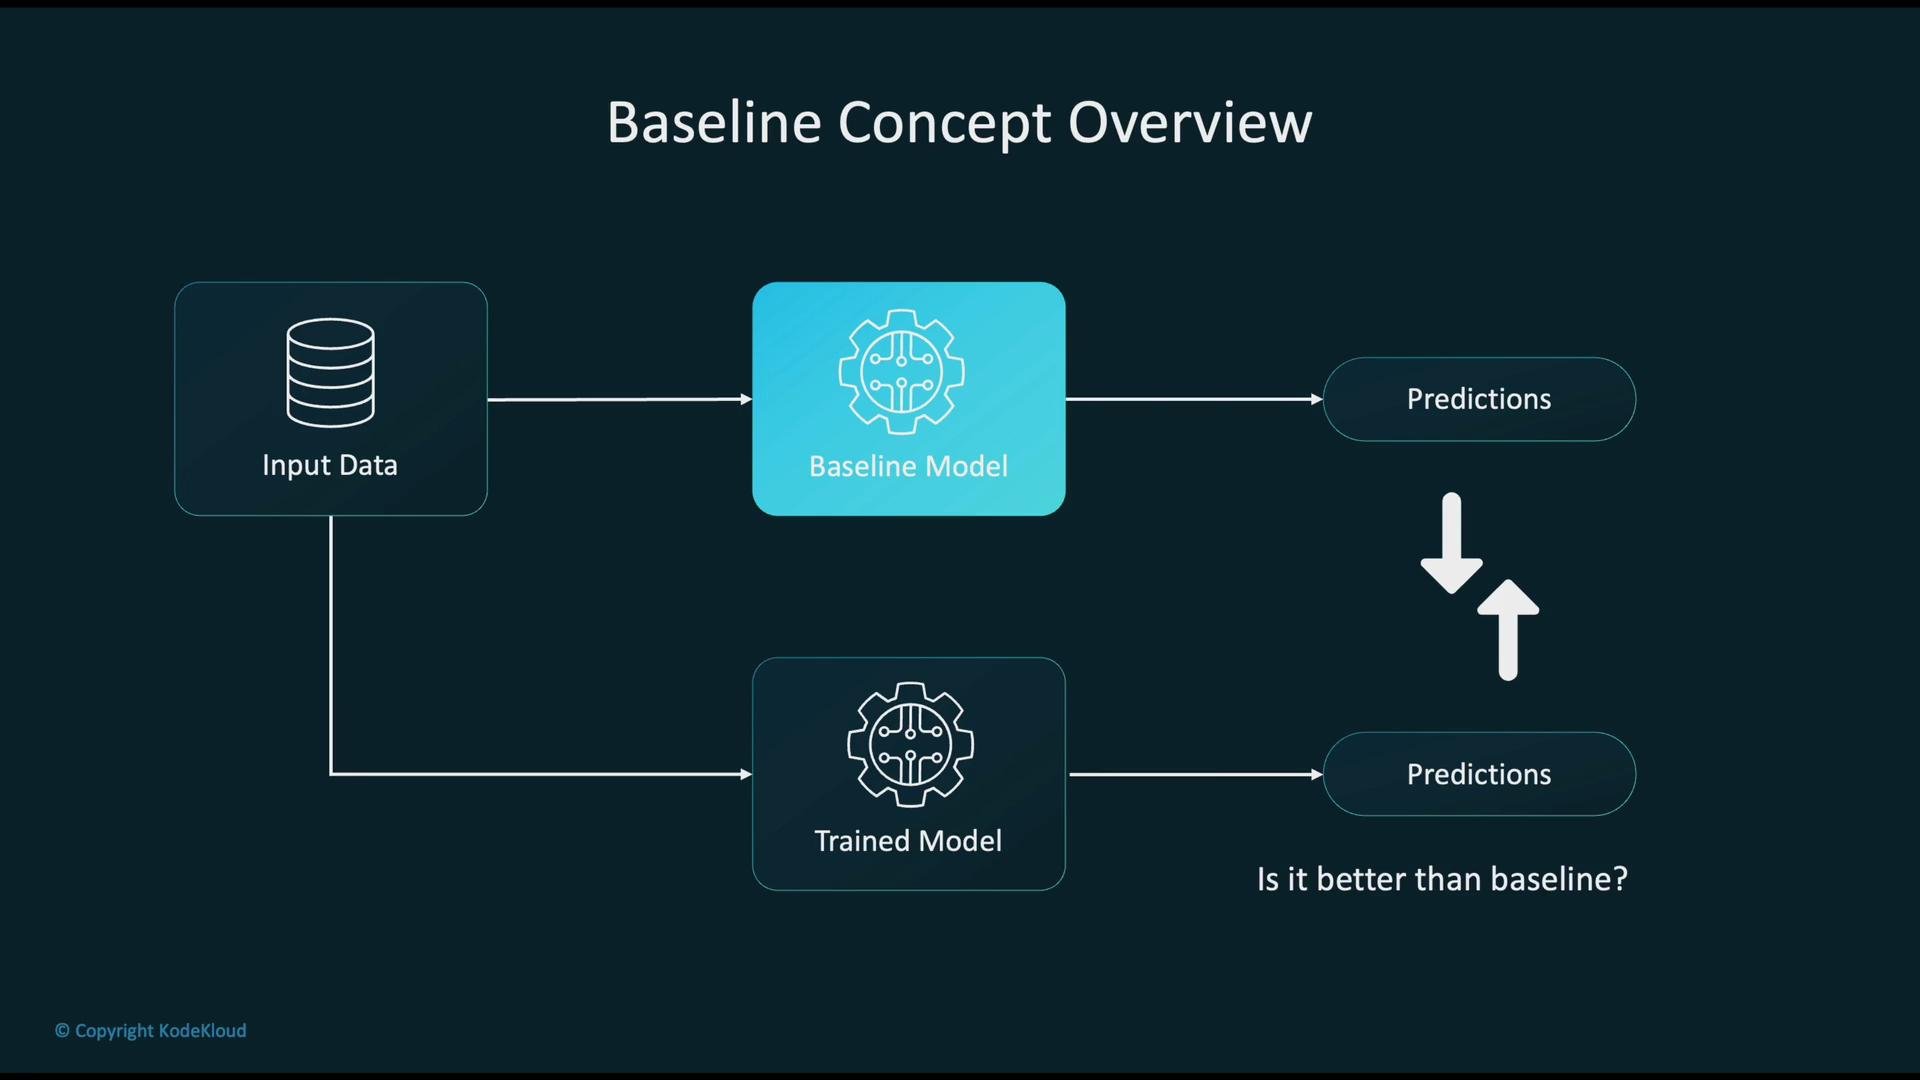
Common baseline types
Use increasingly stronger baselines as you progress: start simple and advance toward more competitive references. Below is a concise description of common baseline classes.Choose baselines appropriate to your problem and dataset. Start with the simplest (naive) and progress to heuristics, simple models, and SOTA baselines until you establish a realistic target for development and deployment.
Why baselines matter (example)
Suppose a baseline reaches 70% accuracy and your trained model reaches 85% accuracy — a 15 percentage-point improvement. That gap quantifies the model’s added value and helps decide whether extra complexity is justified.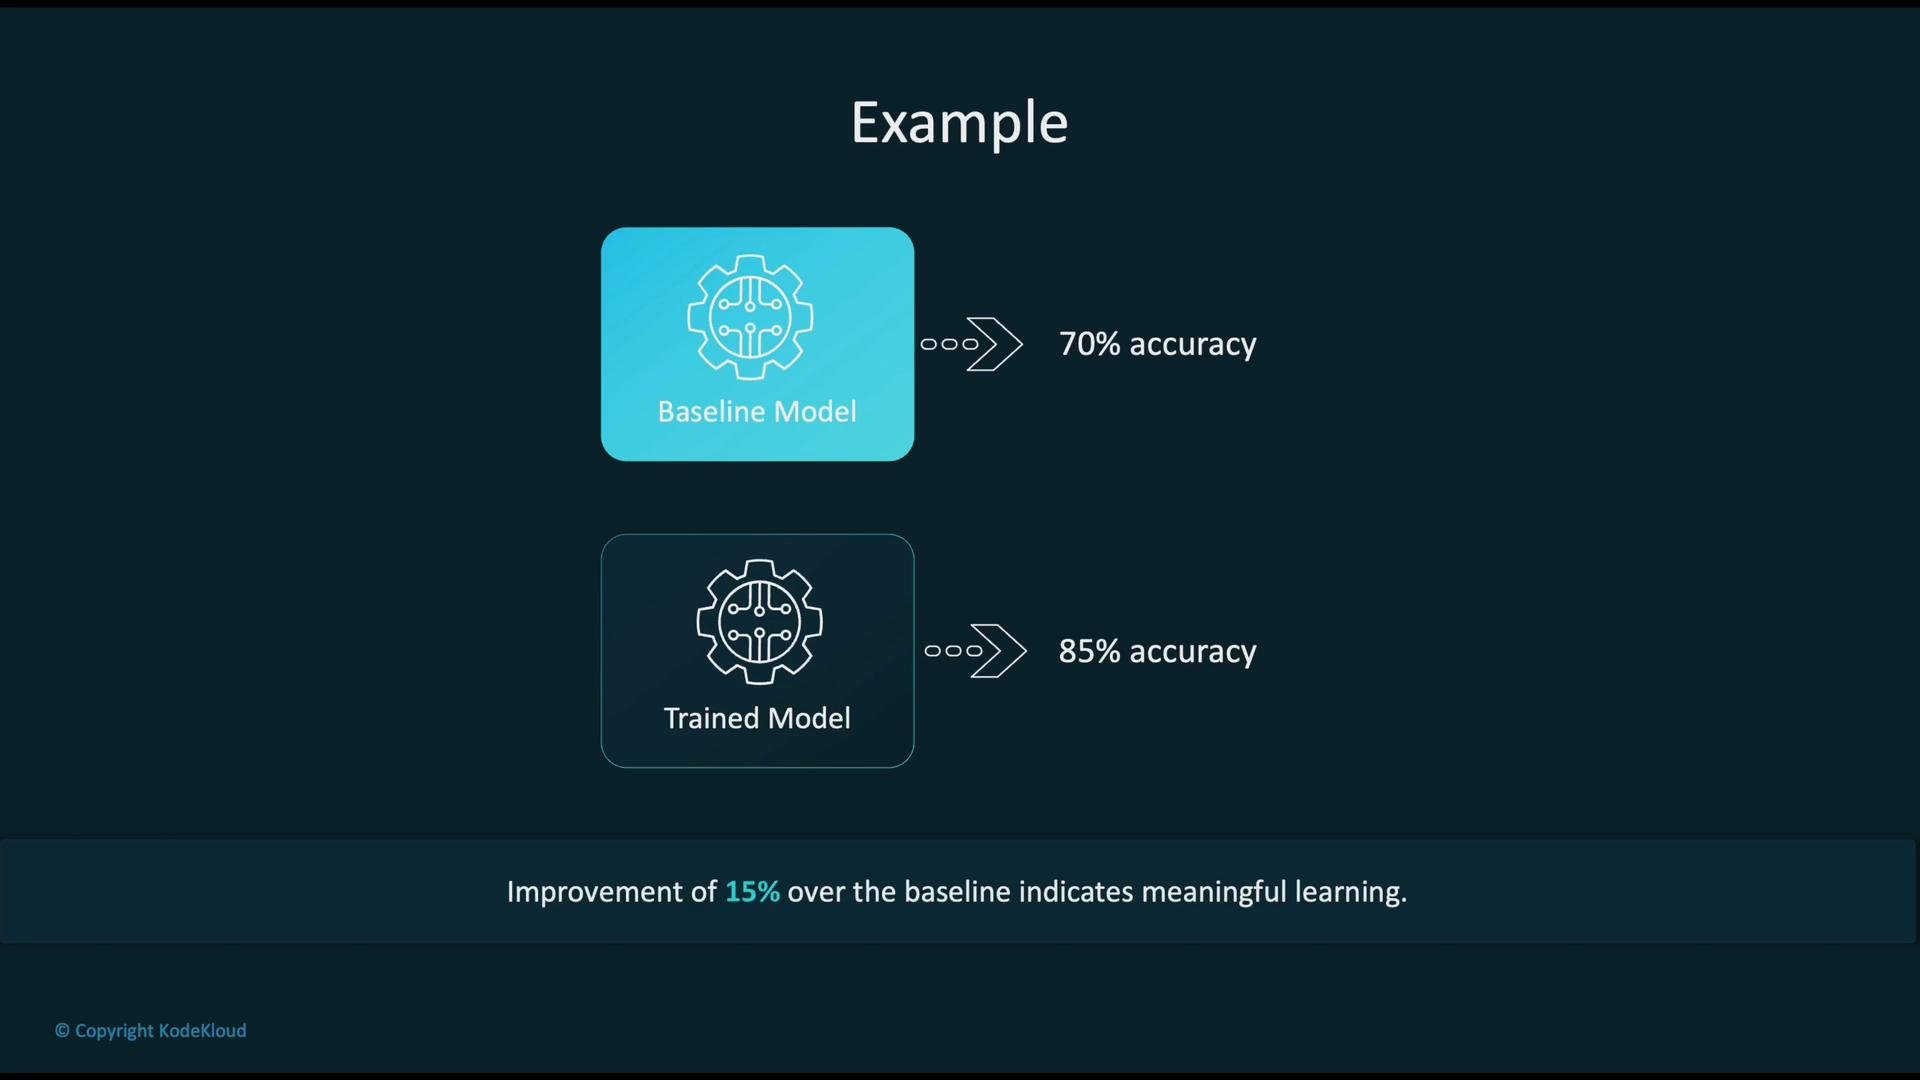
Naive baselines by problem type
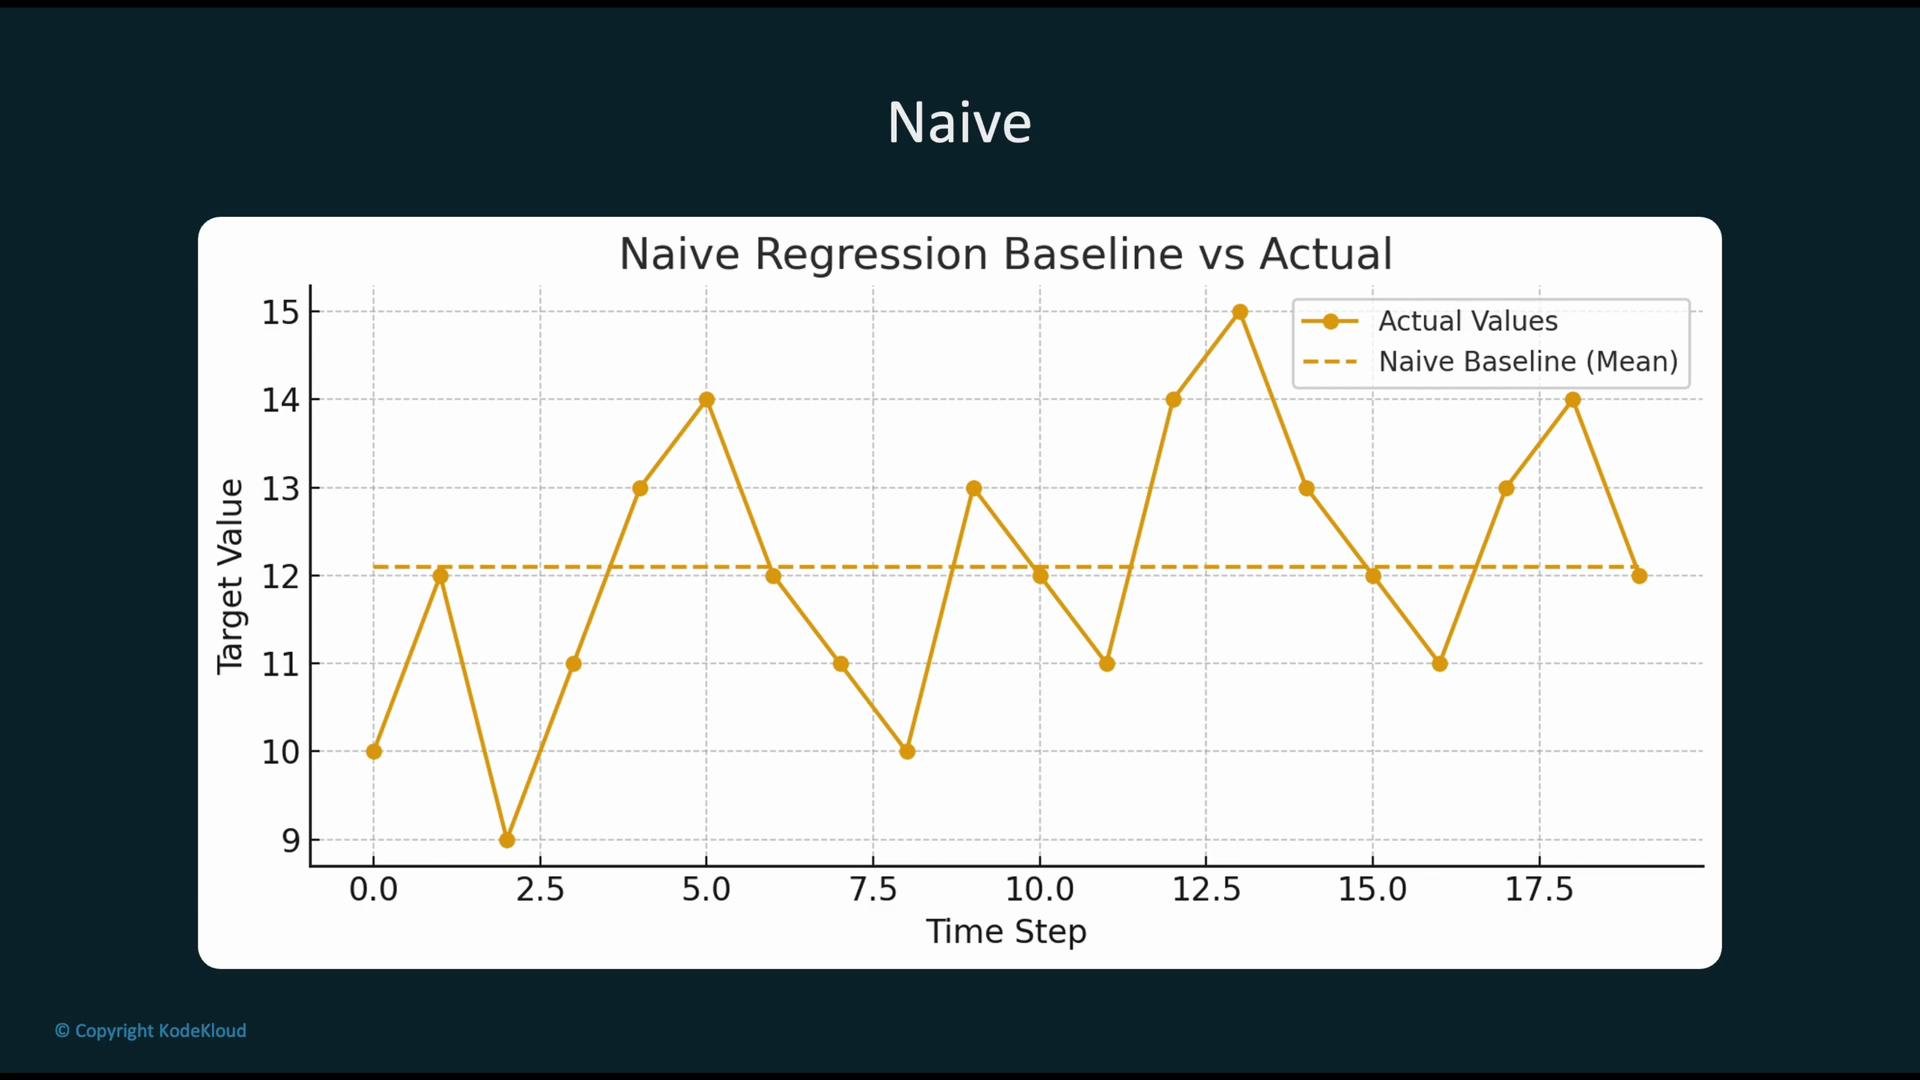
Naive baselines are fast to compute and useful as the first checkpoint. They intentionally ignore patterns in the features and act as a simple reference.
The plot below illustrates a naive regression baseline predicting the global mean as a constant (dashed line) while the actual target values vary over time. This highlights how naive approaches provide a minimal benchmark that more sophisticated models should surpass.
Heuristic baselines
Heuristic baselines apply simple, interpretable rules derived from domain knowledge (for example,y = 2x). They often outperform naive baselines because they encode known relationships and provide a stronger, explainable benchmark. Use these to confirm whether model complexity is adding value beyond simple rules.
Model-based baselines
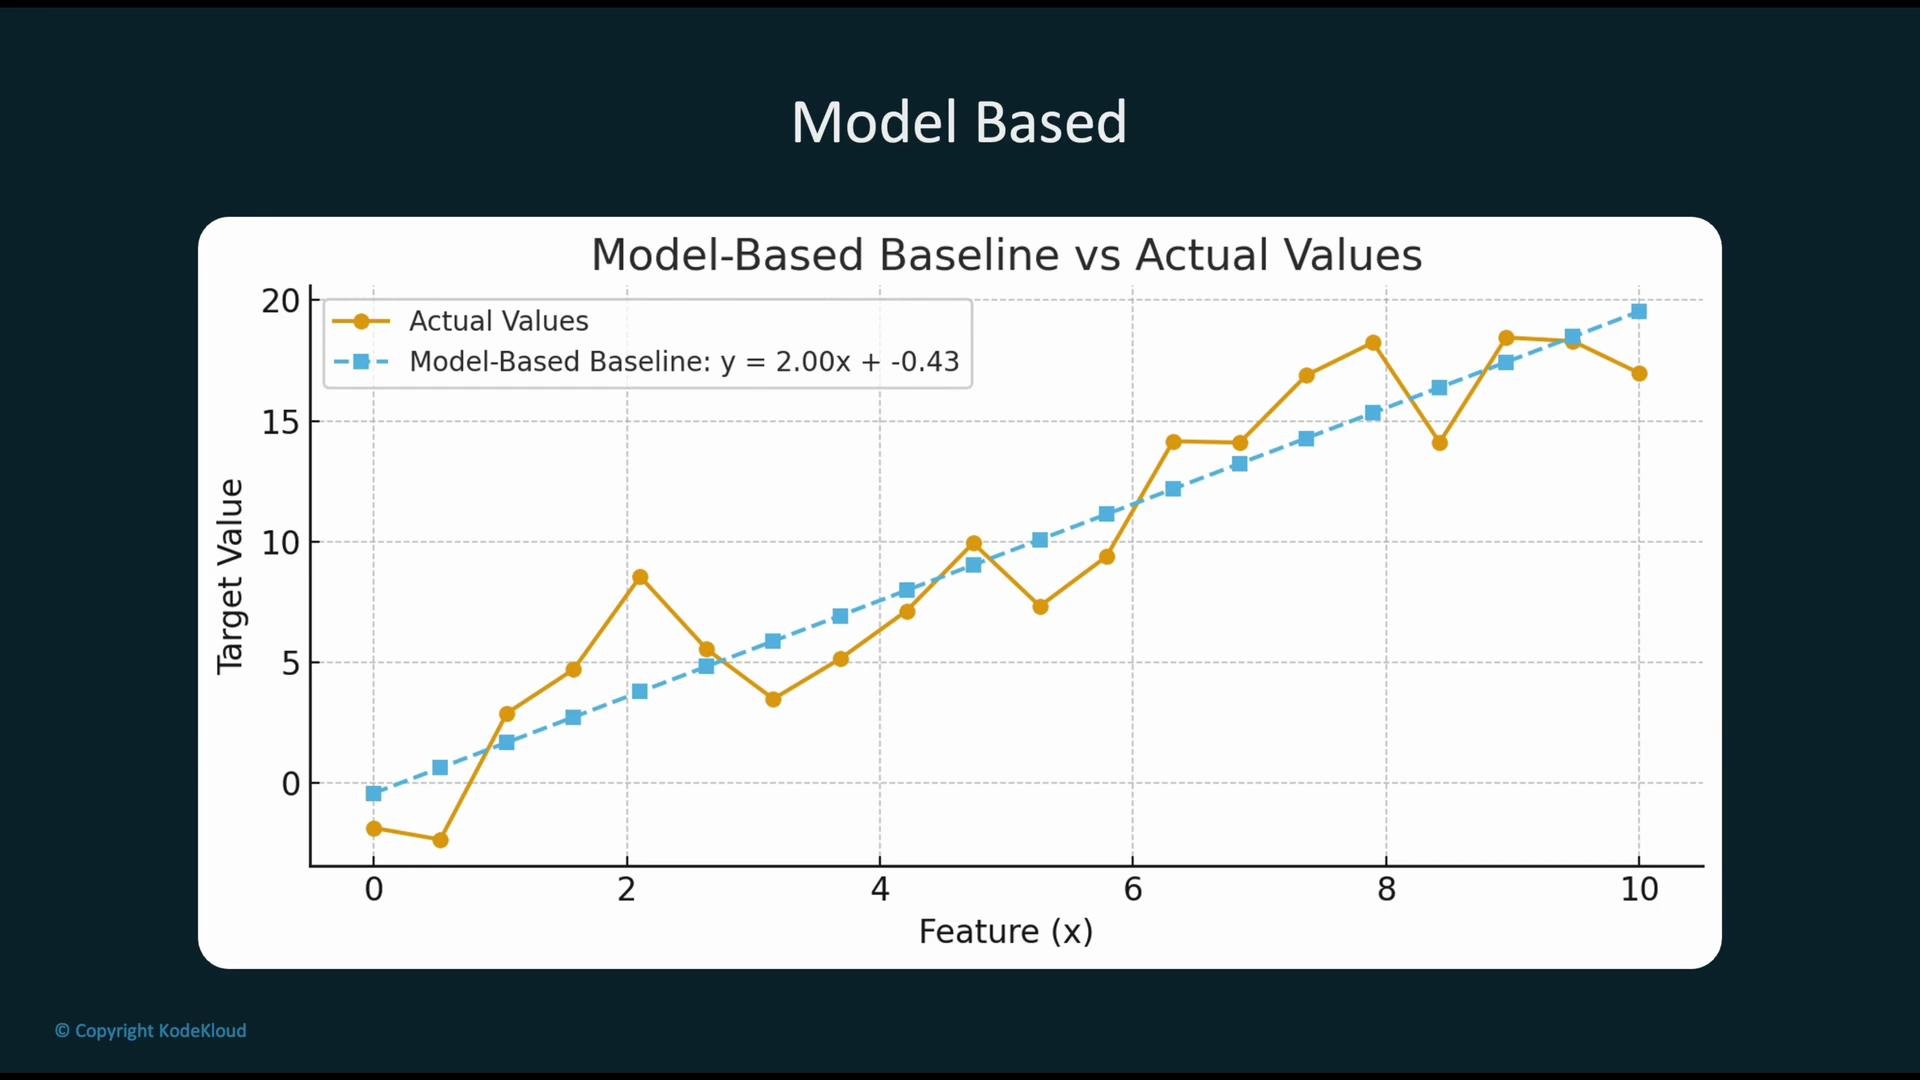
Model-based baselines use basic machine learning algorithms to create a data-adaptive reference. These typically outperform naive and heuristic baselines and are essential for structured data problems. Common simple-model baselines:- Linear regression / logistic regression for tabular data
- Decision stumps (single-level decision trees)
- k-Nearest Neighbors (kNN), often with k=1 or small k
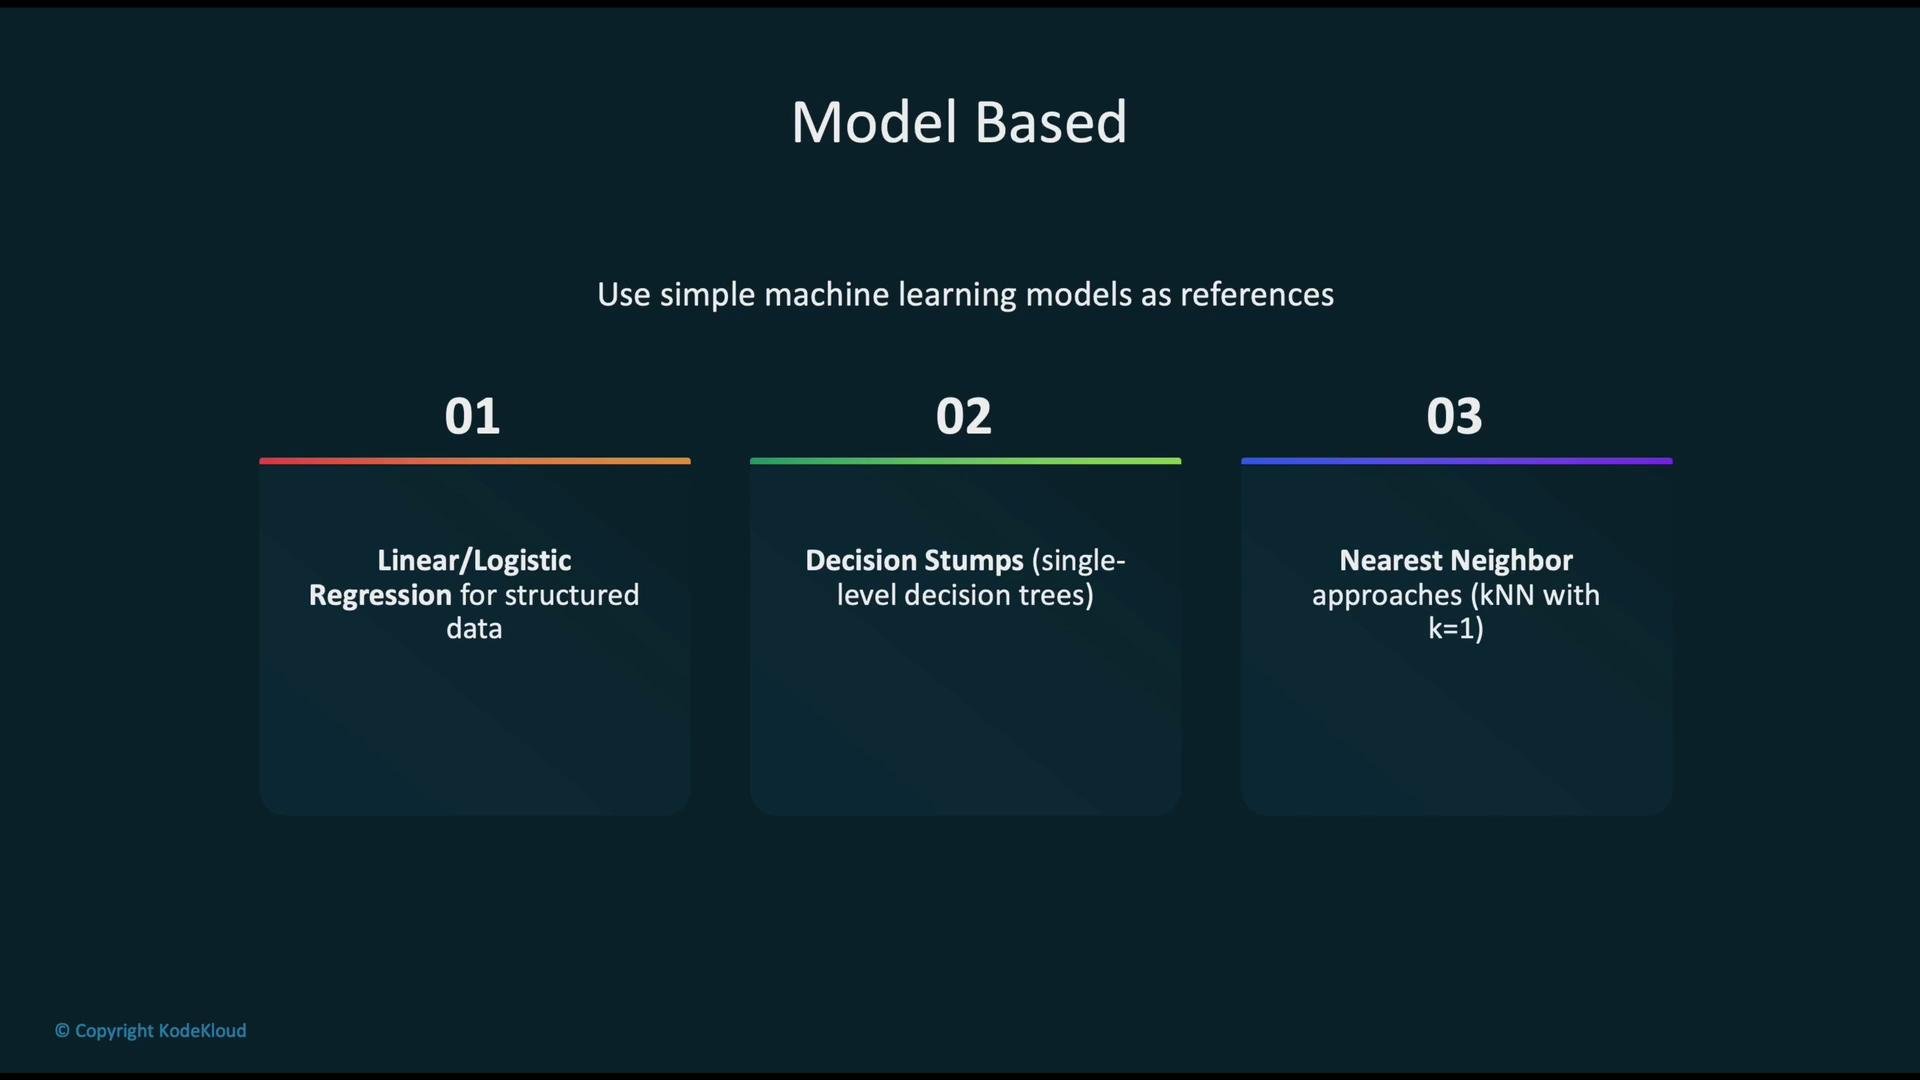
y = 2.00x + 0.43 (dashed line) compared to actual values — a clear, data-driven reference.
State-of-the-art (SOTA) baselines
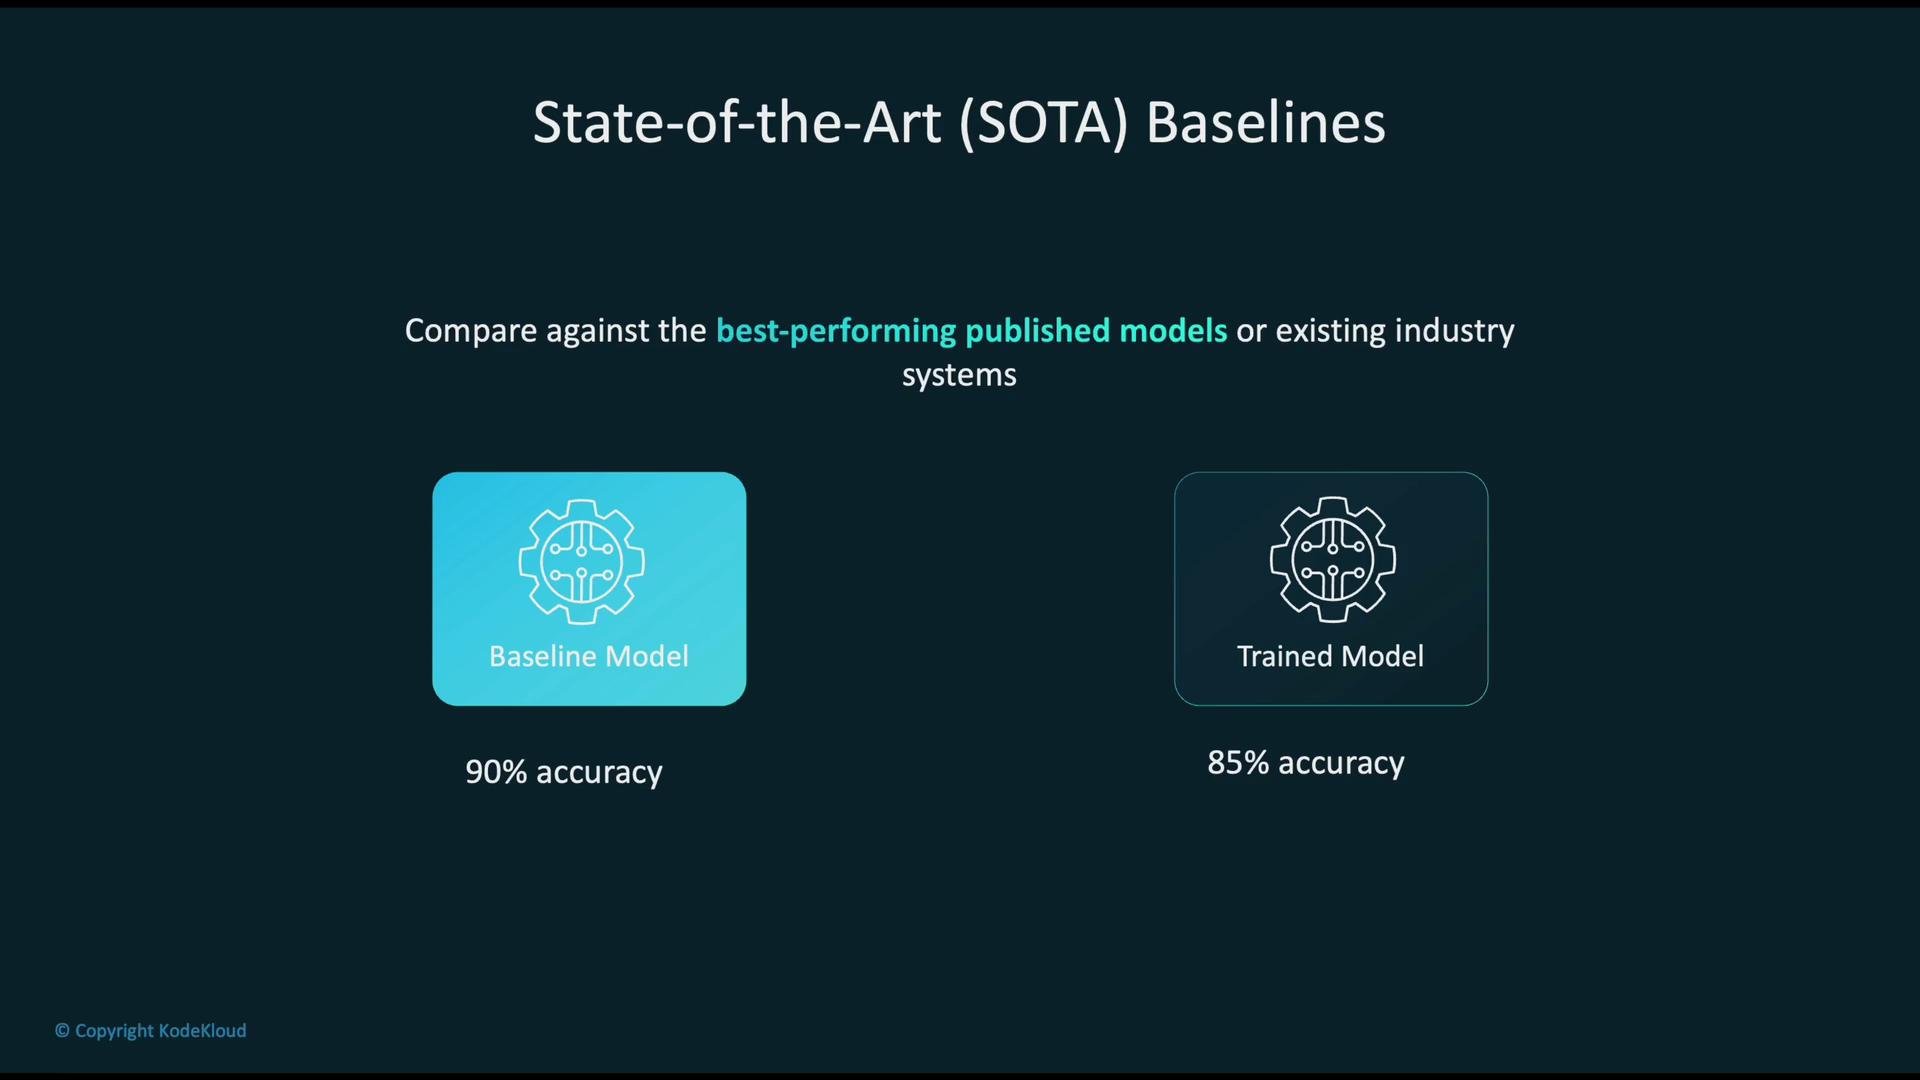
SOTA baselines benchmark your approach against the best published or industry-standard models. These are useful to determine whether your model is competitive:- If SOTA = 90% and your model = 85% → further improvements needed.
- If your model approaches SOTA, you may focus on deployment, inference optimization, or cost/performance trade-offs.
Practical checklist for baselines
- Establish at least one simple baseline (naive or random) before model tuning.
- Iterate: naive → heuristic → simple model → SOTA as needed.
- Use the baseline gap (performance delta) to quantify business value and justify complexity.
- Report baselines alongside model metrics in documentation and model cards for transparency.
- Re-evaluate baselines when data, labels, or business objectives change.