

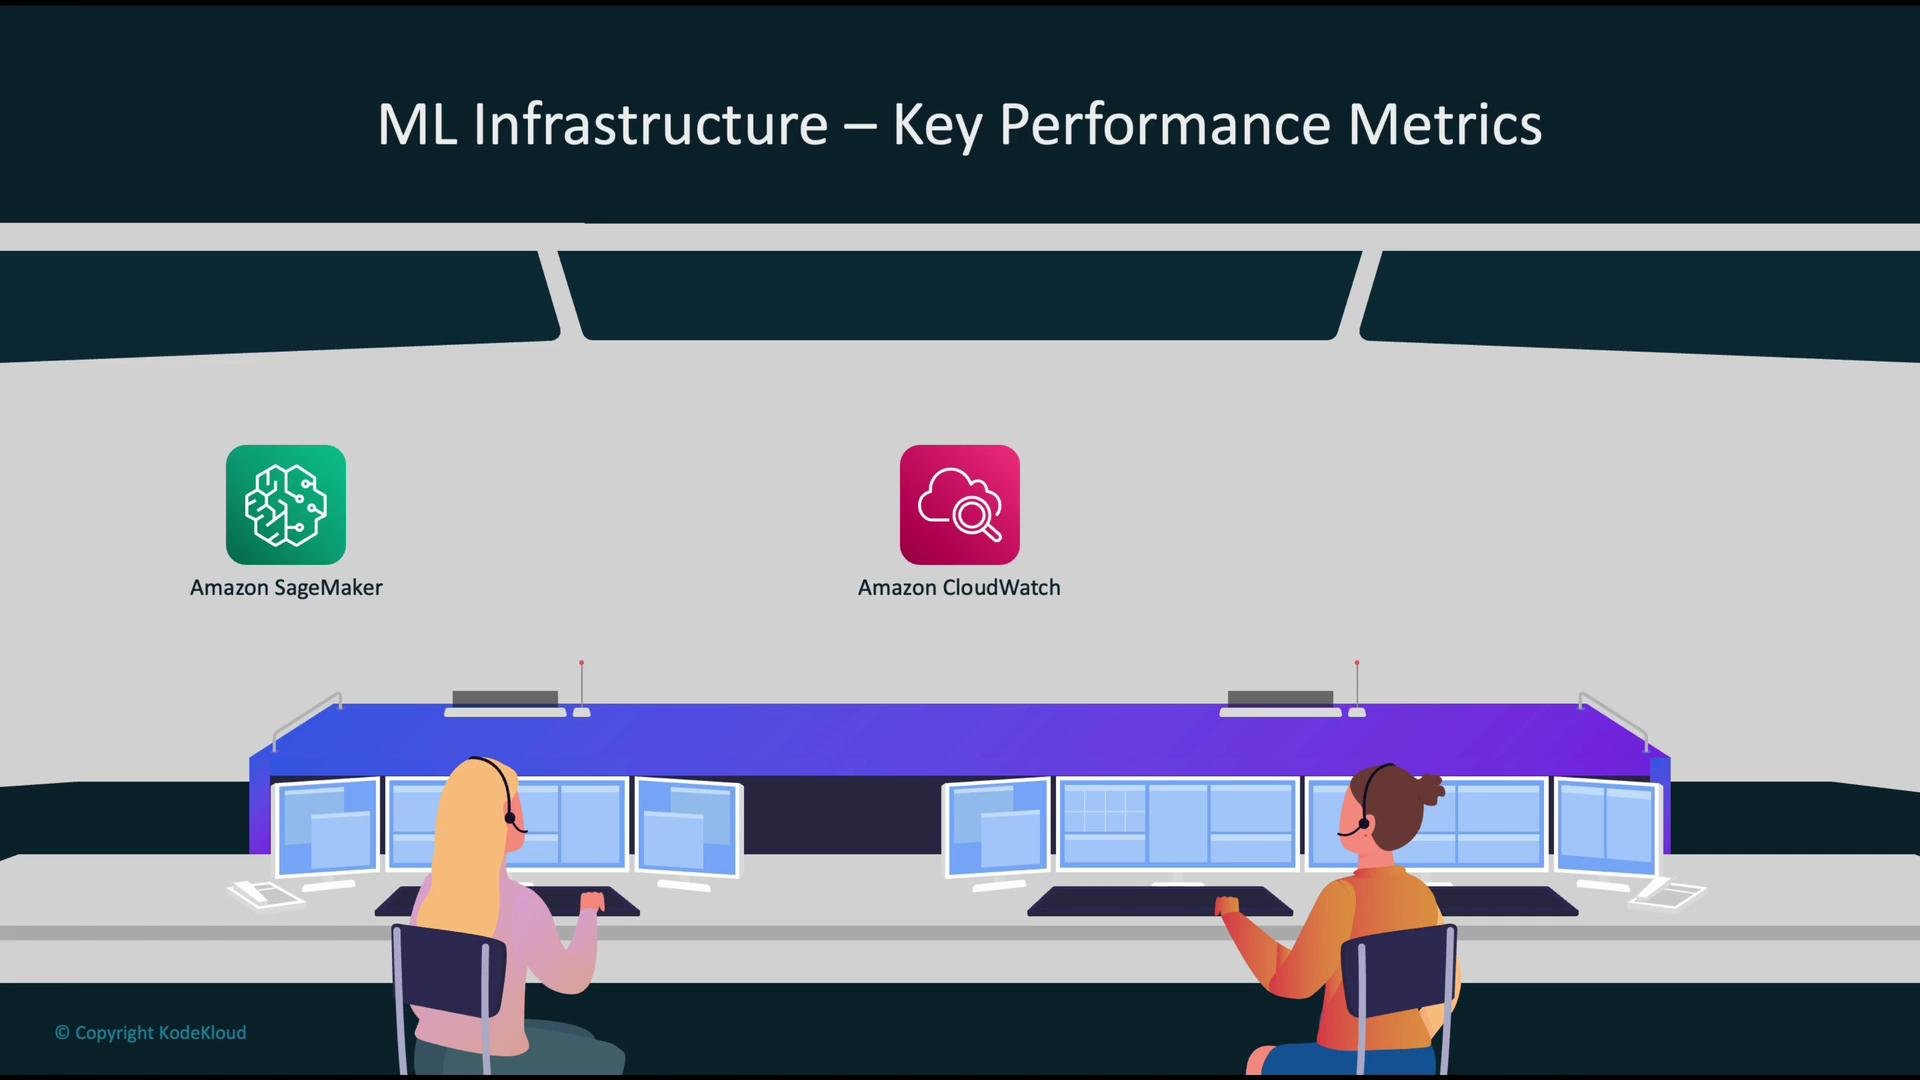
- Models are built, trained, and deployed using Amazon SageMaker.
- Amazon CloudWatch provides centralized monitoring for AWS resources and applications.
- SageMaker Model Monitor detects issues such as data drift and concept drift for deployed models.
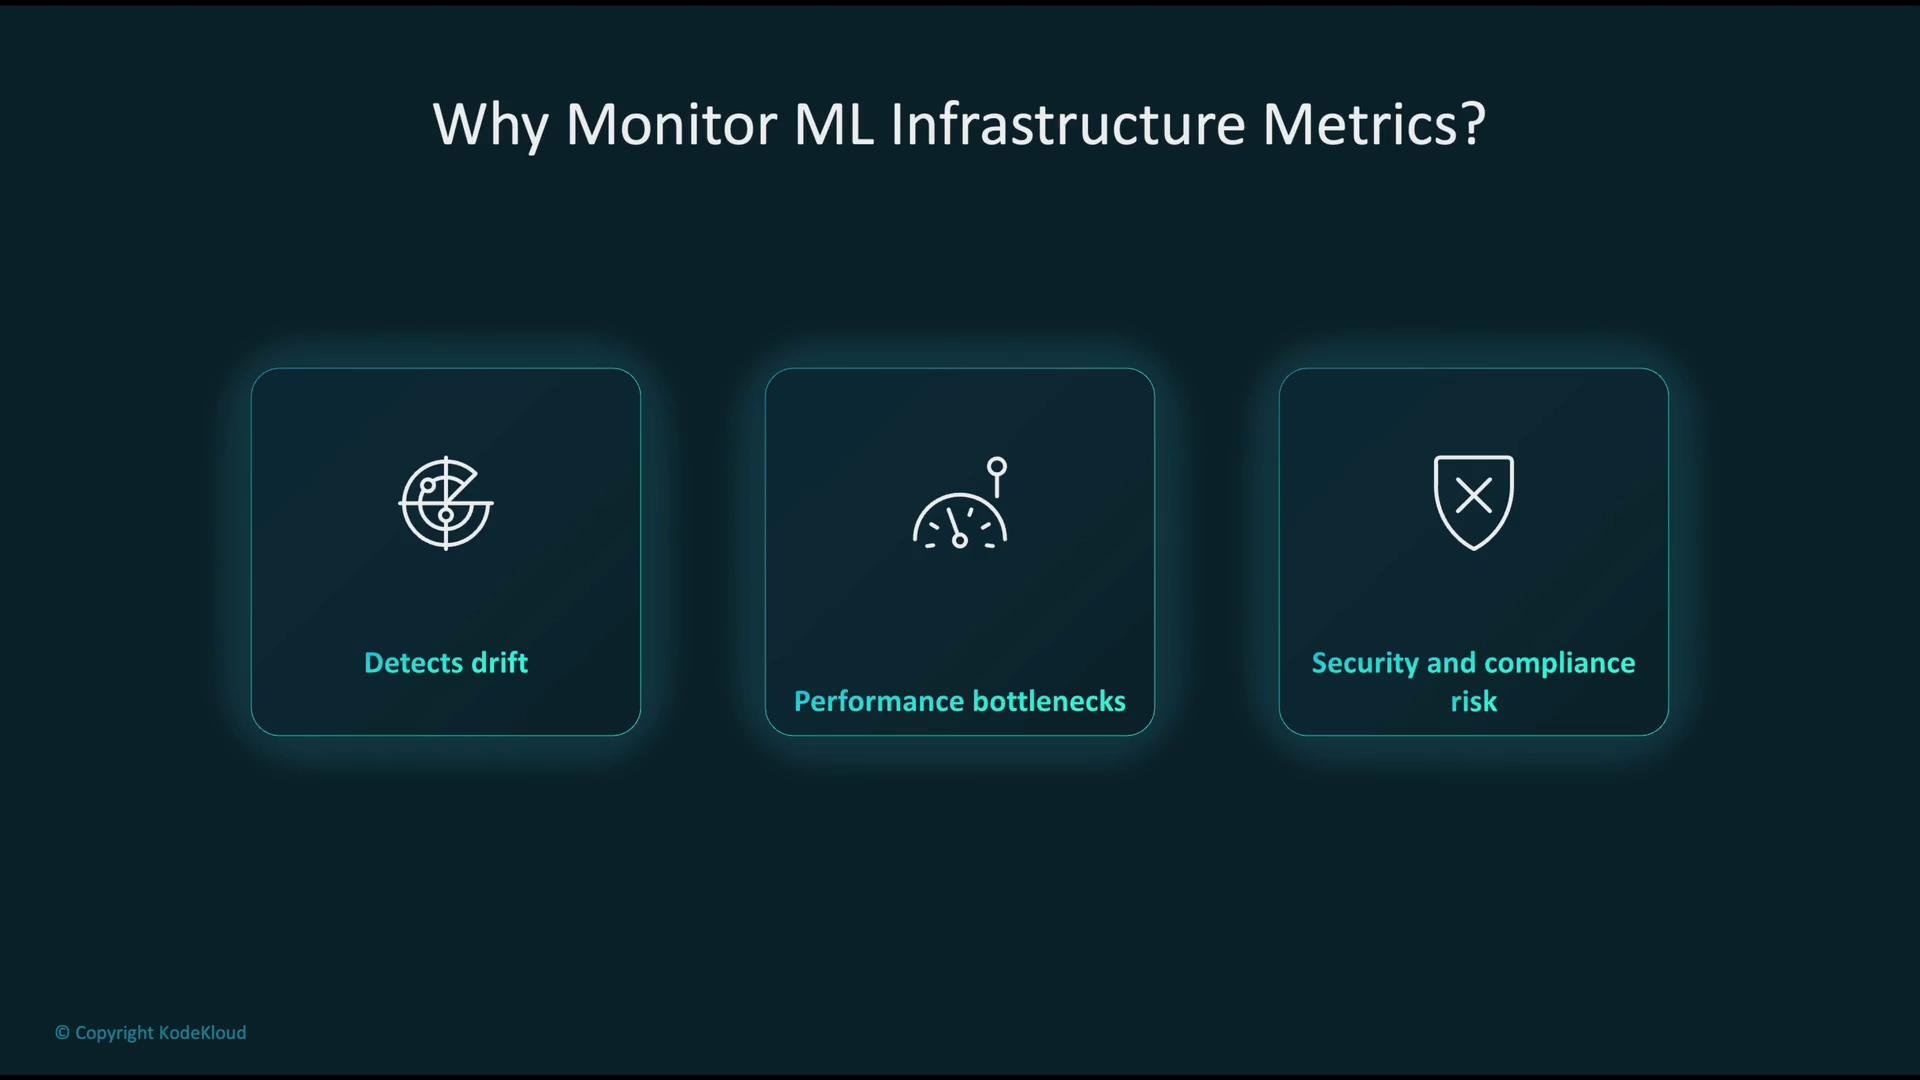
- Detect model and data drift so predictions remain accurate as inputs evolve.
- Identify and resolve performance bottlenecks before they affect users.
- Find and mitigate security, access, and compliance risks early.
- CloudWatch collects infrastructure and application metrics (CPU, network, latency, errors). Note: memory and some host-level metrics often require the CloudWatch agent or custom metrics.
- SageMaker Model Monitor samples inference payloads, compares them to precomputed baselines, and produces monitoring reports. Model Monitor writes reports and alerts to
S3and publishes metrics/logs to CloudWatch. - Application tracing with AWS X-Ray provides distributed traces of requests through your application; correlating CloudWatch metrics with X-Ray traces gives a unified view of both model and application health. See the AWS X-Ray developer guide for details: https://docs.aws.amazon.com/xray/latest/devguide/aws-xray.html
- CI/CD pipelines (for example, AWS CodePipeline) automate safe deployments. AWS Trusted Advisor provides operational recommendations based on resource usage and best practices: https://docs.aws.amazon.com/awssupport/latest/user/trustedadvisor/what-is-trusted-advisor.html
Operational performance metrics to monitor continuously
System resource metrics to inspect regularly
CI/CD for safe, repeatable deployments
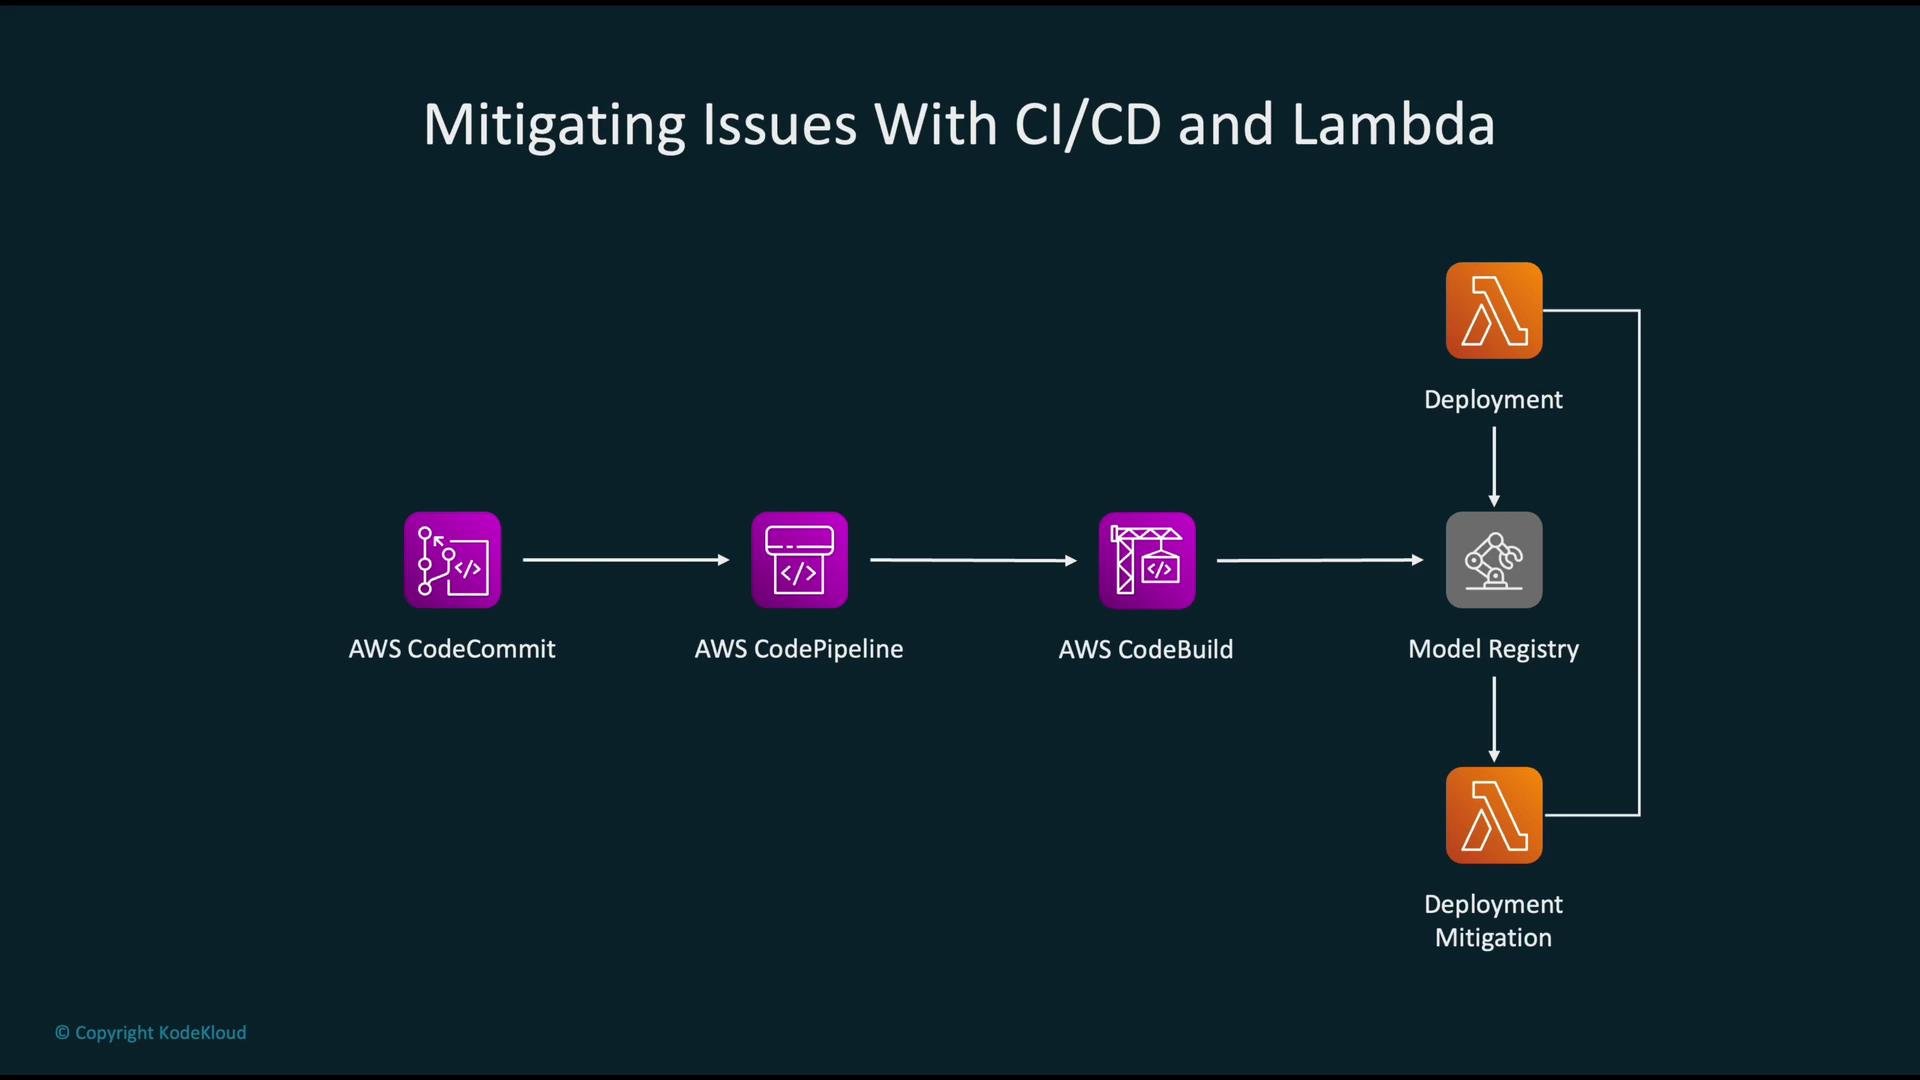
A robust CI/CD pipeline ensures model and application changes are deployed consistently and auditable:
- Developers push code to a source repository (e.g., AWS CodeCommit). More: https://docs.aws.amazon.com/codecommit/latest/userguide/welcome.html
- AWS CodePipeline triggers the pipeline.
- AWS CodeBuild builds and packages artifacts (model packages, Lambda functions). More: https://docs.aws.amazon.com/codebuild/latest/userguide/welcome.html
- Built artifacts are registered into a Model Registry for versioning and governance (see SageMaker Model Registry): https://docs.aws.amazon.com/sagemaker/latest/dg/model-registry.html
- Deployments proceed to the target environment (Lambda or SageMaker endpoints) with automated validation and rollback on failures.
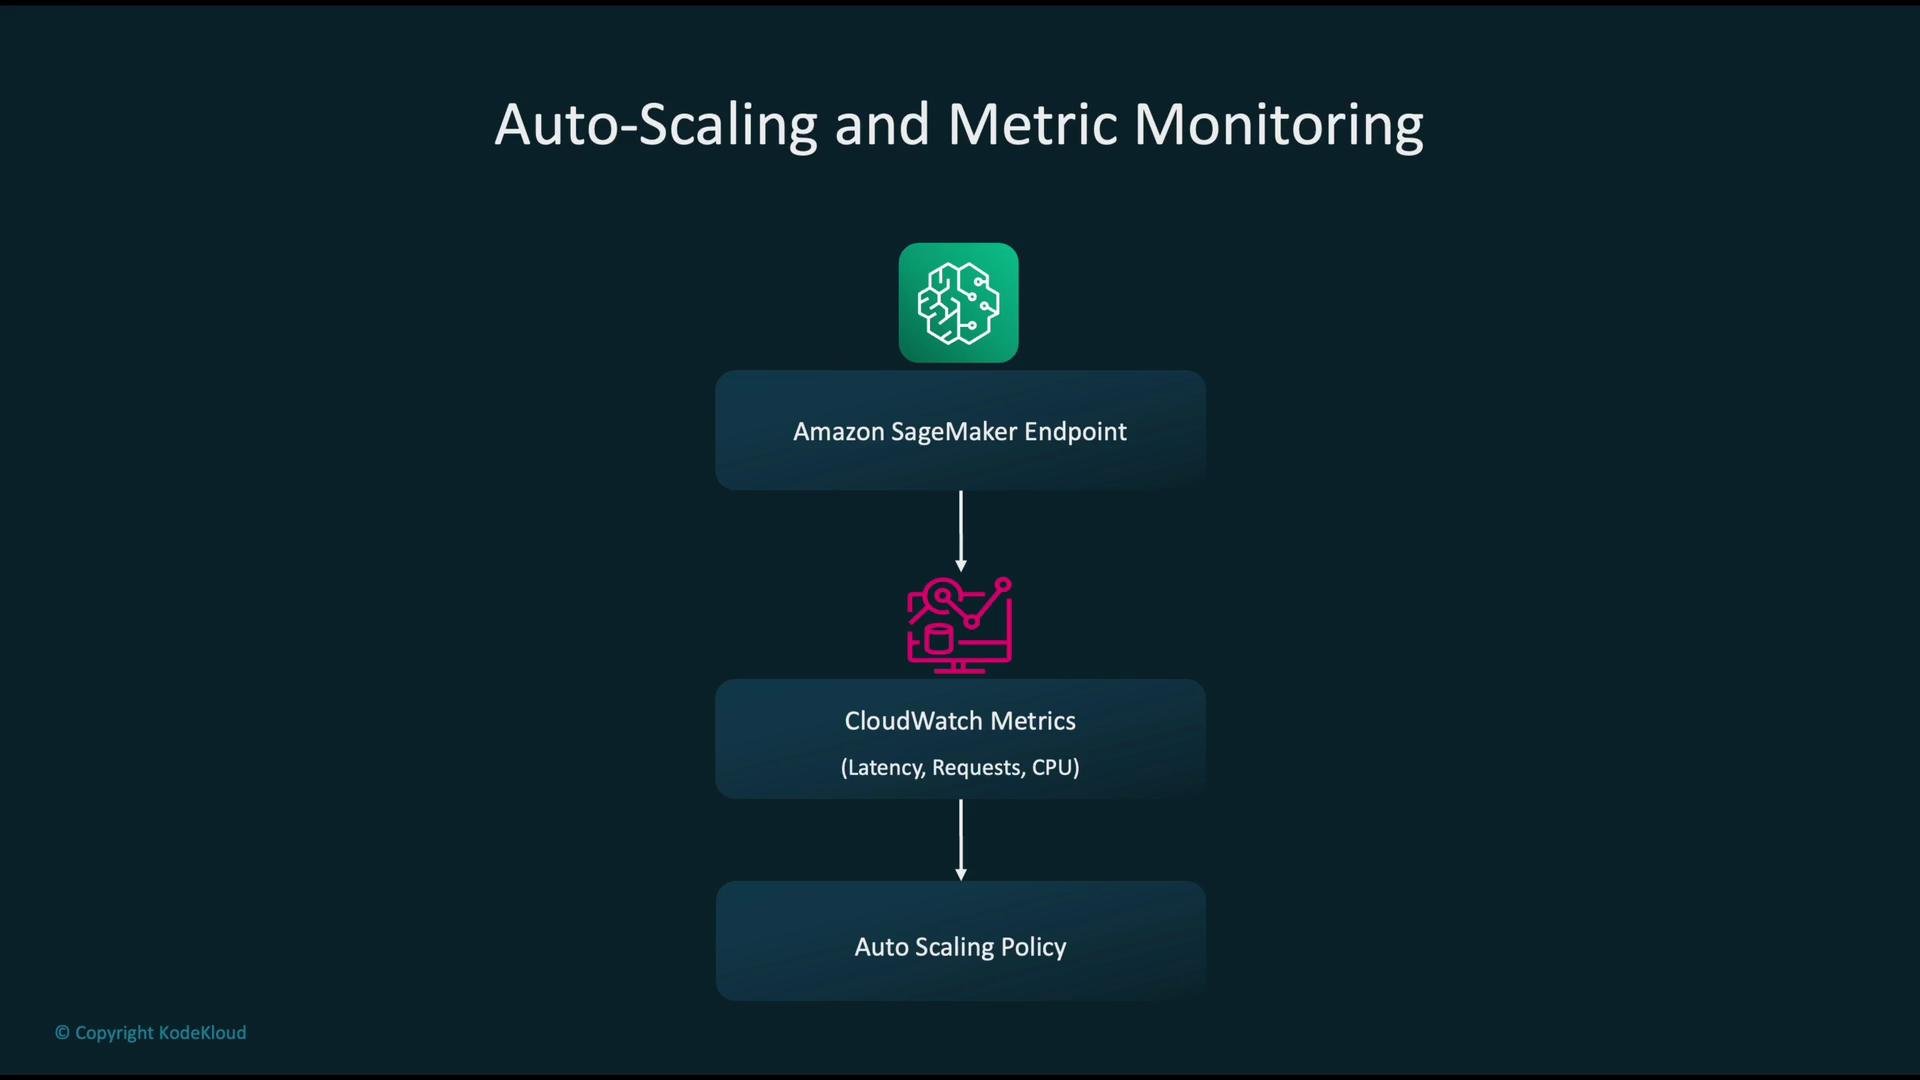
- SageMaker endpoints emit metrics such as invocation count, model latency, and instance CPU utilization.
- CloudWatch evaluates metrics against scaling policies.
- Auto Scaling policies add or remove instances when thresholds (e.g., average latency or CPU utilization) cross targets. See Amazon EC2 Auto Scaling overview: https://docs.aws.amazon.com/autoscaling/ec2/userguide/what-is-amazon-ec2-auto-scaling.html
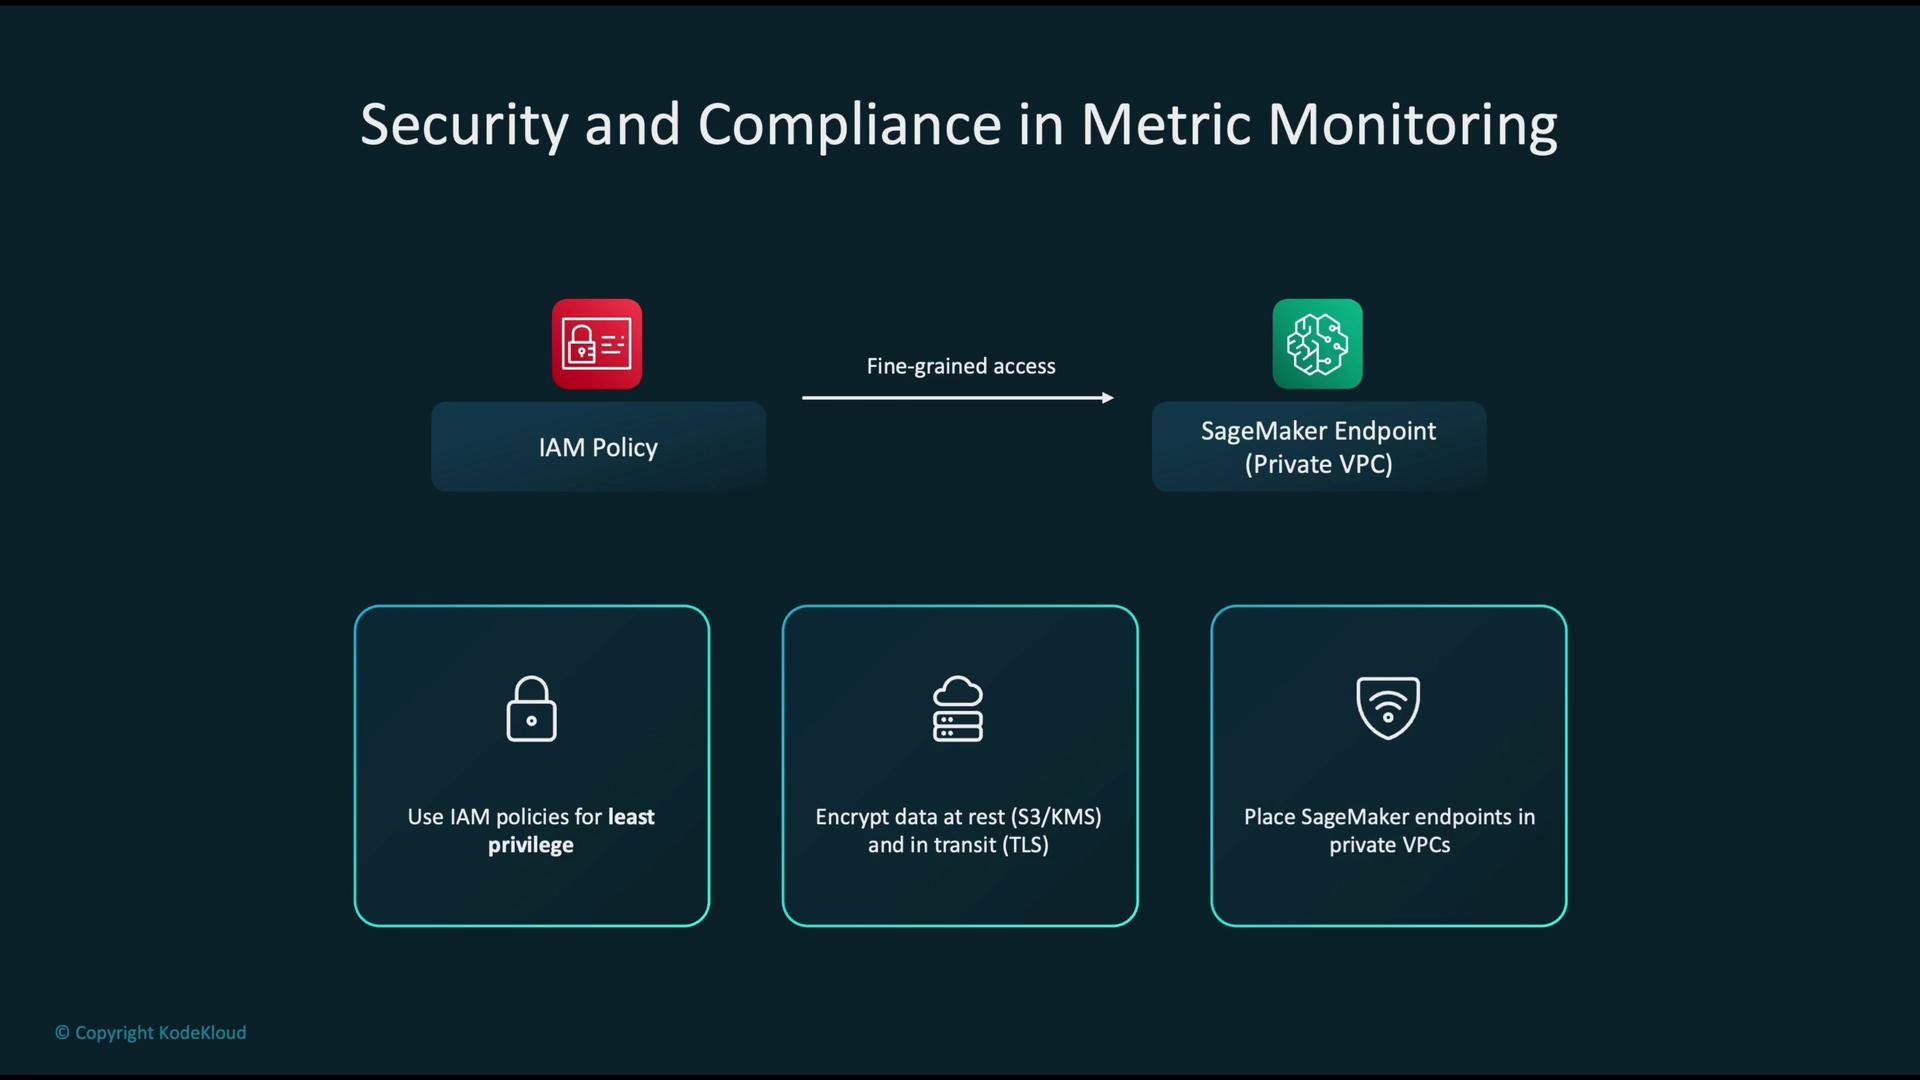
- Access control: Use IAM policies with least privilege to limit who can read metrics, modify endpoints, or trigger deployments.
- Encryption: Encrypt data at rest (S3 + AWS KMS) and in transit. See AWS KMS overview: https://docs.aws.amazon.com/kms/latest/developerguide/overview.html
- Network isolation: Place endpoints in private subnets within a VPC and use security groups/NACLs to control access.
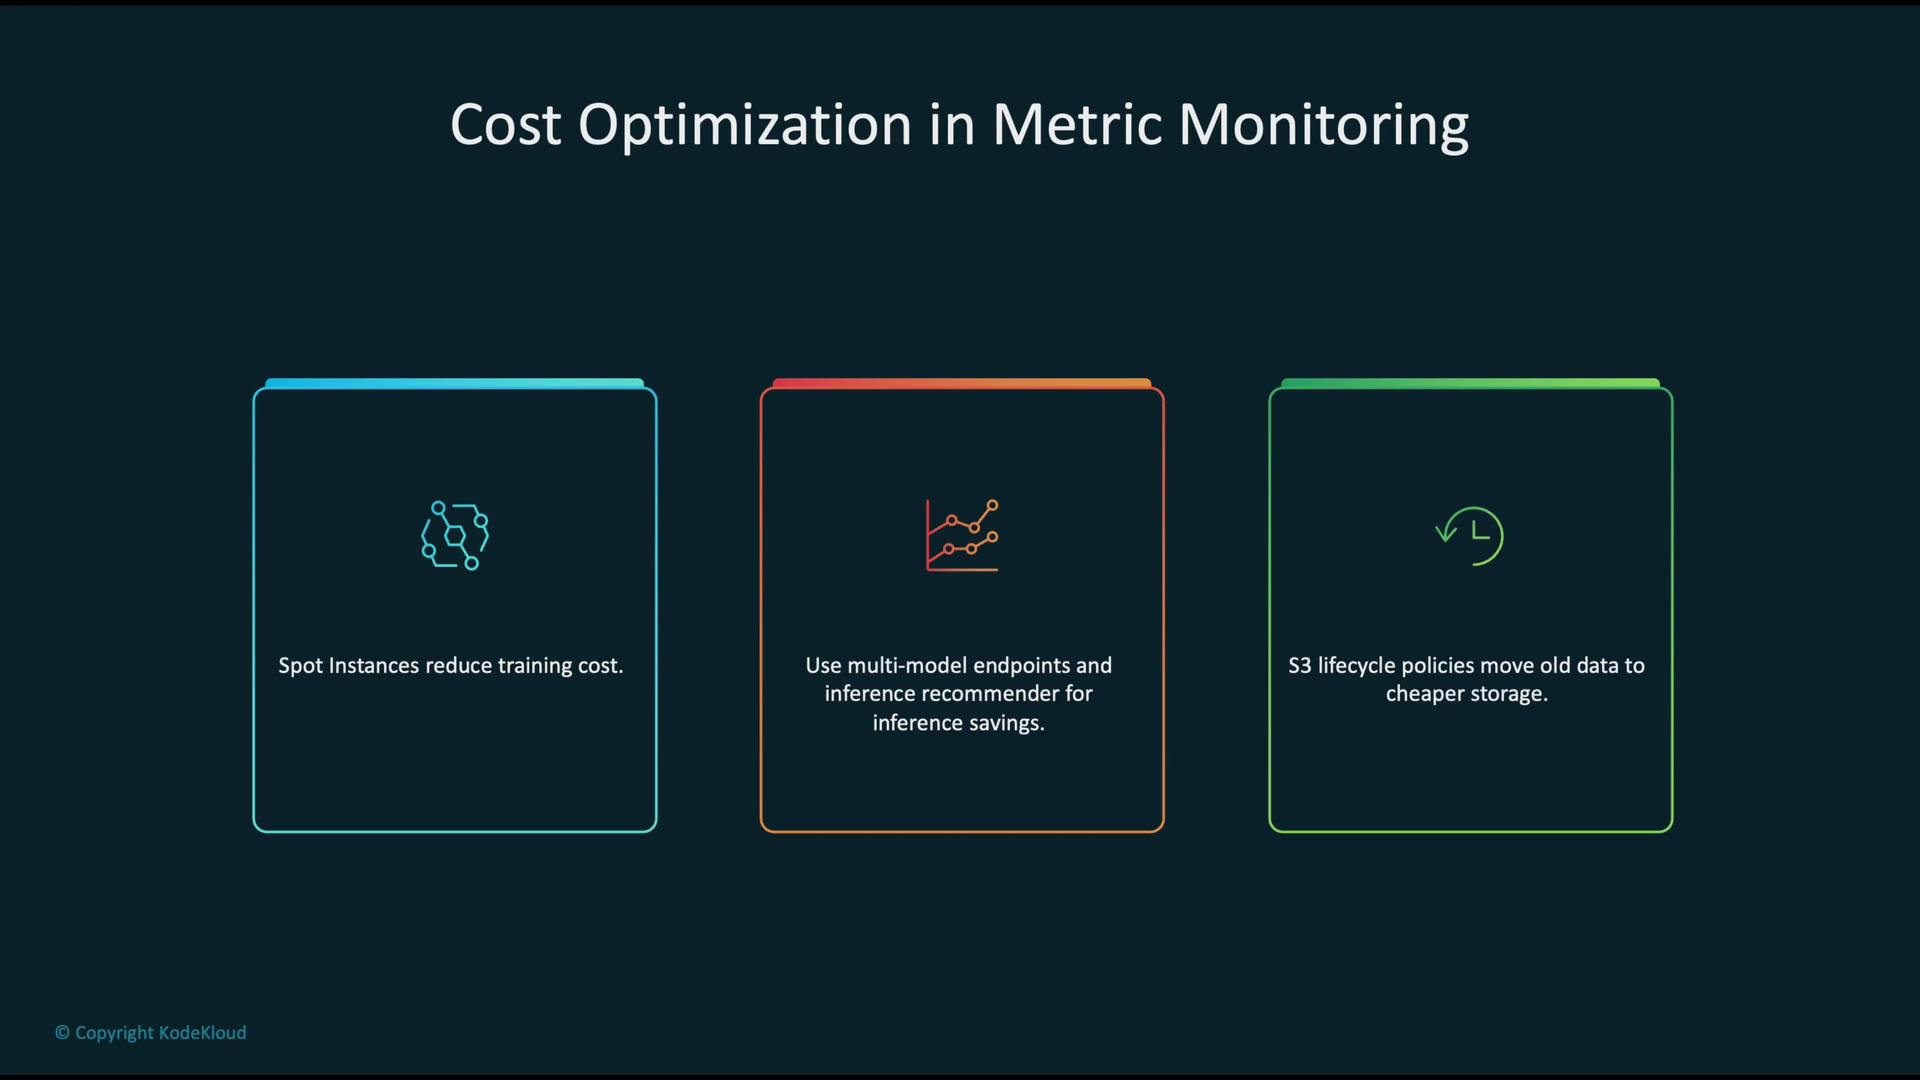
- Use Spot Instances for interruptible training jobs to reduce cost. See Spot Instances: https://docs.aws.amazon.com/AWSEC2/latest/UserGuide/using-spot-instances.html
- For inference, consider multi-model endpoints and use the Inference Recommender to pick cost-effective instance types and configurations:
- Multi-model endpoints: https://docs.aws.amazon.com/sagemaker/latest/dg/multi-model-endpoints.html
- Inference Recommender: https://docs.aws.amazon.com/sagemaker/latest/dg/inference-recommender.html
- Apply
S3lifecycle policies to transition older monitoring and training artifacts to lower-cost storage classes: https://docs.aws.amazon.com/AmazonS3/latest/userguide/object-lifecycle-mgmt.html
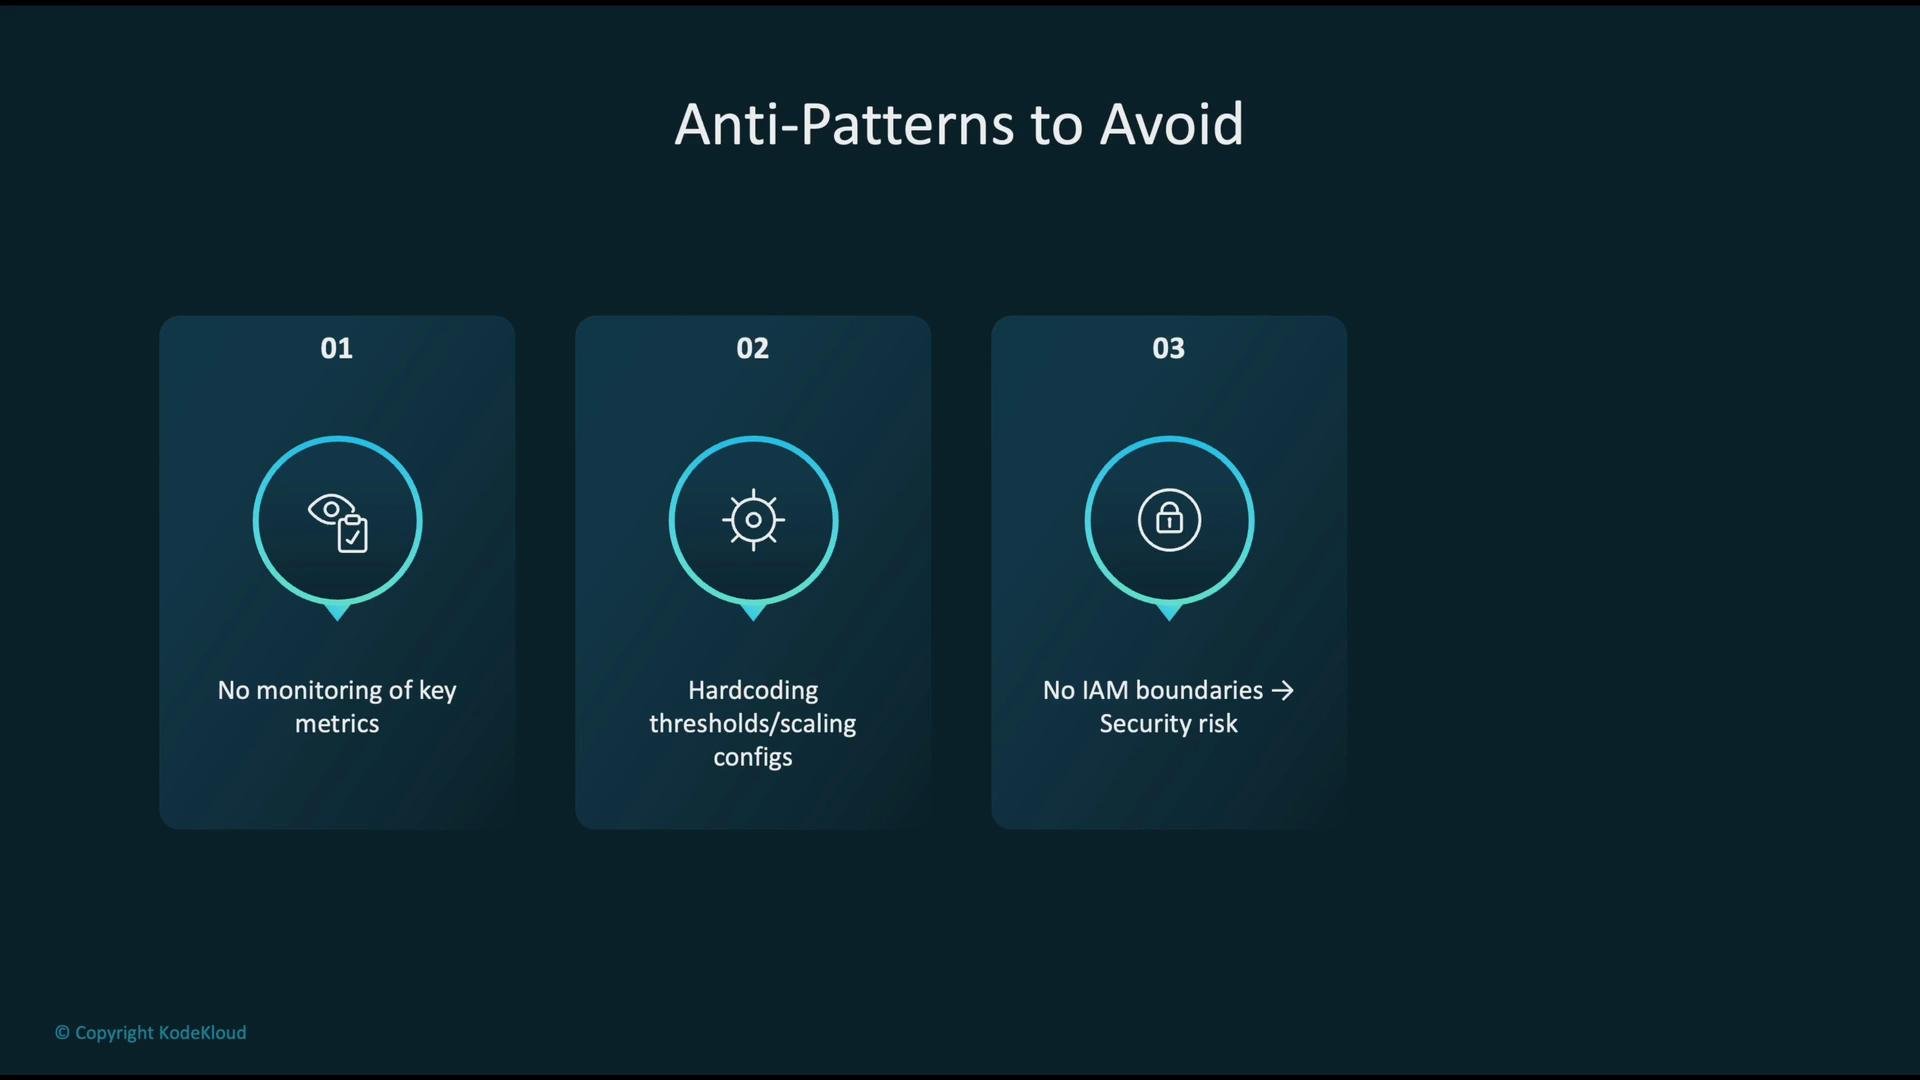
- Not monitoring key metrics — operating blind increases outage and model quality risk.
- Hardcoding thresholds and scaling values — prevents dynamic, data-driven scaling; prefer parameterized policies.
- Overly broad IAM permissions — unnecessary access increases security exposure.
- Ignoring model drift — leads to stale models that no longer reflect real-world data.
Avoid hardcoded scaling thresholds and overly permissive IAM roles—both are common sources of operational and security incidents.
- Continuously monitor both model-specific and infrastructure metrics (latency, throughput, errors, CPU/GPU/memory/disk/network, and model drift indicators).
- Automate operations with CI/CD and infrastructure-as-code so deployments are repeatable, testable, and auditable.
- Enforce least-privilege access controls and encrypt sensitive data to meet security and compliance requirements.
- Proactively optimize costs using Spot Instances for training, efficient inference patterns (multi-model endpoints), and S3 lifecycle policies for older artifacts.
A combined approach—instrumenting models and applications, automating lifecycle management, and enforcing security—delivers reliable, efficient, and cost-effective ML systems.
- Amazon SageMaker
- Amazon CloudWatch
- SageMaker Model Monitor
- AWS X-Ray developer guide: https://docs.aws.amazon.com/xray/latest/devguide/aws-xray.html
- AWS Trusted Advisor overview: https://docs.aws.amazon.com/awssupport/latest/user/trustedadvisor/what-is-trusted-advisor.html
- SageMaker Model Registry: https://docs.aws.amazon.com/sagemaker/latest/dg/model-registry.html
- AWS KMS overview: https://docs.aws.amazon.com/kms/latest/developerguide/overview.html
- Spot Instances: https://docs.aws.amazon.com/AWSEC2/latest/UserGuide/using-spot-instances.html
- S3 Lifecycle Management: https://docs.aws.amazon.com/AmazonS3/latest/userguide/object-lifecycle-mgmt.html