In this lesson we cover how to monitor workflows for anomalies so you can detect deviations early and keep systems operating as expected. We combine several AWS services to build an end-to-end anomaly monitoring and response pipeline:
  • Amazon CloudWatch for observability and anomaly detection
  • Amazon SageMaker (Model Monitor & Clarify) for data and model drift/bias detection
  • AWS Lambda for automated remediation or notifications
  • AWS CodePipeline for CI/CD observability and stability
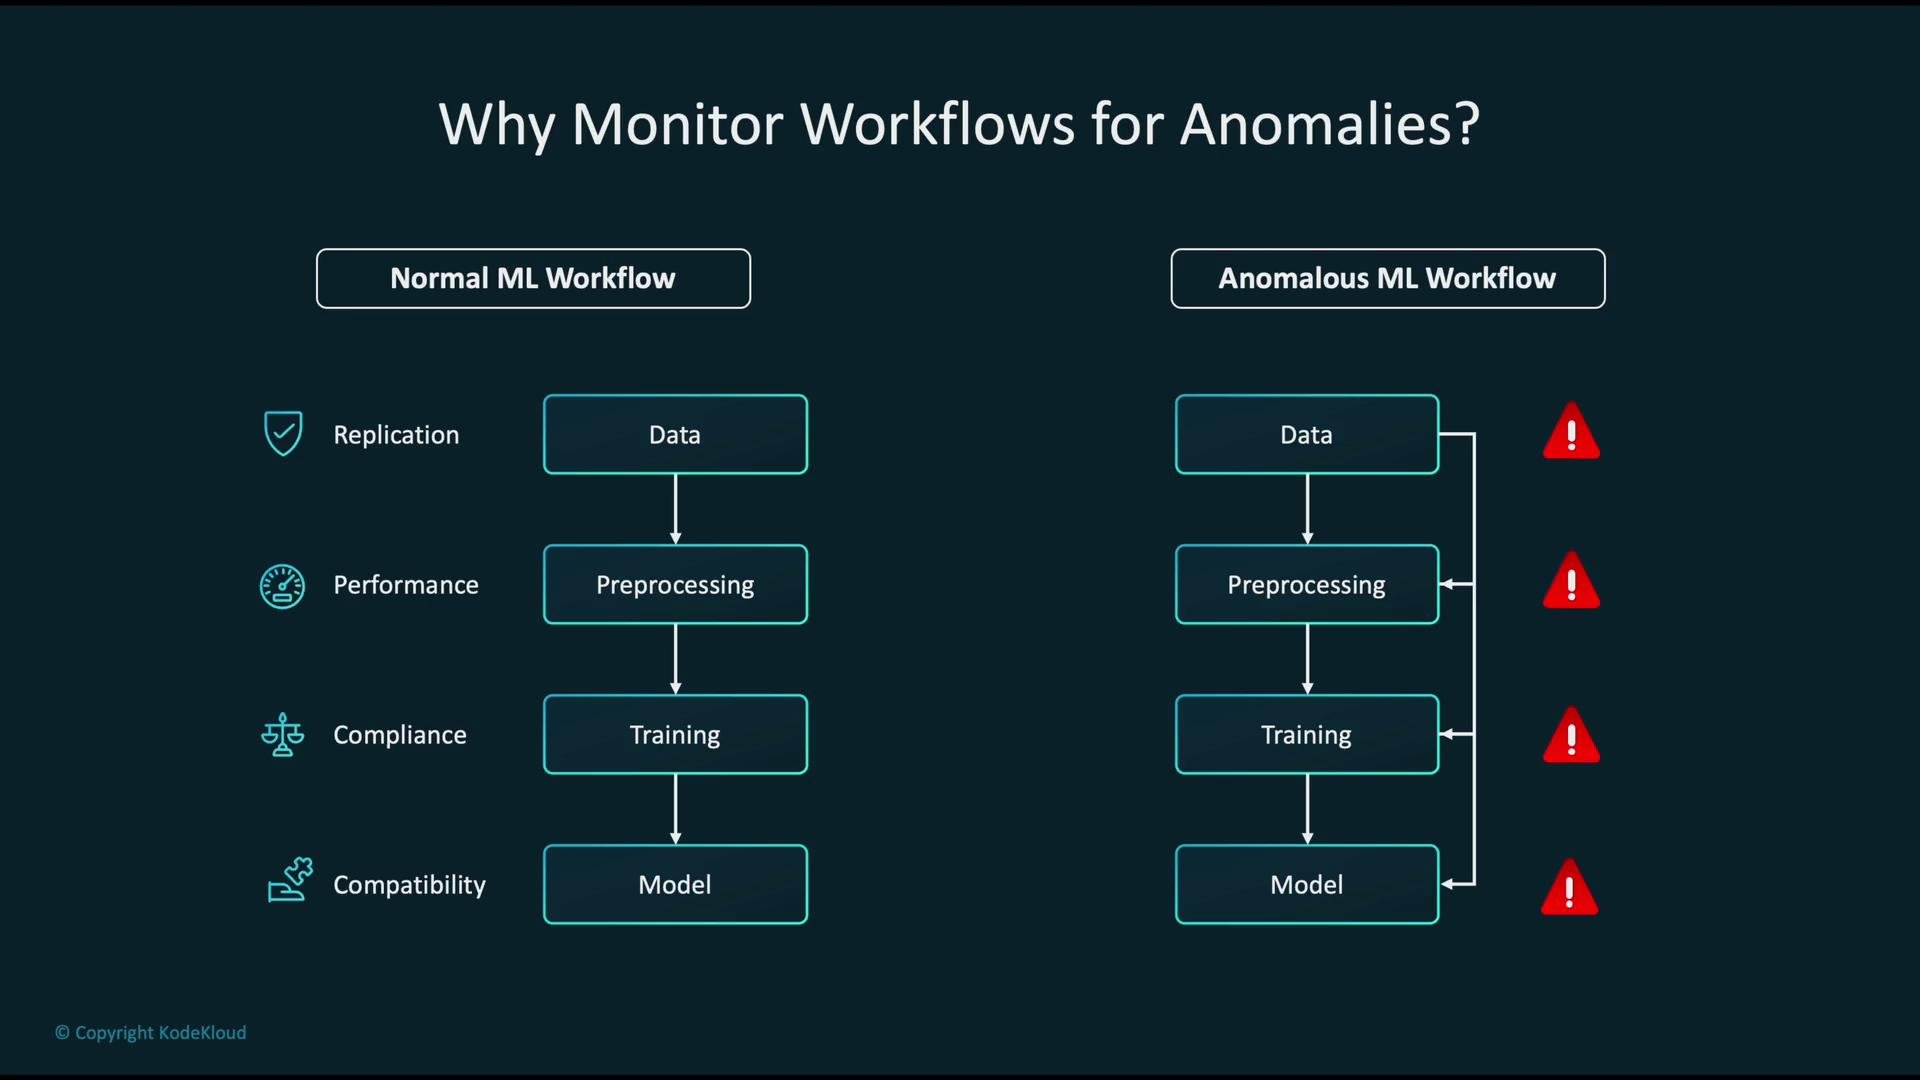
Below is a visual comparison of a clean ML workflow versus the same workflow with anomalies that can appear at any stage—from raw data to preprocessing, training, and model inference. Monitoring helps you catch issues in data preprocessing, training, or model behavior before they impact production.
The image compares a normal versus an anomalous machine learning workflow, highlighting different stages like data, preprocessing, training, and model, with warnings on the anomalous side.
Monitoring ensures you maintain replication, performance, compliance, and compatibility across the ML lifecycle. Core AWS components for anomaly monitoring
  • Amazon CloudWatch: collects metrics, logs, and includes built-in ML (Anomaly Detection) to surface unusual patterns.
  • SageMaker Model Monitor & SageMaker Clarify: analyze predictions and inputs to detect drift, quality degradation, or bias and produce findings.
  • AWS CodePipeline: automates CI/CD and emits operational metrics for pipeline health monitoring.
  • AWS Lambda: automates responses (notifications, mitigation, rollback, or pausing workflows).
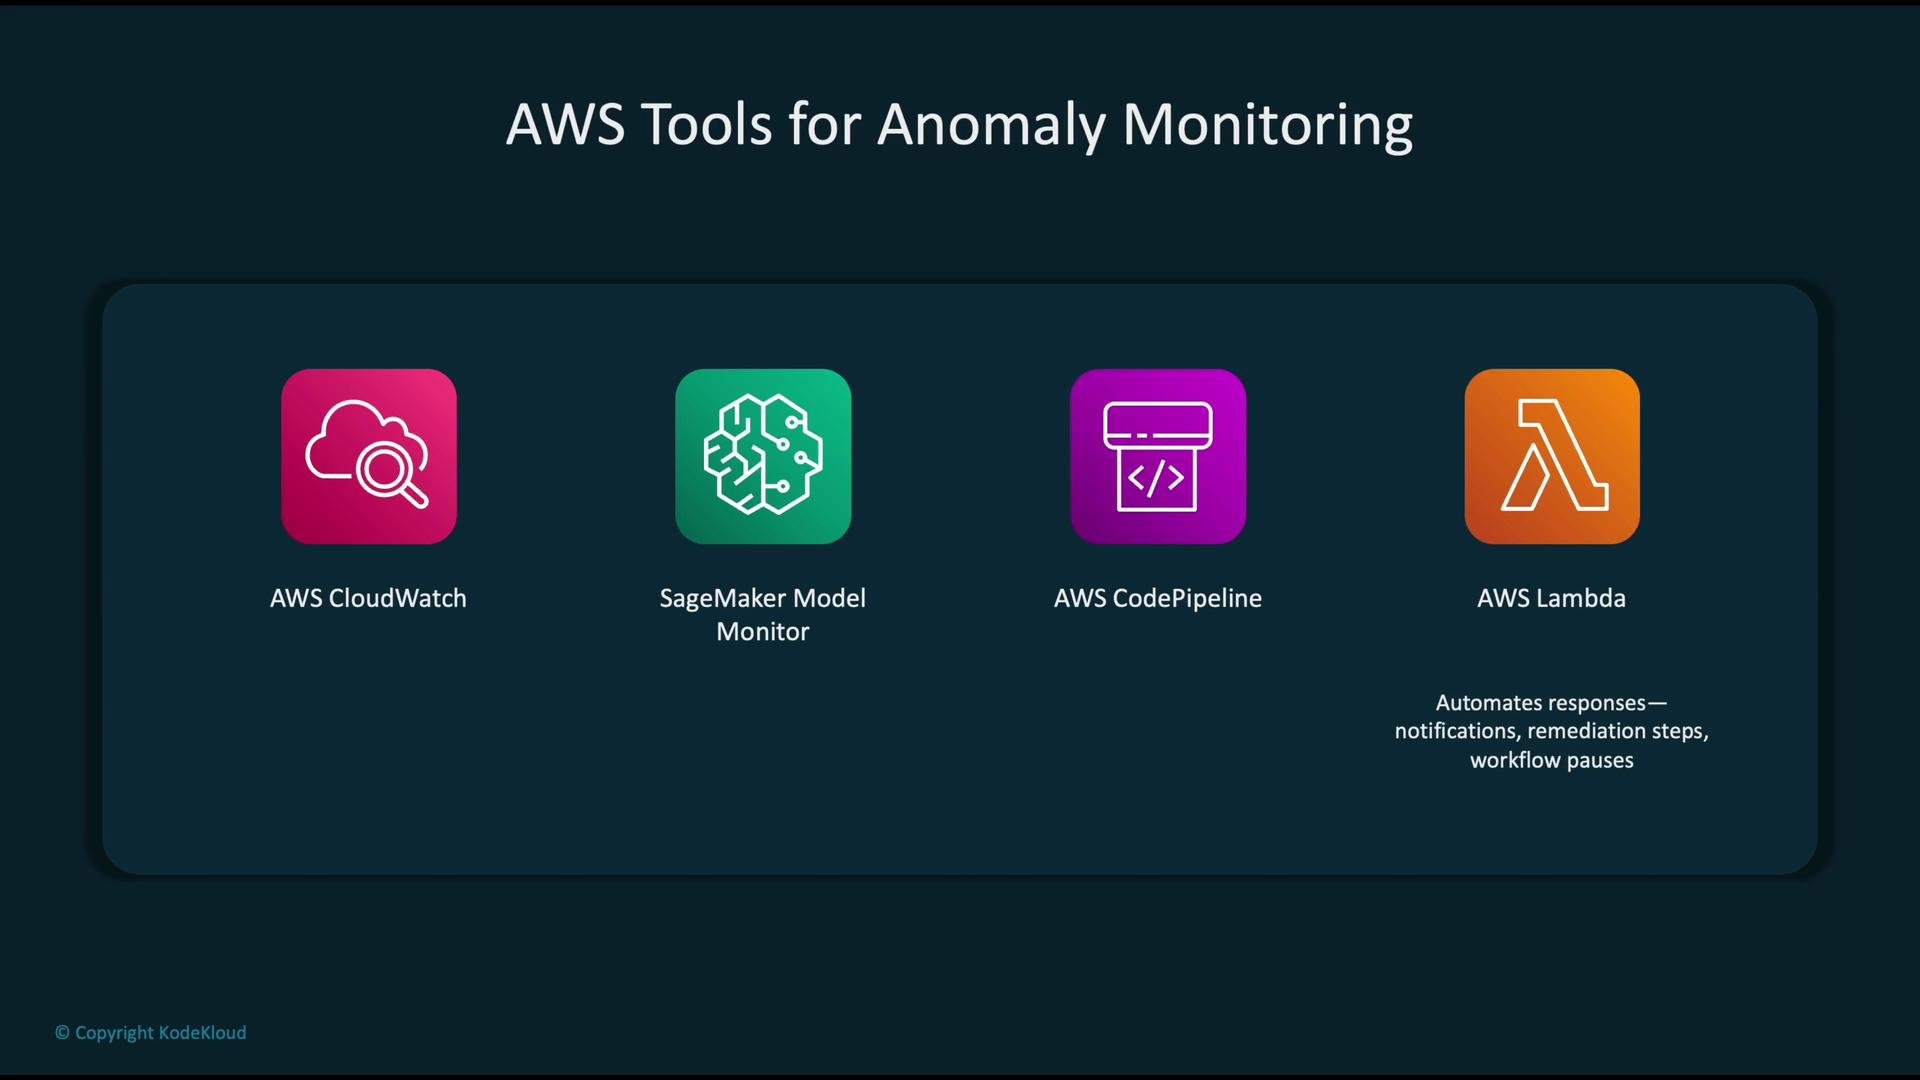
The image displays four AWS tools for anomaly monitoring: AWS CloudWatch, SageMaker Model Monitor, AWS CodePipeline, and AWS Lambda, which automates responses such as notifications and remediation steps.
Recommended pattern: data anomaly monitoring with CloudWatch + SageMaker Clarify A common production pattern:
  1. Stream events and metrics from your data sources into CloudWatch.
  2. Persist representative payloads or sample datasets to Amazon S3 for deeper analysis.
  3. Run SageMaker Clarify or Model Monitor as SageMaker processing/monitoring jobs against those persisted samples.
  4. Publish anomaly metrics and findings back to CloudWatch (for example via a Lambda that calls CloudWatch PutMetricData).
  5. Trigger CloudWatch alarms that kick off drift reports, dashboards, and remediation workflows.
Flow summary:
  • Data ingested from sources
  • Metrics/events forwarded to CloudWatch; sample data persisted to S3
  • Clarify/Model Monitor analyzes persisted data for drift, bias, and data-quality anomalies
  • Analysis results are published to CloudWatch
  • CloudWatch alarms generate reports and visualization pipelines for investigation
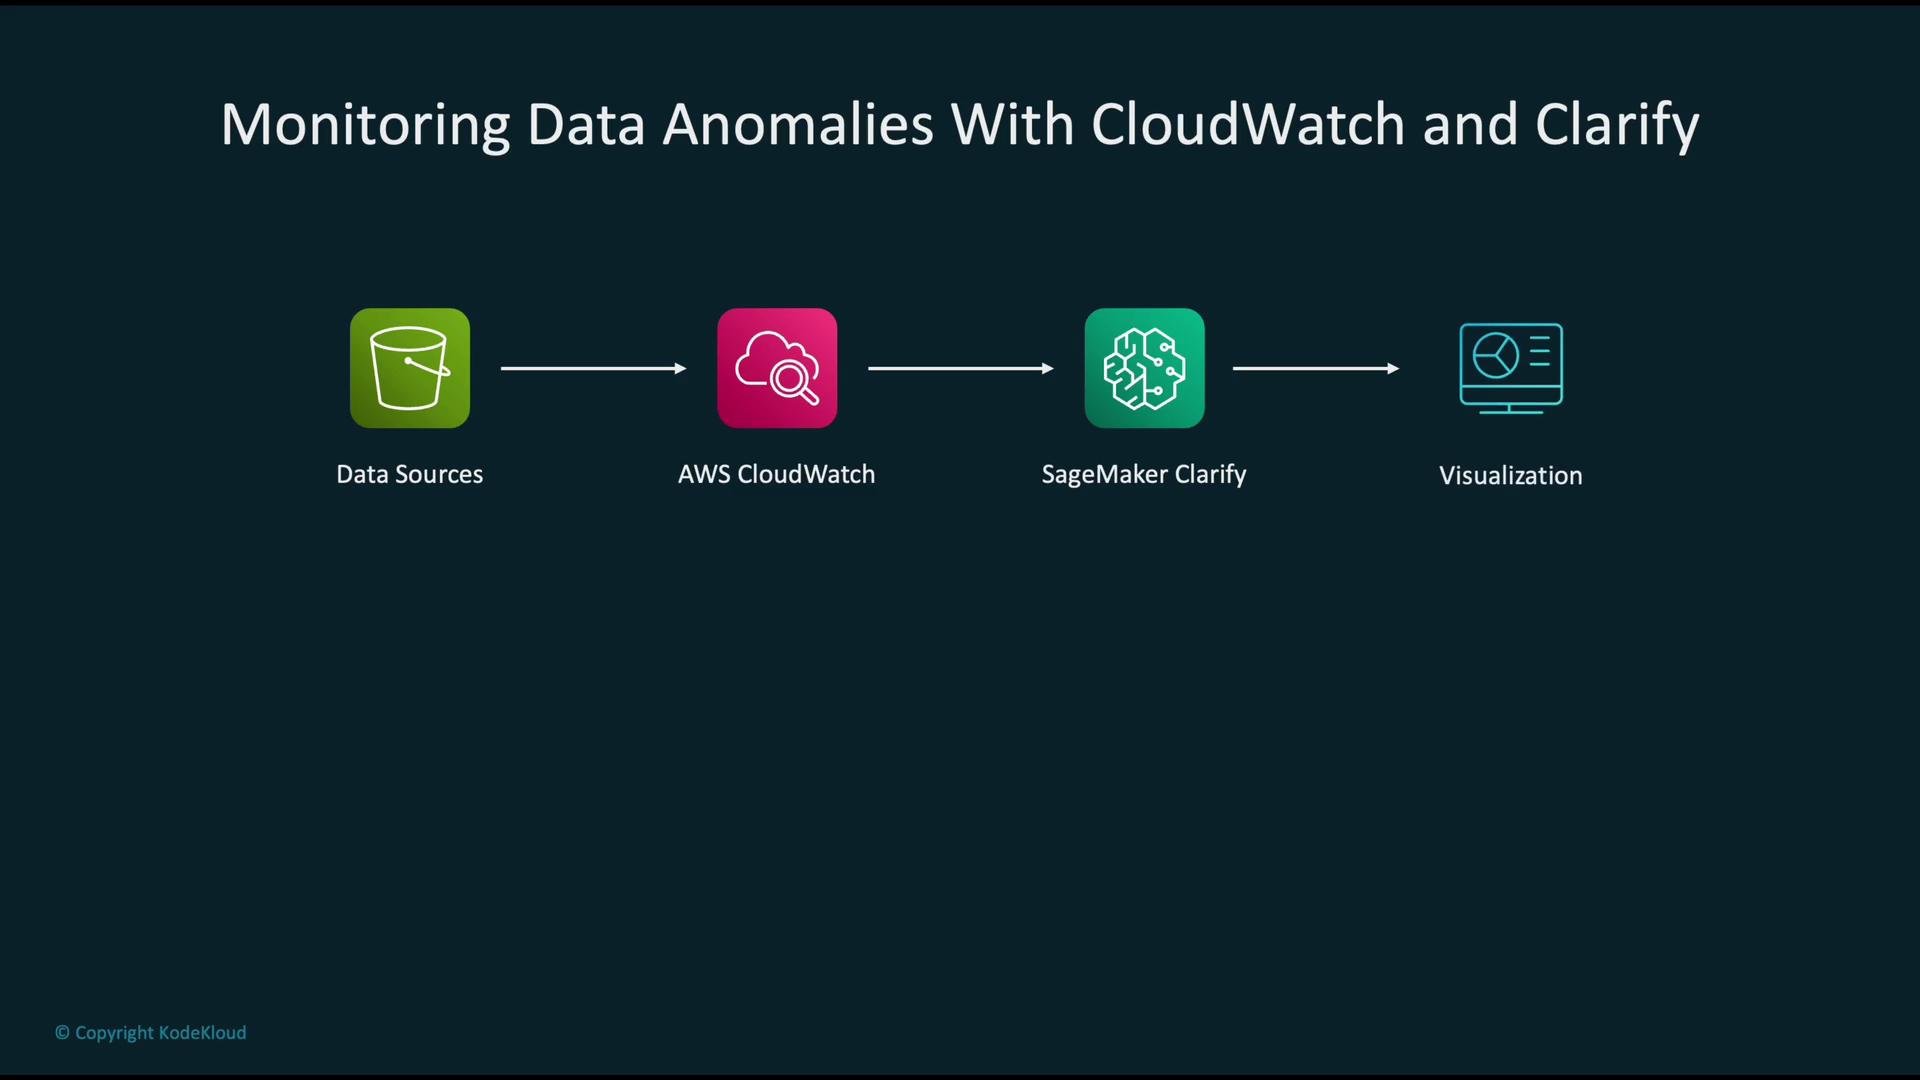
The image is a flowchart illustrating the process of monitoring data anomalies using AWS CloudWatch and SageMaker Clarify, starting from data sources to visualization.
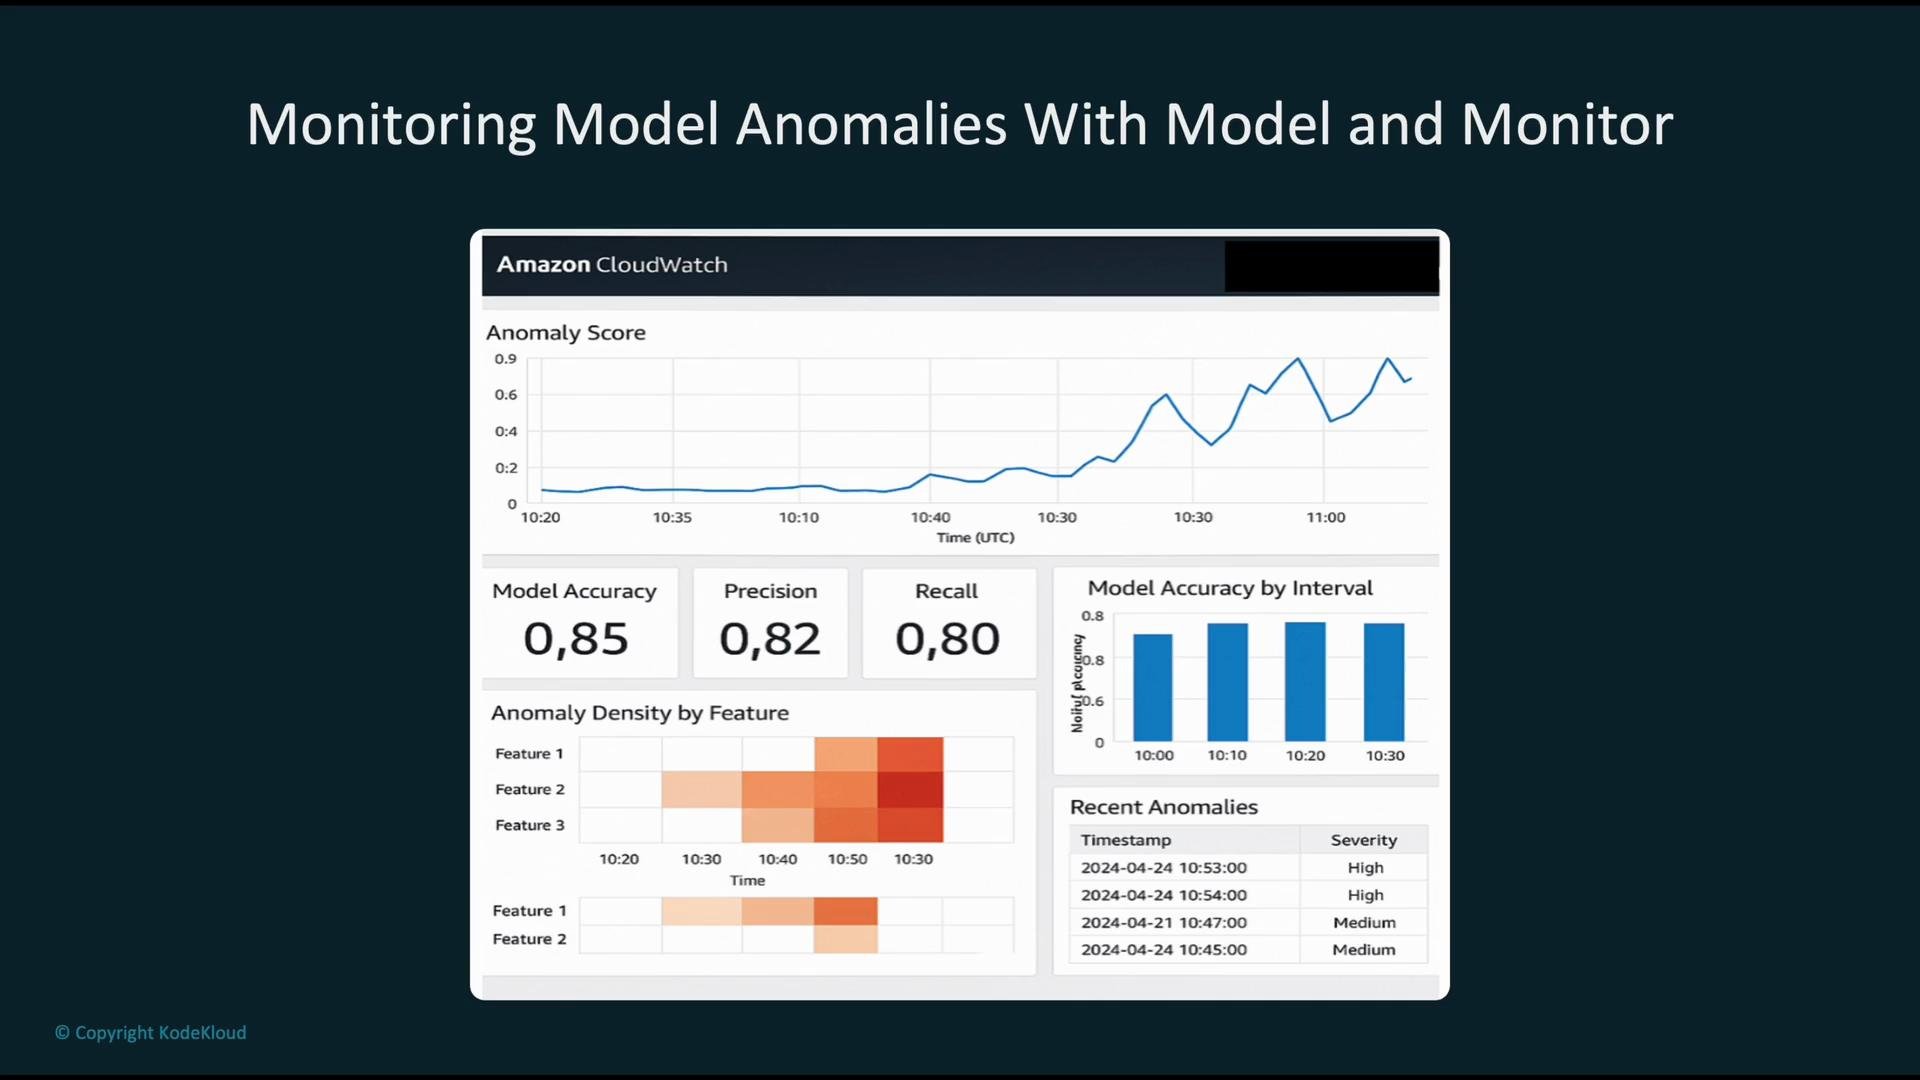
When Clarify or Model Monitor produces findings and those are forwarded to CloudWatch (for example via a Lambda), CloudWatch alarms can automatically generate detailed drift reports and surface insights on dashboards for investigation. Example dashboard patterns A well-designed CloudWatch model-monitoring dashboard typically includes:
  • Anomaly score trend (leading indicator)
  • Model performance metrics (accuracy, precision, recall) for context
  • Heat maps or feature-importance visualizations showing which features drive anomalies
  • An event table listing high-severity occurrences and timestamps for root-cause analysis
The image shows a flowchart outlining the process of monitoring data anomalies using CloudWatch and SageMaker Clarify, with steps from data sources to visualization and anomaly detection.
The image shows a dashboard from Amazon CloudWatch for monitoring model anomalies, featuring graphs of anomaly scores, model accuracy, and anomaly density by feature, along with recent anomalies listed by timestamp and severity.
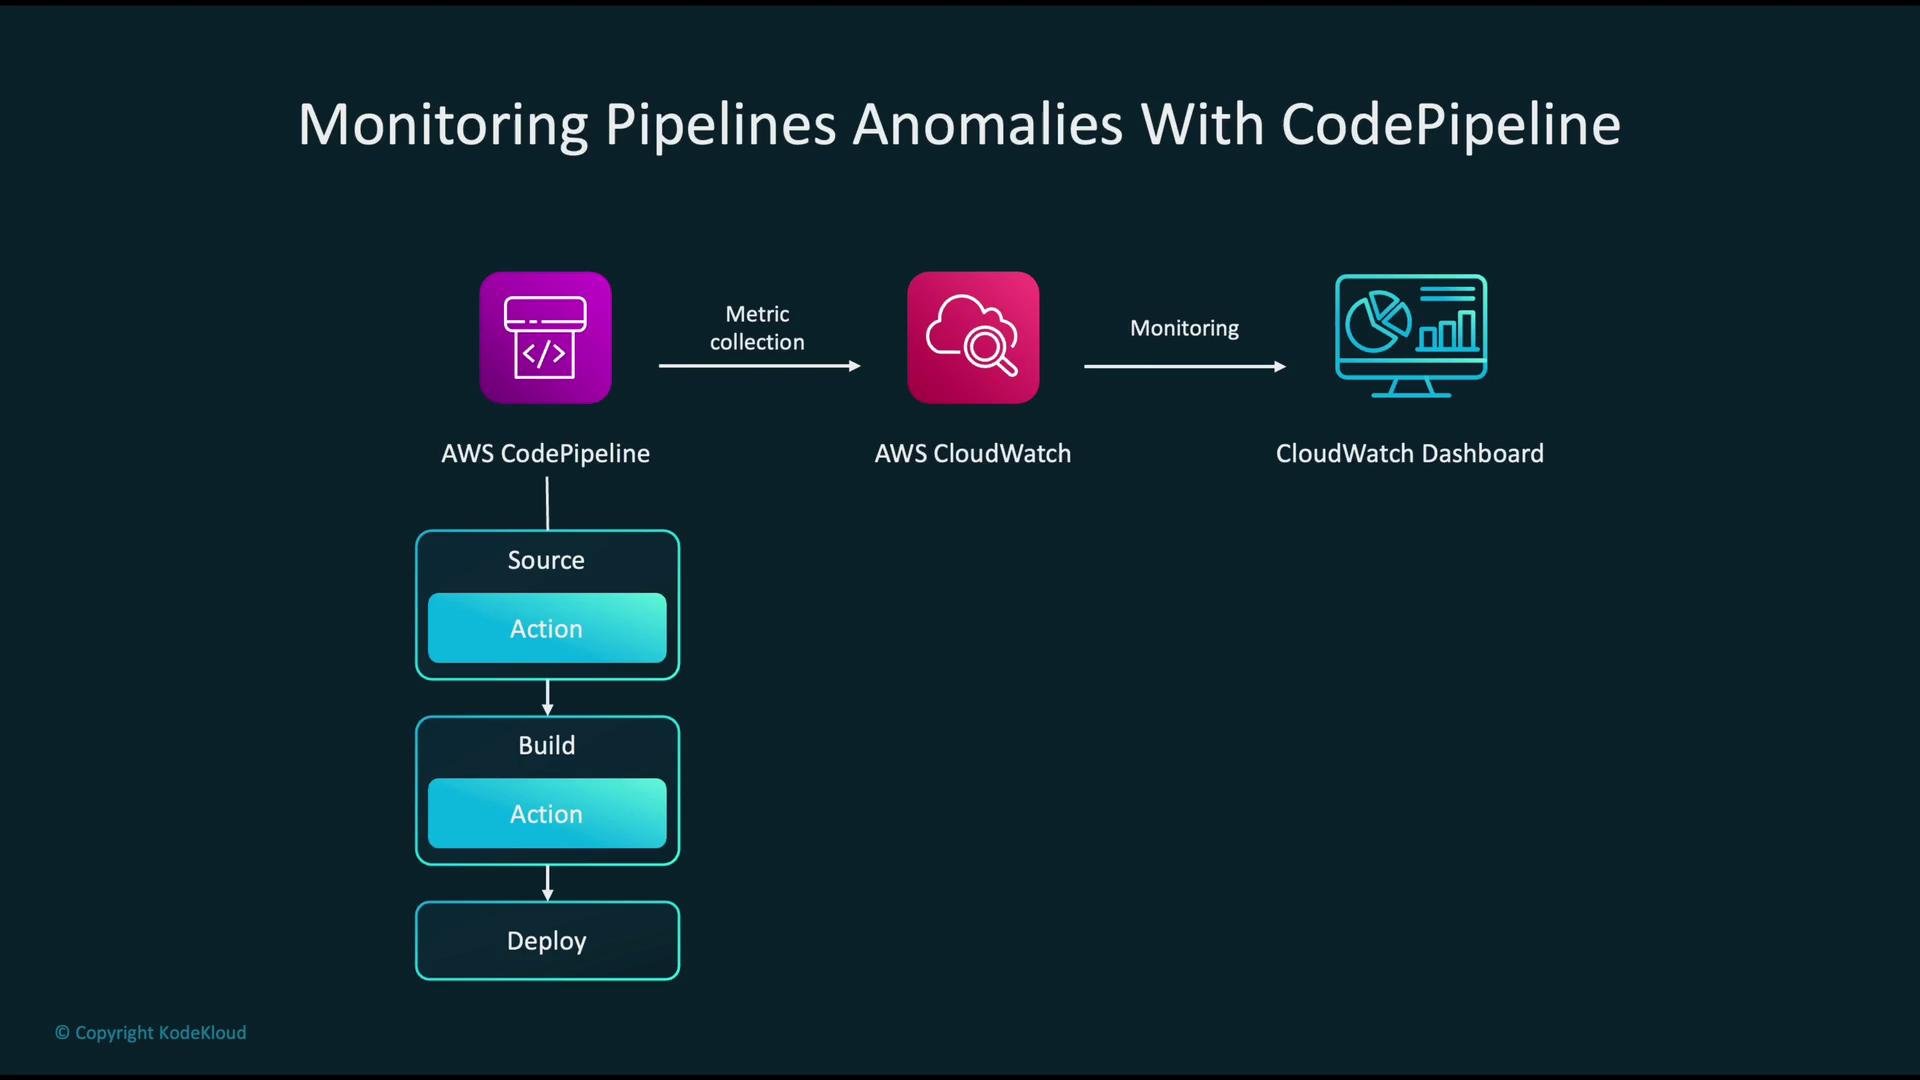
Monitoring CI/CD pipelines Use CloudWatch to observe CodePipeline metrics emitted during source→build→deploy. Create alarms for failures, increased latency, or unusual step durations and surface these on a custom dashboard to detect pipeline anomalies early.
The image illustrates a process for monitoring pipeline anomalies using AWS CodePipeline, AWS CloudWatch, and a CloudWatch Dashboard. It depicts the steps of source, build, and deploy actions, along with metric collection and monitoring.
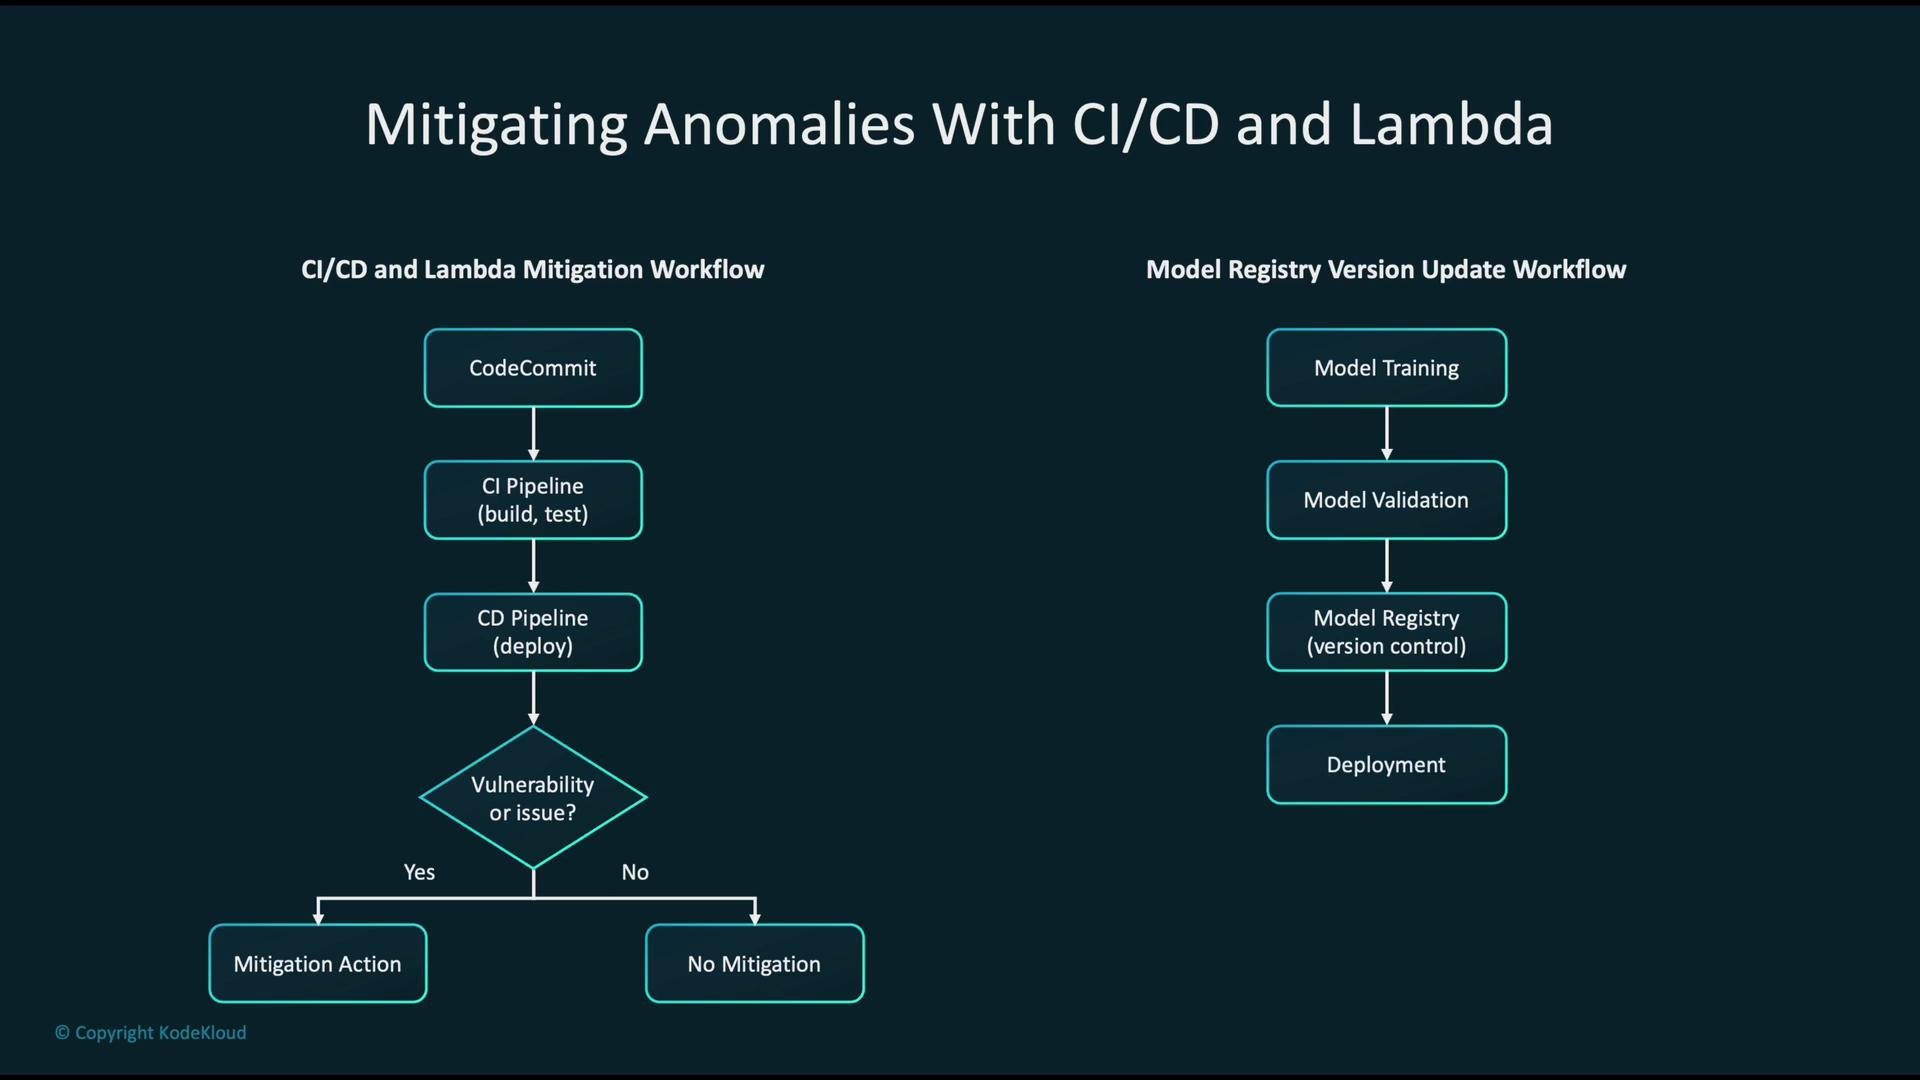
Example automated workflows The diagram below shows two complementary automated workflows:
  • Left — CI/CD with Lambda mitigation:
    • Code commit (CodeCommit) triggers CI pipeline (build & test).
    • CD pipeline performs deployment.
    • A security or operational check runs; if an issue is detected, a Lambda-based mitigation or rollback is triggered.
  • Right — Model update and registry workflow:
    • Train a new model.
    • Validate the model.
    • Register the validated model in the SageMaker model registry (versioning).
    • Deploy the model to production.
These patterns enable fast, automated reactions to anomalies while preserving governance via validation and registry steps.
The image shows two workflows: one for CI/CD and Lambda Mitigation, and another for Model Registry Version Update, detailing steps from code commit and model training to deployment and mitigation actions.
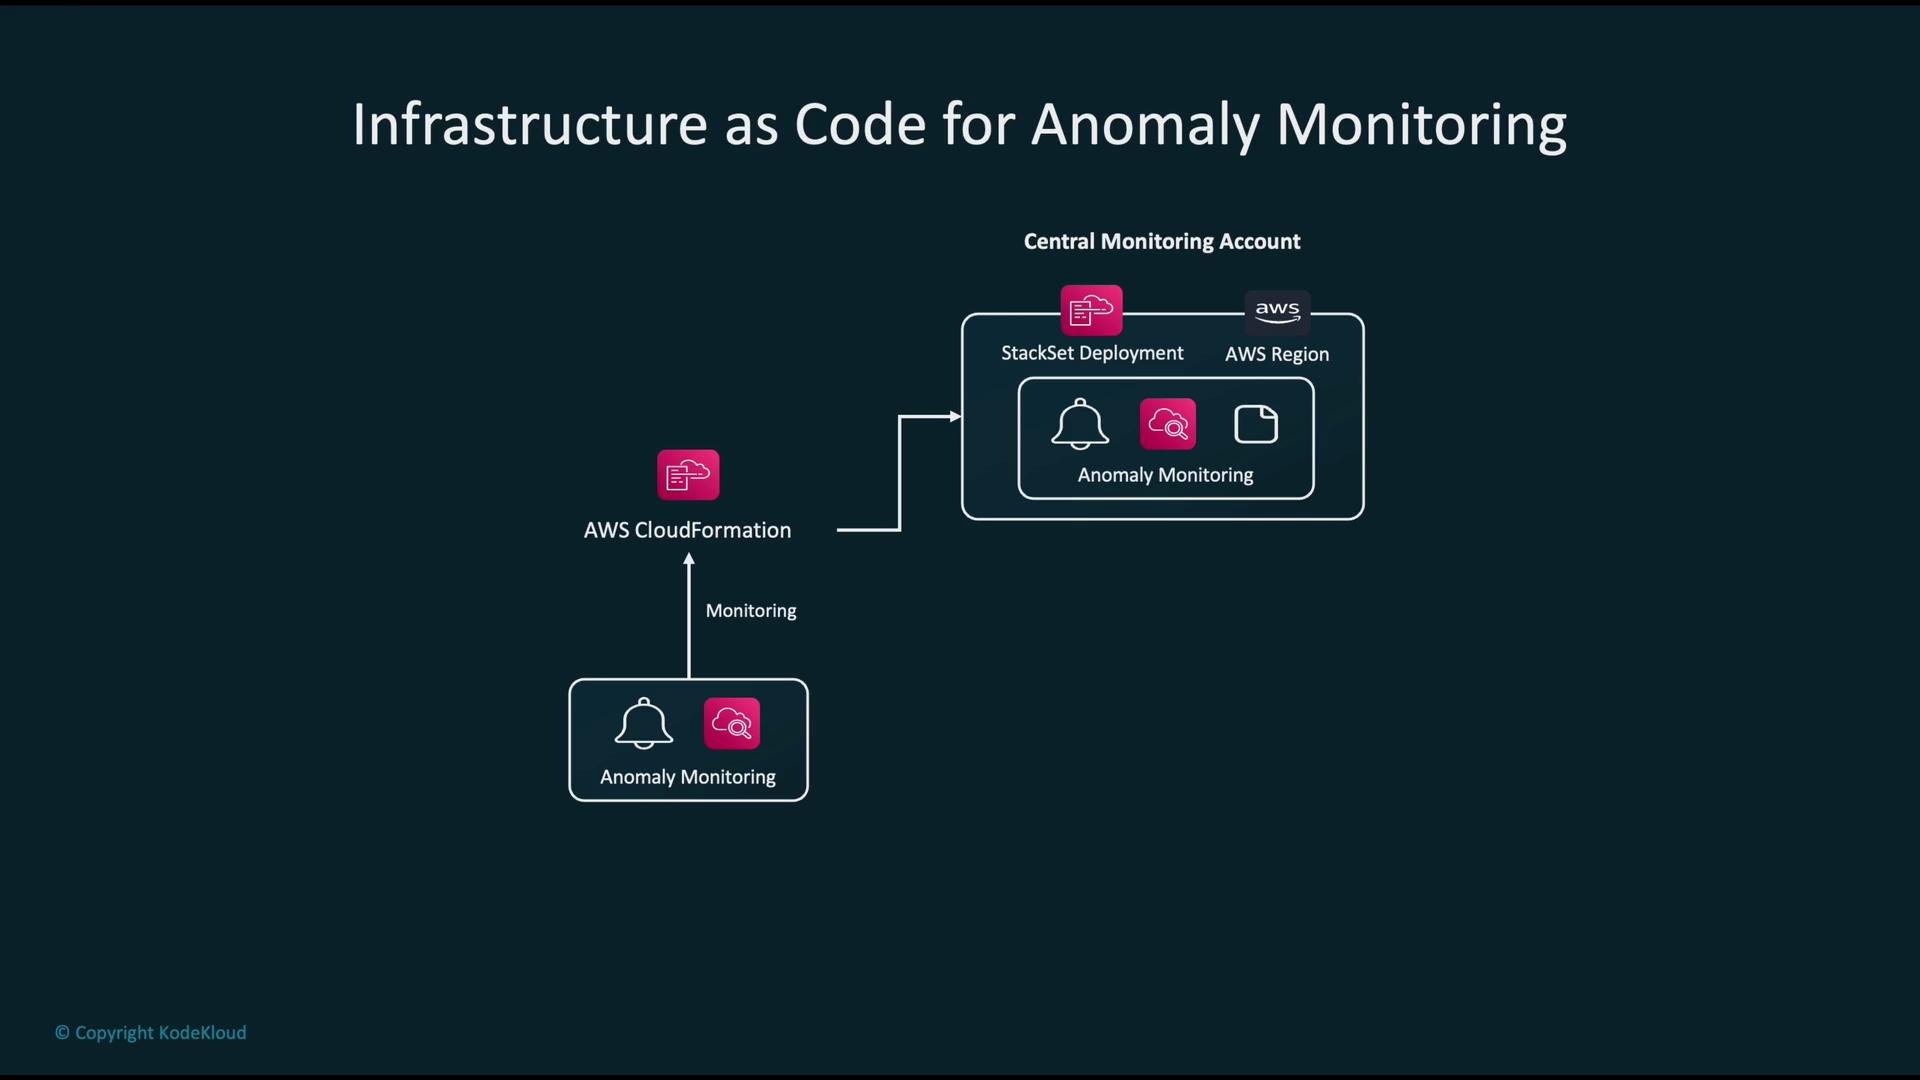
Infrastructure as Code (IaC) for consistent monitoring Define dashboards, alarms, detection rules, and Lambda responders as CloudFormation templates. From a central monitoring account, deploy those templates using CloudFormation StackSets to roll out monitoring consistently across accounts and regions. This ensures standardized monitoring policies and simplifies updates and audits.
The image illustrates a diagram titled "Infrastructure as Code for Anomaly Monitoring," depicting a structure for deploying anomaly monitoring using AWS CloudFormation and StackSet Deployment within a central monitoring account.
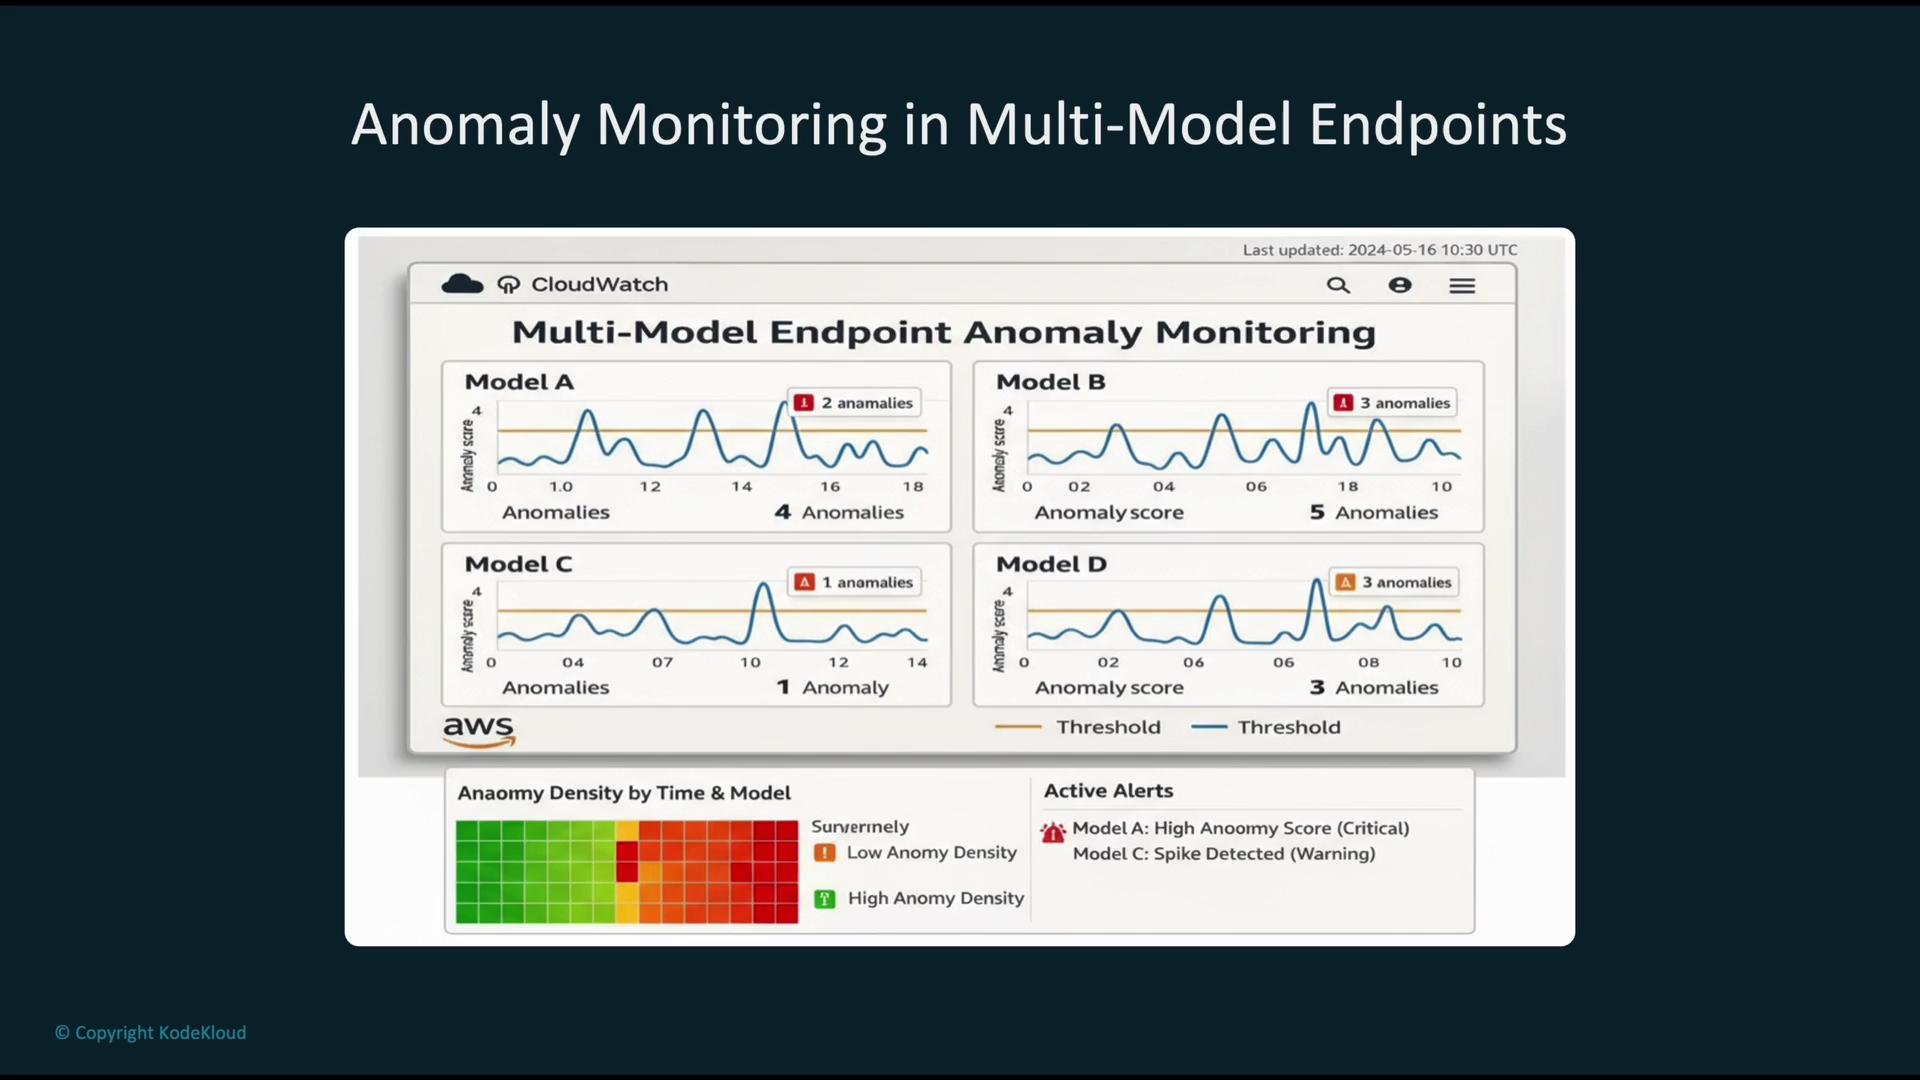
Multi-model endpoints monitoring Centralize monitoring for many models in a single CloudWatch dashboard. Track an anomaly score per model, visualize anomaly density across models with heat maps, and maintain an active alerts panel for urgent items. For multi-model hosting patterns, see SageMaker multi-model endpoints.
The image displays a dashboard for anomaly monitoring in multi-model endpoints using AWS CloudWatch, showing visual graphs of anomaly scores for four different models, along with active alerts and anomaly density indicators.
Edge device anomaly monitoring Edge pattern summary:
  • Edge devices emit operational metrics.
  • A central edge gateway aggregates metrics.
  • Gateway forwards metrics to CloudWatch for anomaly detection and alerting.
  • CloudWatch surfaces anomalies on dashboards and triggers updates or mitigation actions (for example, via IoT Jobs or Lambda).
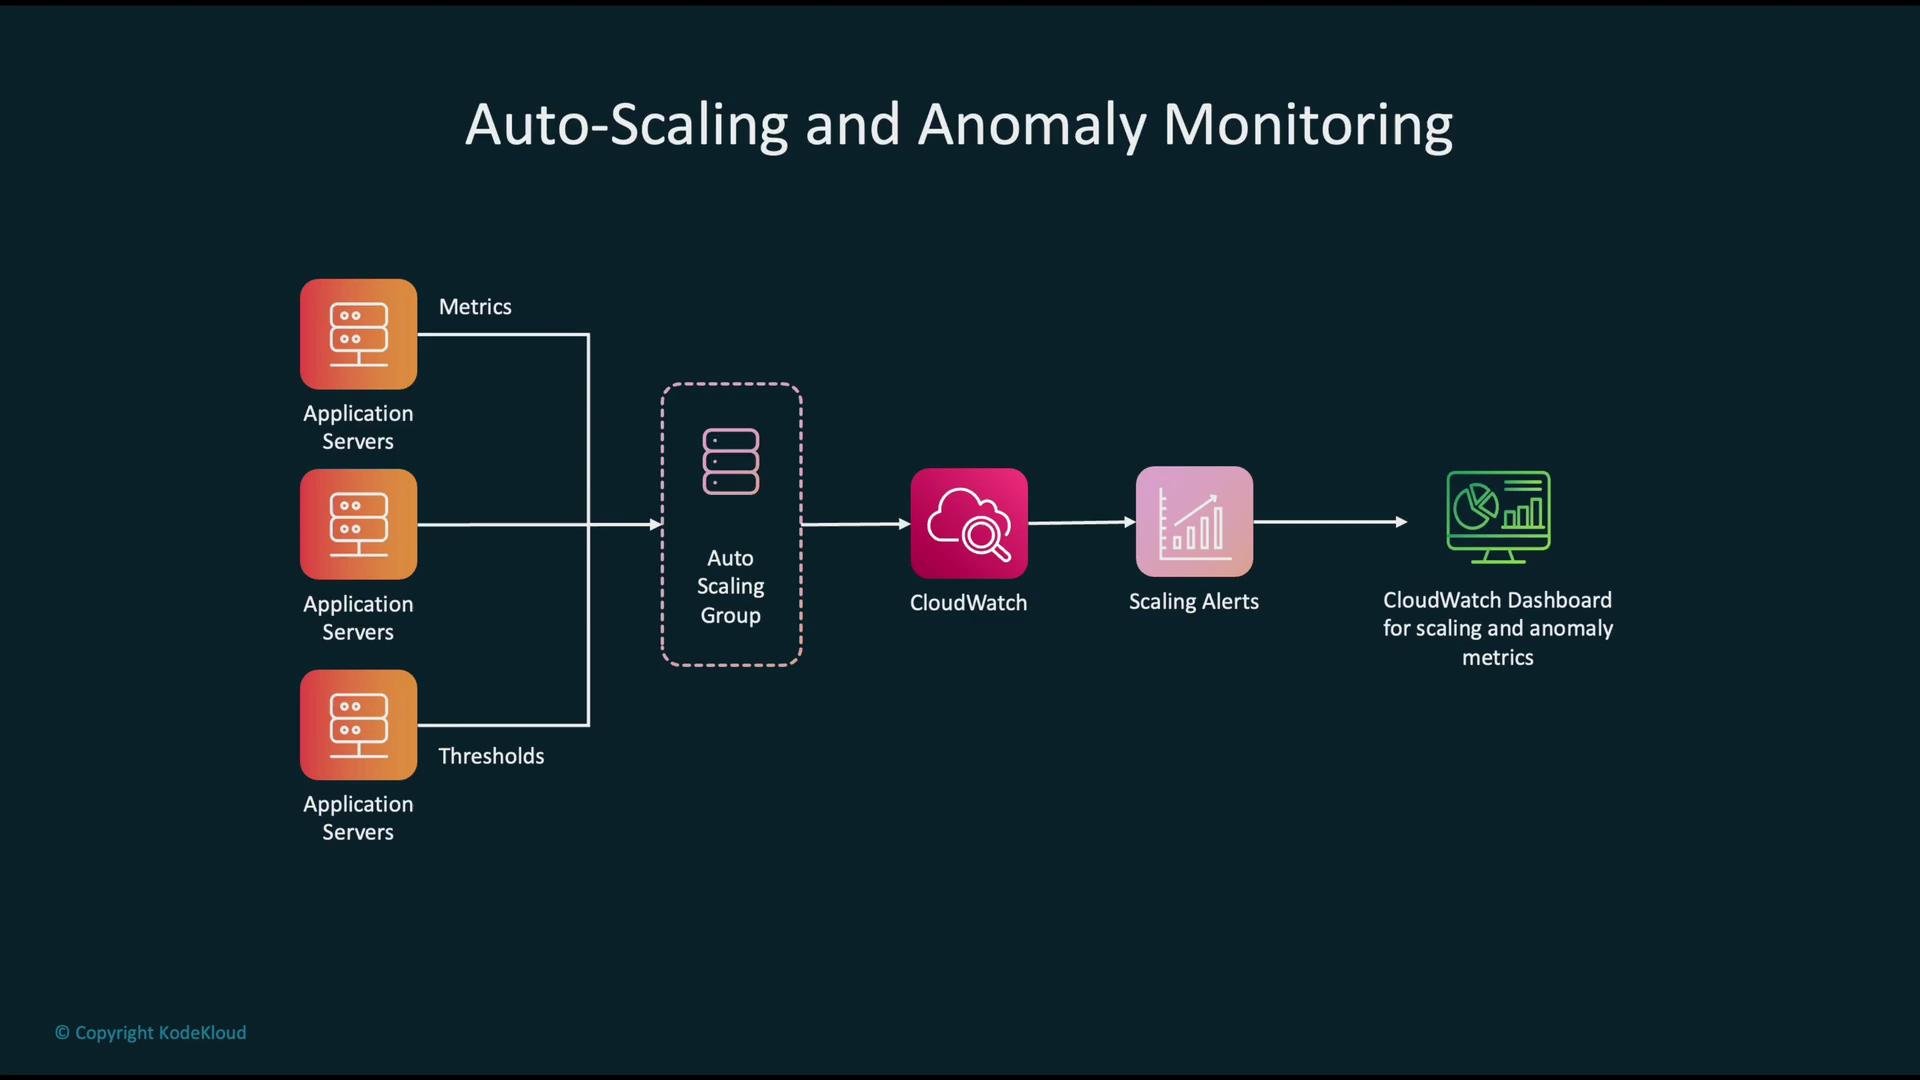
This design enables early detection of device-level issues and scalable update delivery. Auto Scaling and anomaly monitoring Application servers in an Auto Scaling group emit performance metrics to CloudWatch. Use those metrics to drive scaling policies, trigger alerts on anomalies, and visualize scaling events alongside anomaly metrics for complete operational context.
The image is a diagram illustrating auto-scaling and anomaly monitoring for application servers using CloudWatch, depicting the flow from application metrics through to dashboards for alerts and metrics.
Code example: managing an IoT/edge device fleet with boto3 The example below shows how to register an IoT device and create an IoT job that references an update package in S3. This pattern supports scalable model updates to edge devices used for anomaly detection.
The documentSource S3 URI references the job document containing device update instructions and artifacts. For full details on IoT jobs and device management, see the AWS IoT documentation. Security and compliance in anomaly monitoring Best practices:
  • Aggregate logs and metrics from databases, servers, and cloud services to a secure central store.
  • Run detection engines and evaluate findings against compliance rules.
  • Trigger incident workflows when anomalies are confirmed and persist evidence for audit.
  • Secure stored data (encryption at rest and in transit) and maintain immutable logs for forensic analysis.
  • Use historical findings to refine runbooks and incident playbooks.
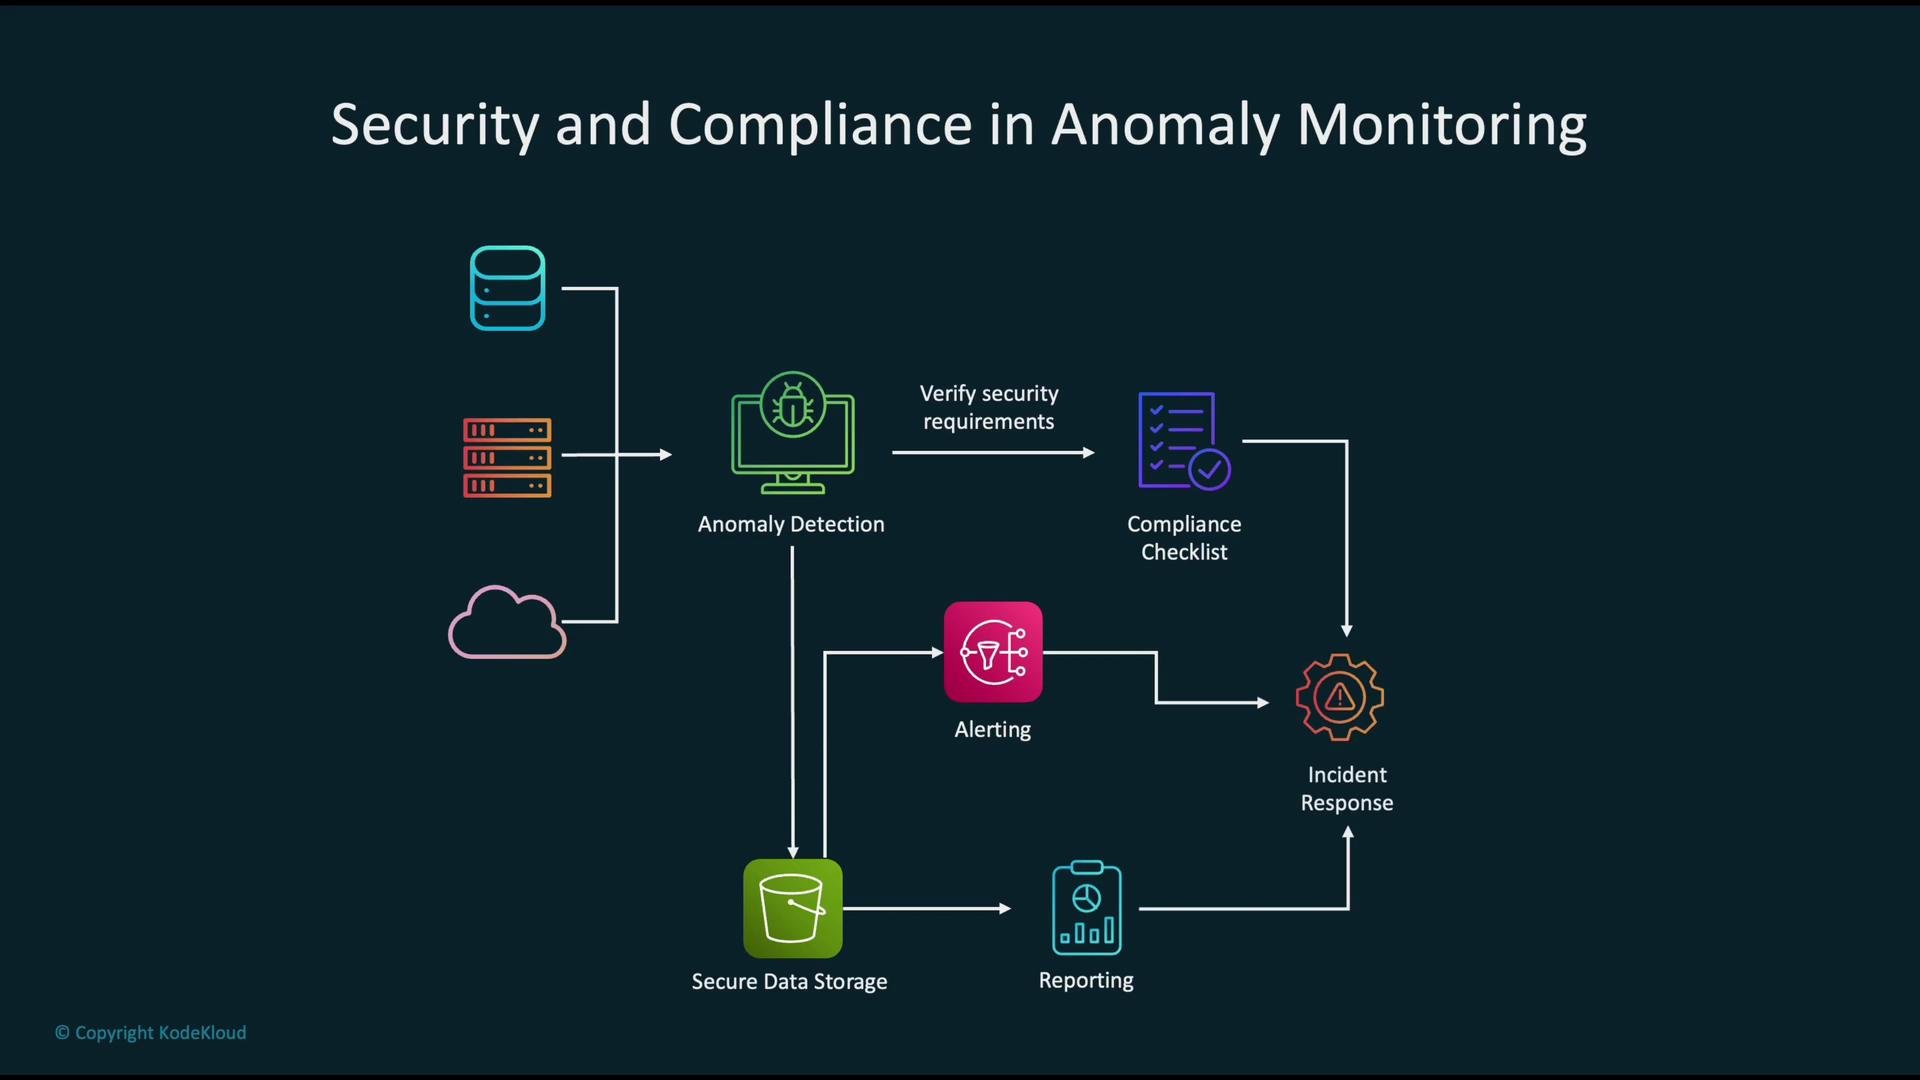
The image is a flowchart illustrating "Security and Compliance in Anomaly Monitoring," showing processes like anomaly detection, compliance verification, alerting, incident response, secure data storage, and reporting.
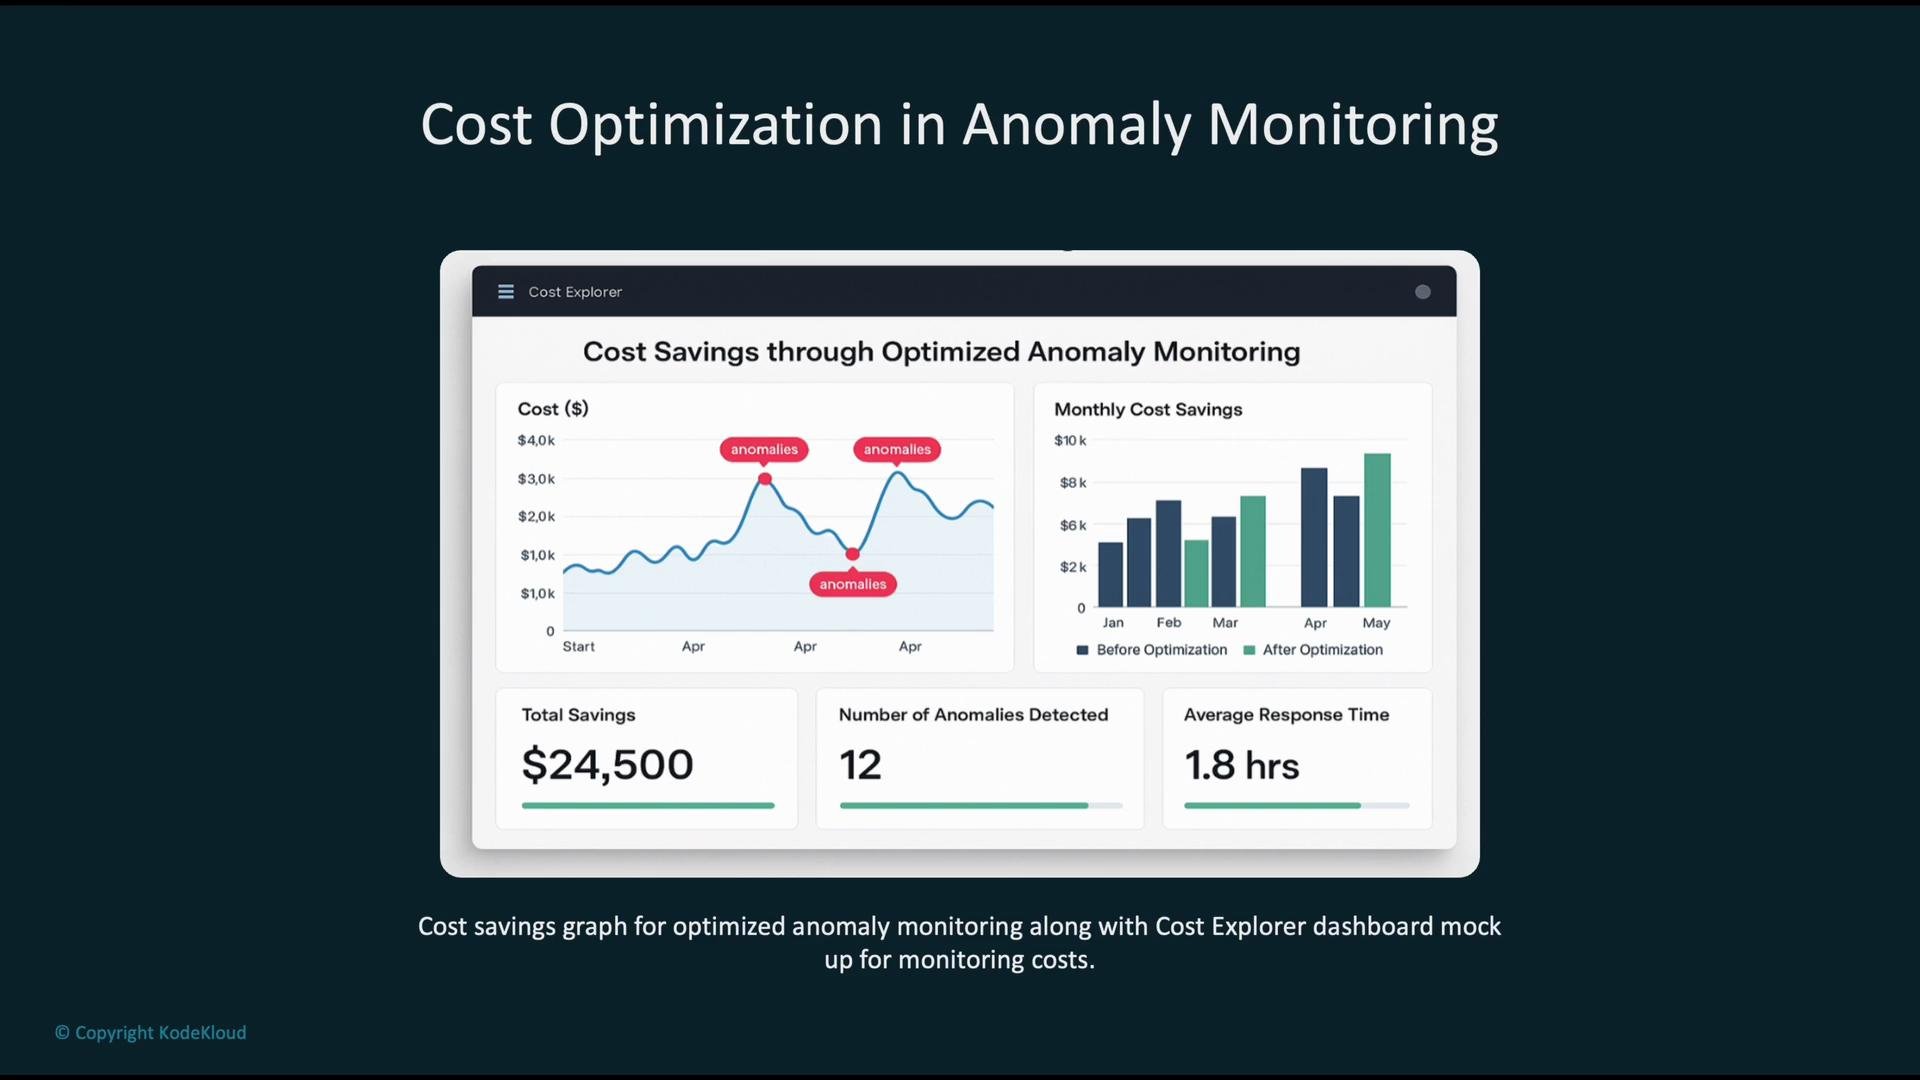
Cost optimization via anomaly monitoring Anomaly monitoring can reveal unexpected usage and inefficiencies. Dashboards can surface cost trends, flag cost anomalies, and quantify savings from remediation actions. The example below highlights both savings and improved mean response time.
The image is a dashboard displaying cost optimization through anomaly monitoring, featuring graphs and metrics like total savings, anomalies detected, and average response time.
In this example, optimized monitoring produced $24,500 in savings and reduced mean anomaly response time to 1.8 hours. Anti-patterns to avoid Common pitfalls:
  • Alert fatigue due to excessive false positives
  • Unmonitored gaps where anomalies go unnoticed
  • Siloed detections that hinder root-cause analysis
  • Poorly calibrated thresholds that cause missed incidents or noise
  • Alerts that lack actionable remediation steps
Avoid alert fatigue by tuning detection thresholds, deduplicating noisy alerts, and ensuring every alert maps to a runbook or automated remediation.
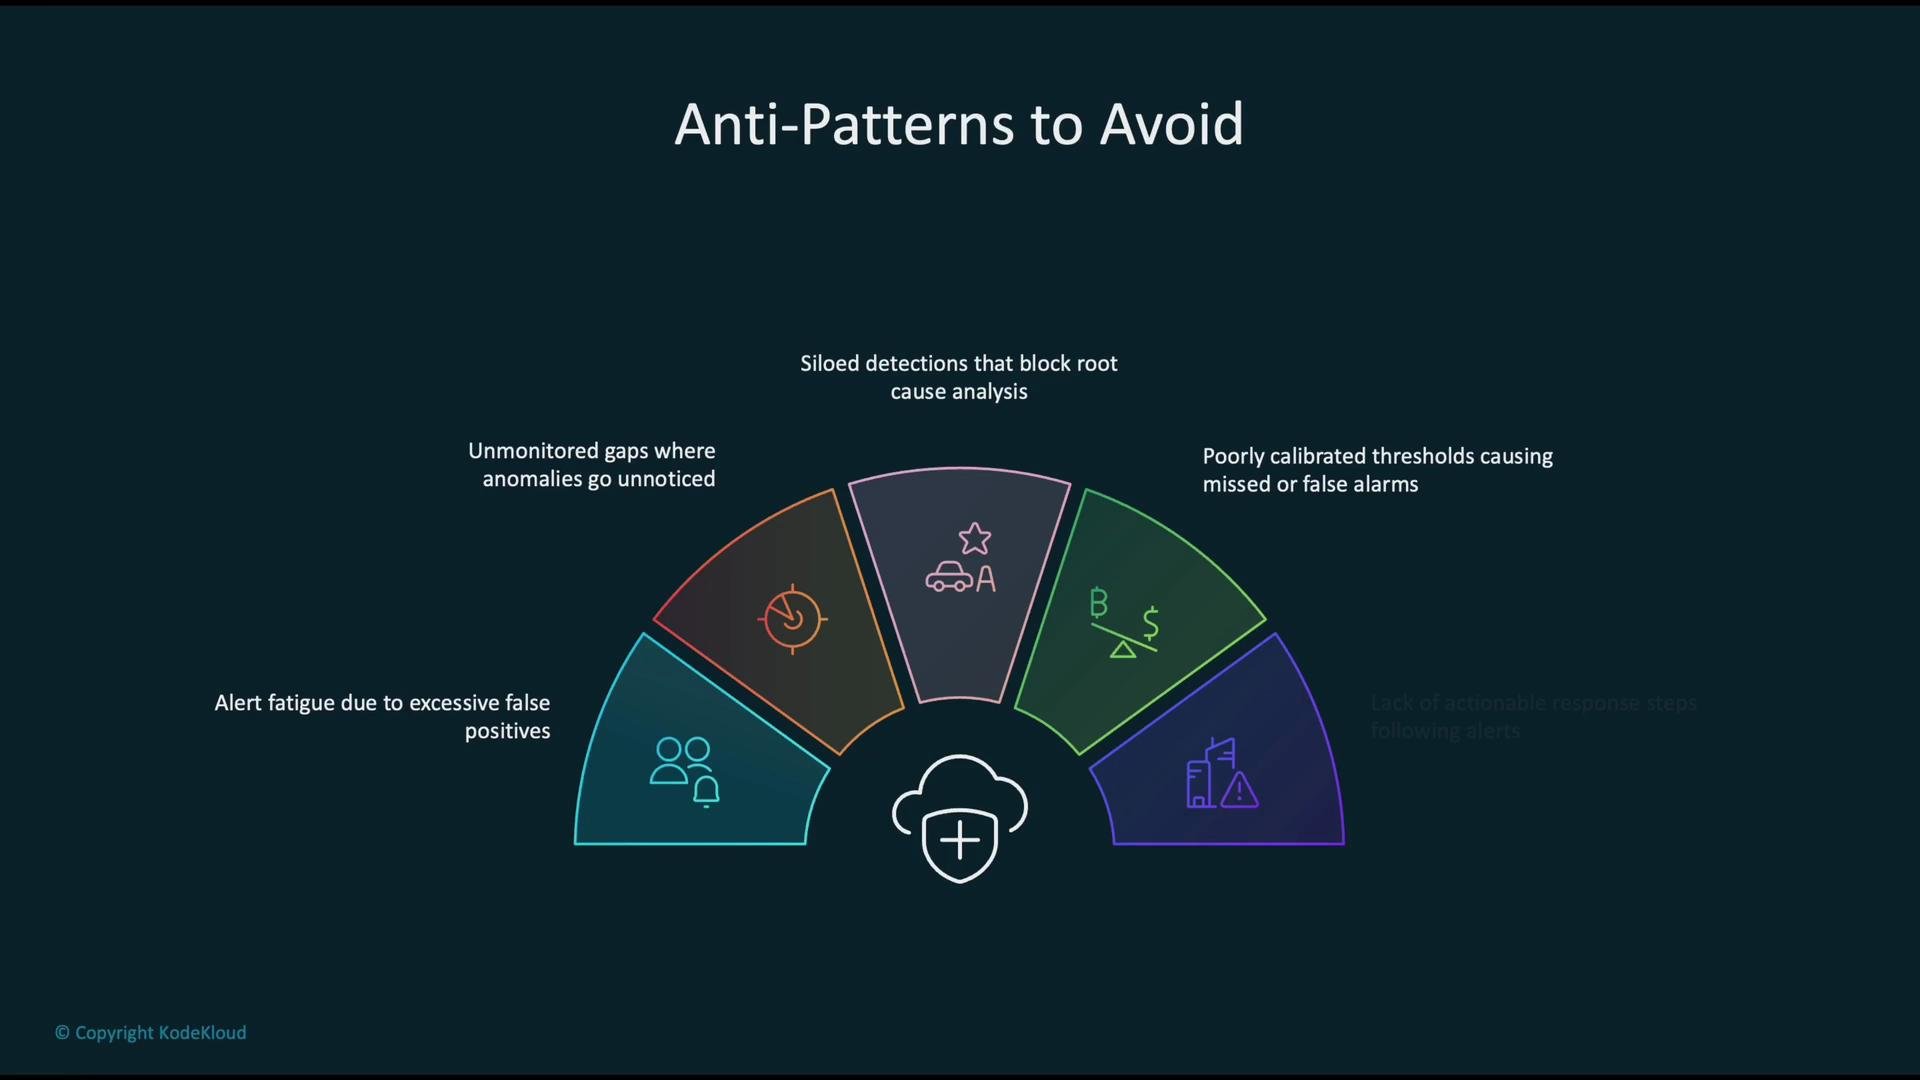
The image lists anti-patterns to avoid in anomaly detection, including alert fatigue from false positives, unmonitored gaps, siloed detections, poor threshold calibration, and lack of actionable responses. It features a circular diagram with icons for each anti-pattern.
Key takeaways
  • Use native AWS tools (CloudWatch, SageMaker, Lambda, CodePipeline) for end-to-end anomaly monitoring and automated responses.
  • Monitor all MLOps phases: data ingestion, preprocessing, training, validation, registry, and deployment (including multi-model and edge endpoints).
  • Automate alerts and remediation to reduce manual work and improve MTTR.
  • Deploy monitoring consistently across accounts/regions using IaC (CloudFormation & StackSets).
  • Integrate anomaly detection with Auto Scaling and cost management to optimize resources.
  • Ensure security and compliance via encrypted storage, audit reporting, and a clear incident response process.
  • Proactively avoid alert fatigue, coverage gaps, and poor threshold calibration.
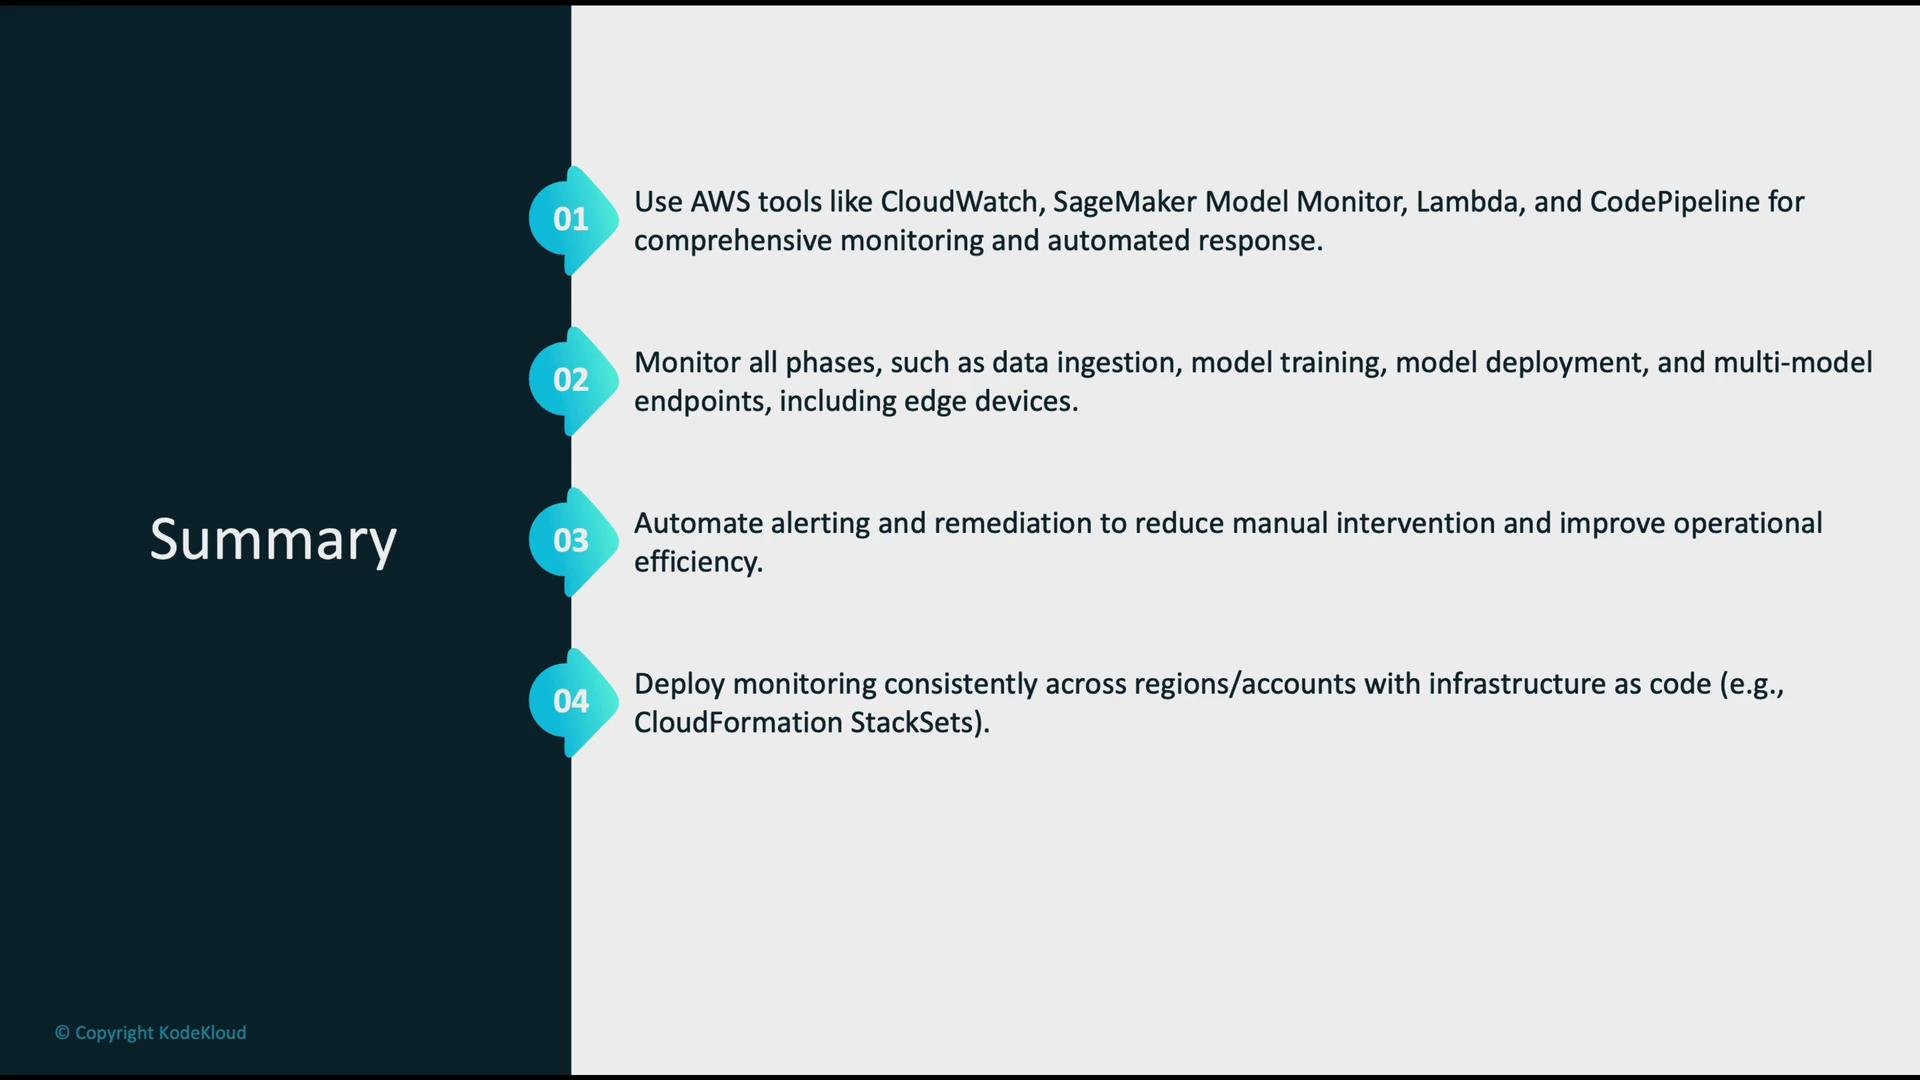
The image is a summary slide outlining the use of AWS tools for monitoring, covering phases such as data ingestion and model deployment, automating alerts, and deploying monitoring across regions.
Further reading and references
Design monitoring as a feedback loop: detect → analyze → remediate → learn. Automate where possible and keep humans focused on high-impact investigations.

Watch Video