

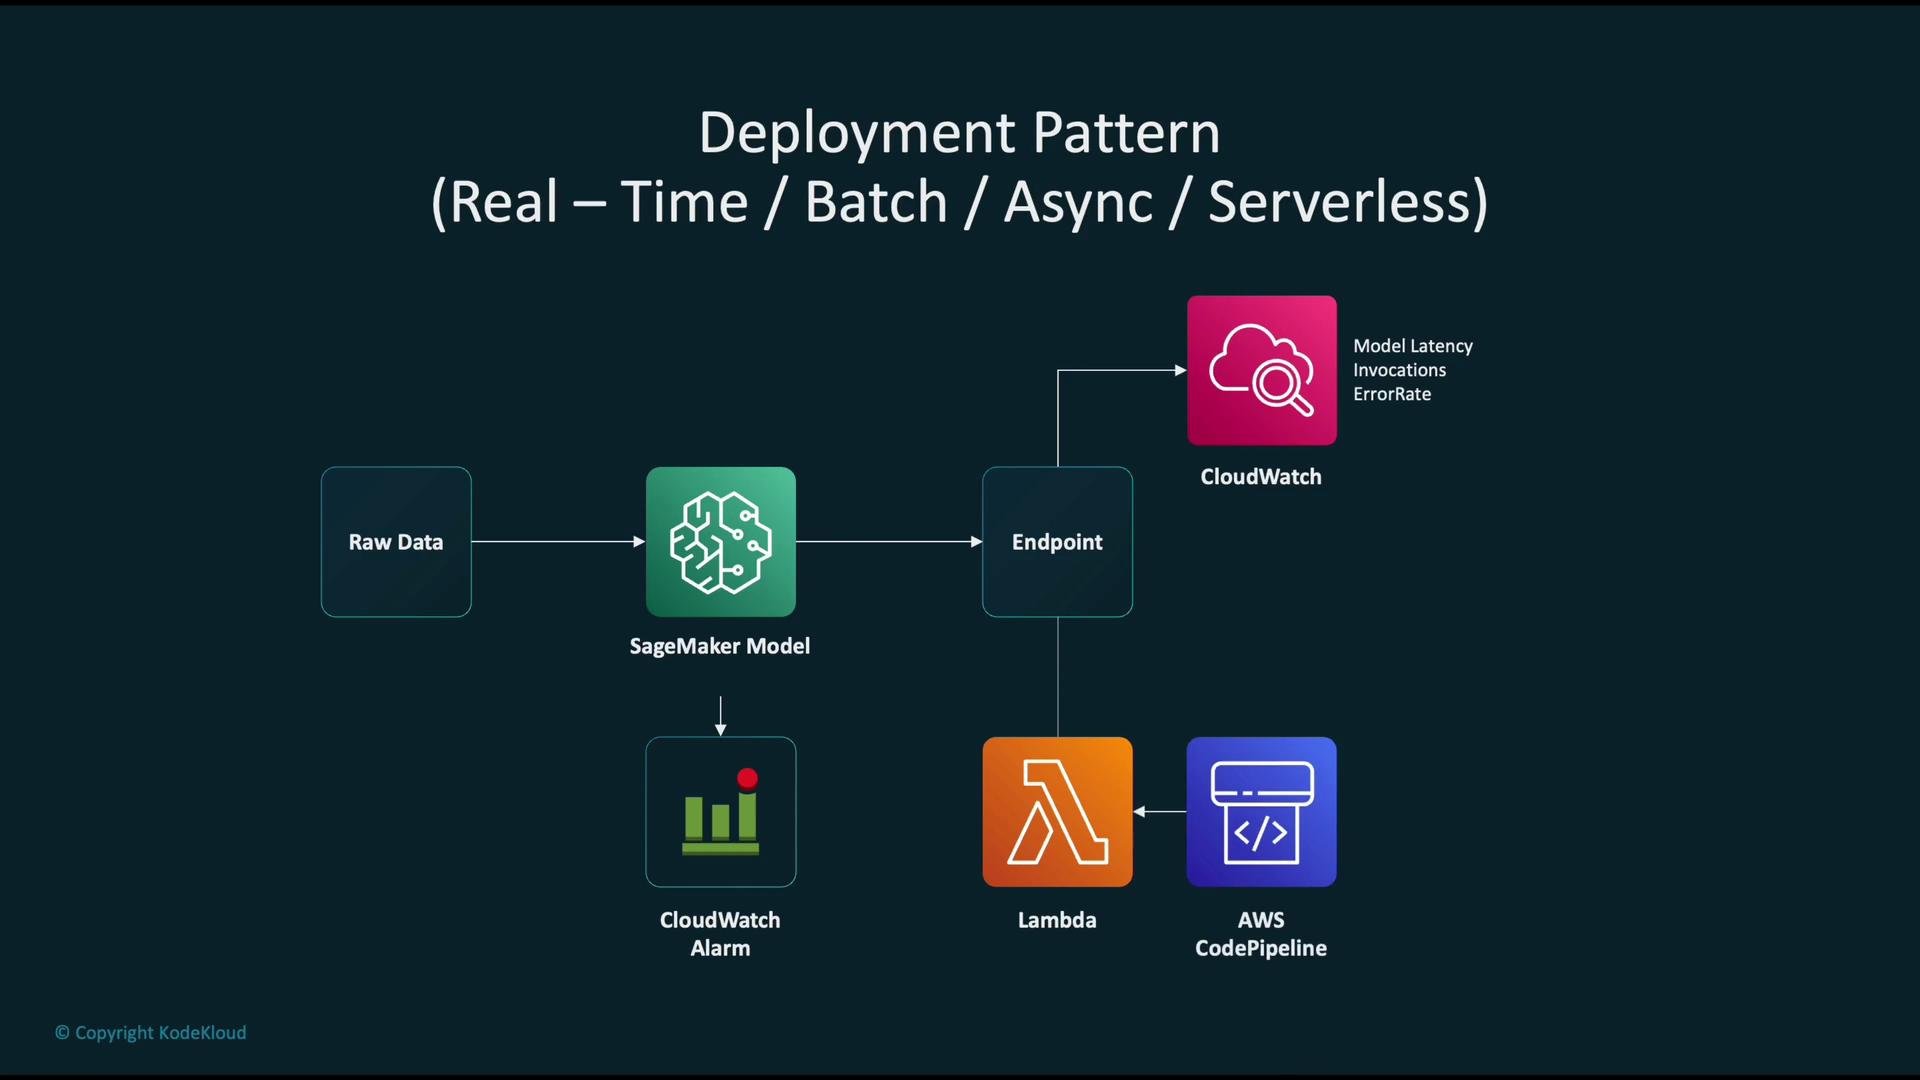
Typical automated MLOps deployment and monitoring pattern on AWS
Follow a reproducible pipeline that links training, serving, monitoring, and automated response:- Train a model from raw data in Amazon SageMaker.
- Deploy the model to a SageMaker endpoint for serving predictions.
- Monitor endpoint operational health (latency, error rates, throttling) with Amazon CloudWatch.
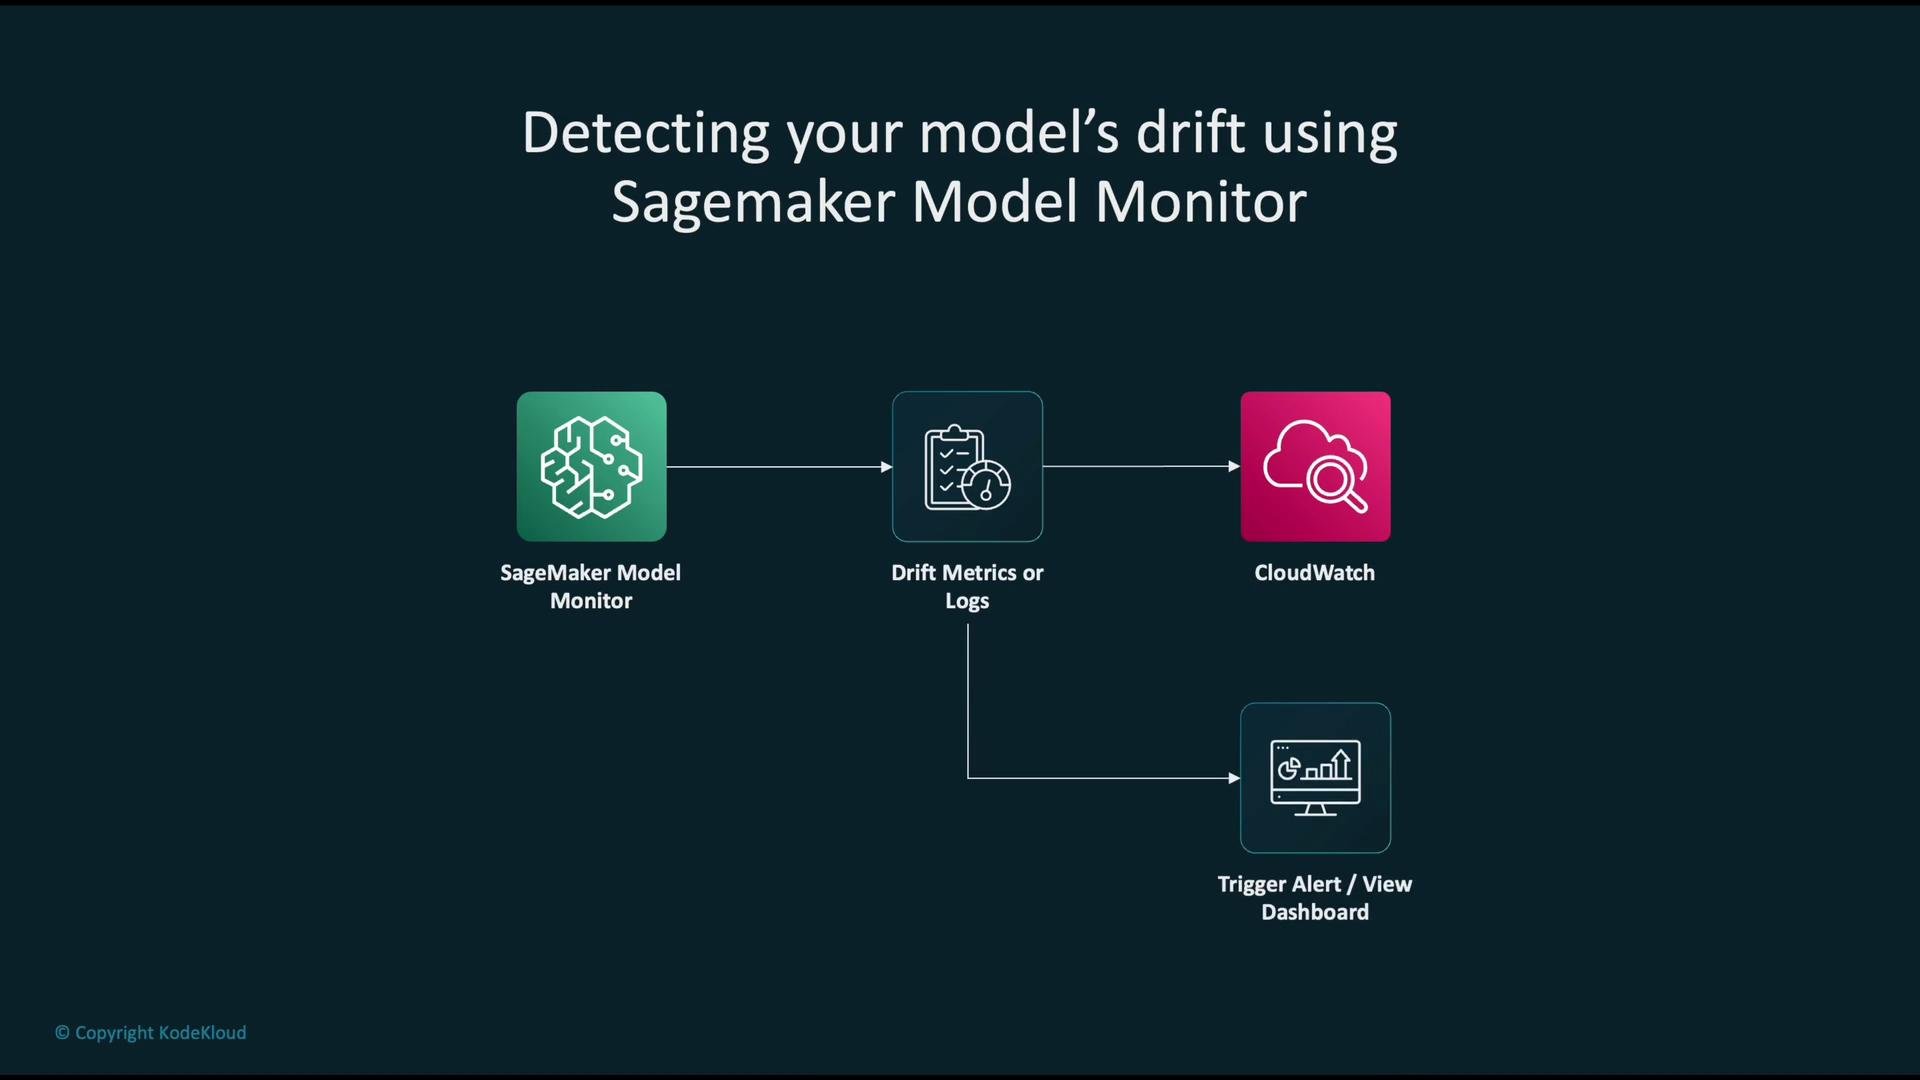
- Run SageMaker Model Monitor to compare live traffic against a baseline and detect data or model-quality drift (feature-distribution shifts, prediction drift).
- When a metric crosses a configured threshold, trigger a CloudWatch alarm which can invoke an AWS Lambda function.
- The Lambda function can kick off an AWS CodePipeline or other automation to retrain, validate, and redeploy the model.
Anomaly detection and investigation
Aggregate telemetry and operational logs into CloudWatch to produce business- and model-health metrics. Use these metrics to detect unusual behavior and drive investigations. Outputs from SageMaker Model Monitor or SageMaker Clarify reports can generate alarms and visualizations for review or incident response.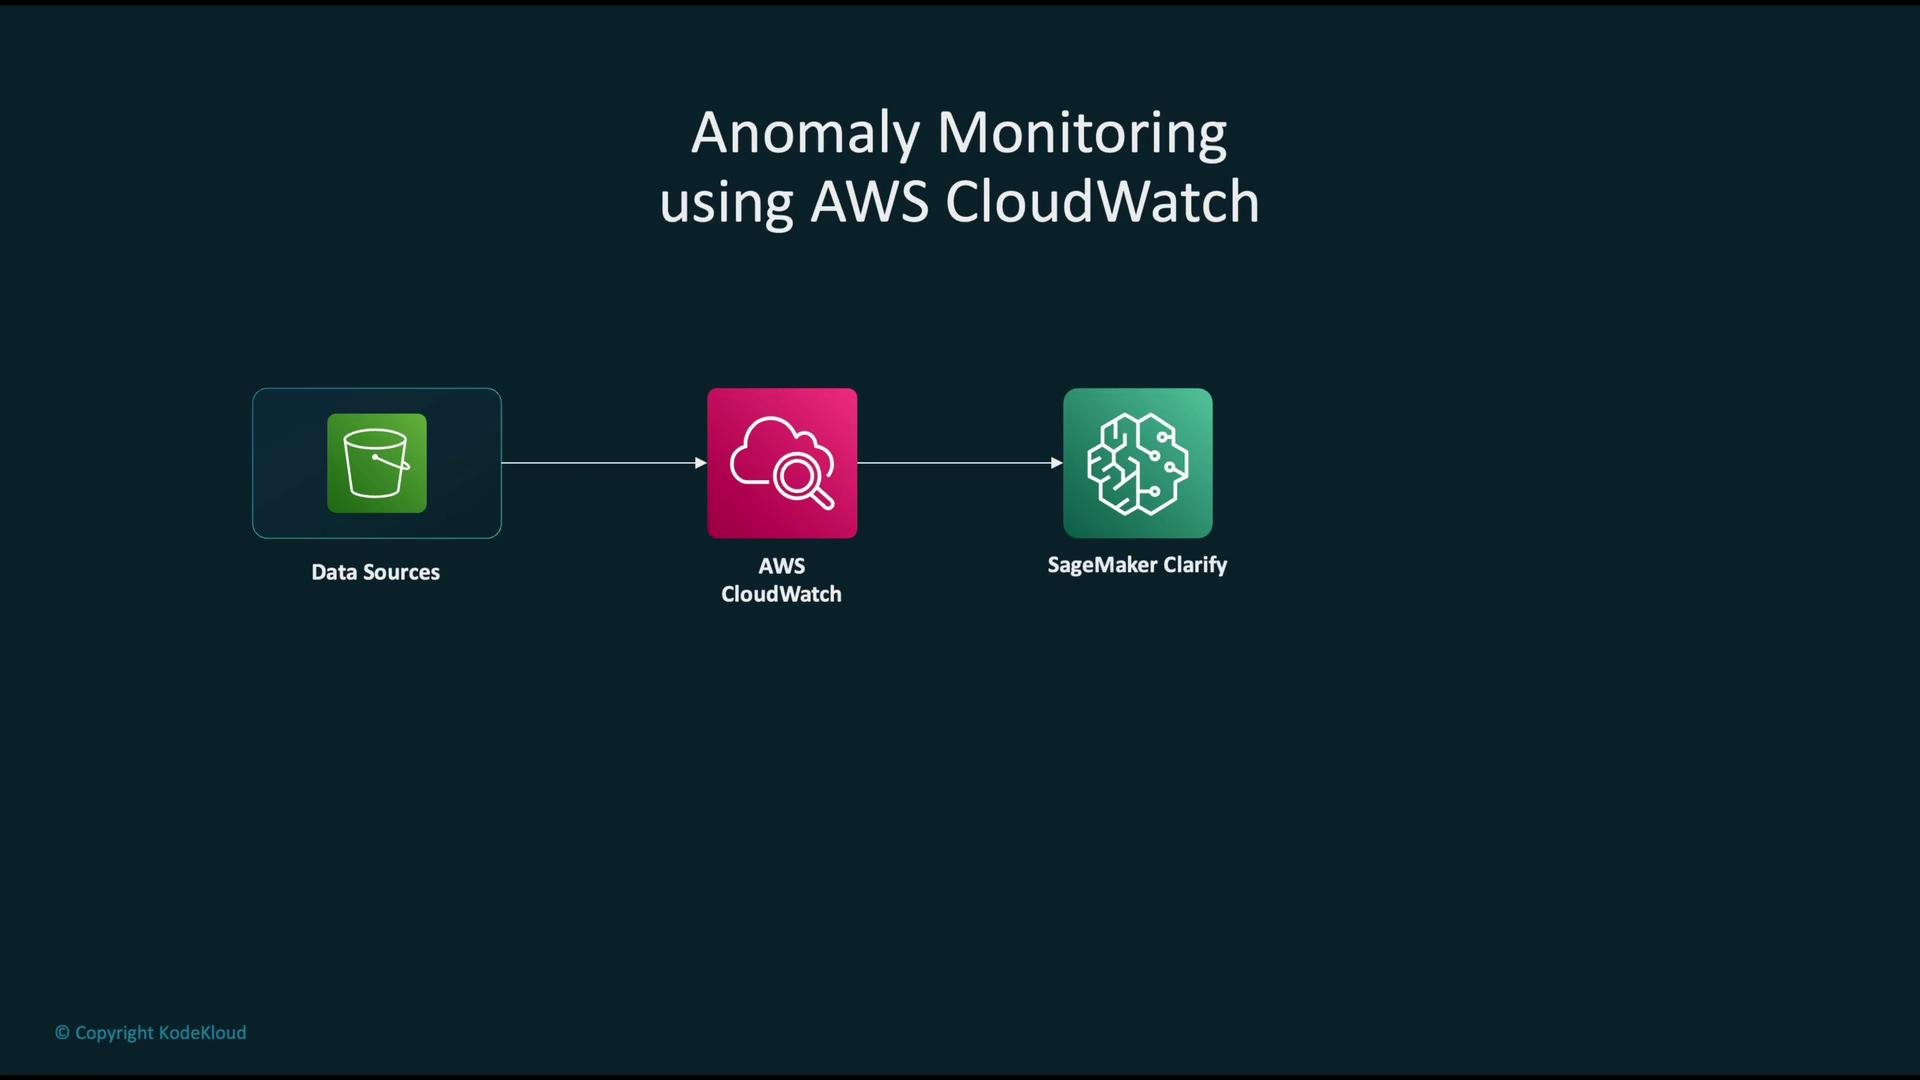
- produce drift-detection reports,
- populate dashboards for stakeholders,
- notify incident response teams, or
- invoke automated remediation (e.g., trigger retraining or rollback).
A/B testing and traffic management
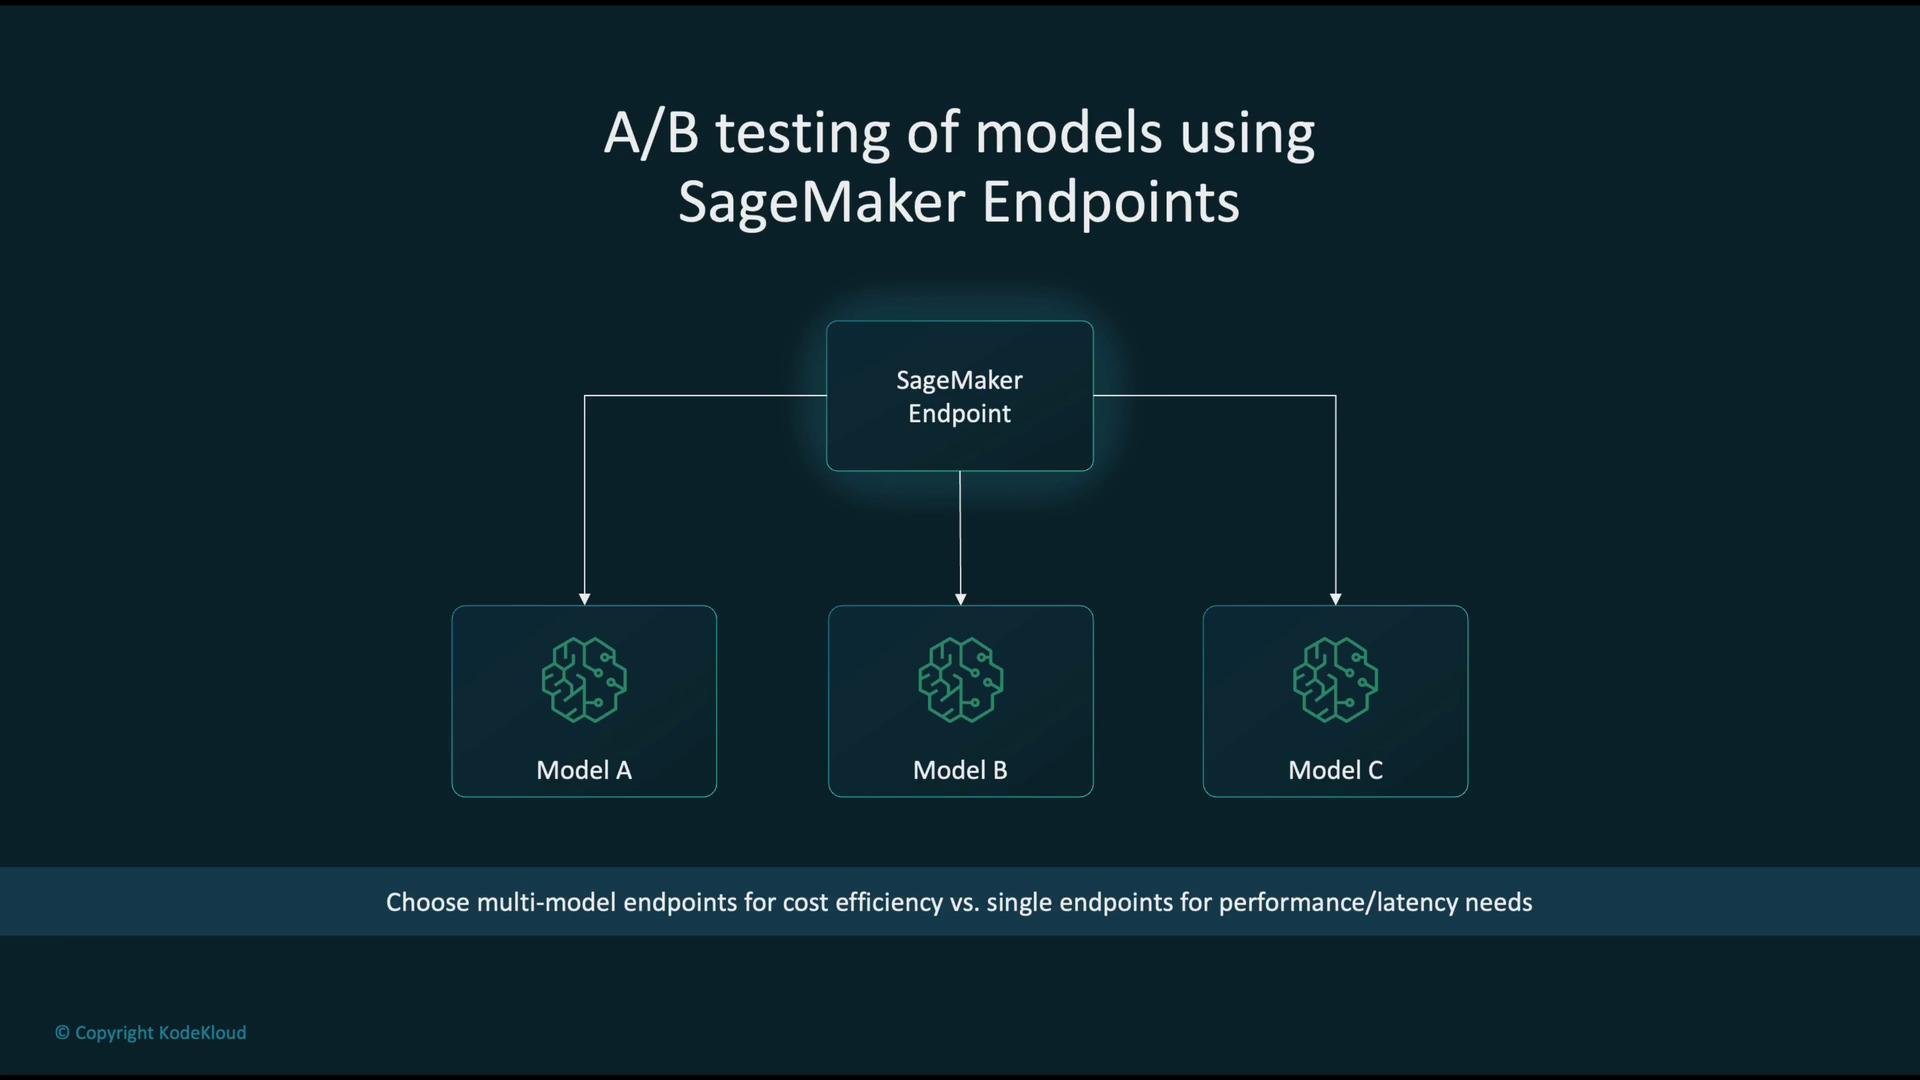
SageMaker endpoints support routing traffic to multiple model variants to compare performance and business impact.- Route fractions of production traffic to models A/B/C and compare metrics such as accuracy, latency, and business KPIs.
- Use multi-model endpoints to host many small or intermittently-used models from a single endpoint (cost-efficient).
- Use single dedicated endpoints for models that require consistent, low-latency performance.
Logging, auditability, and forensic analysis
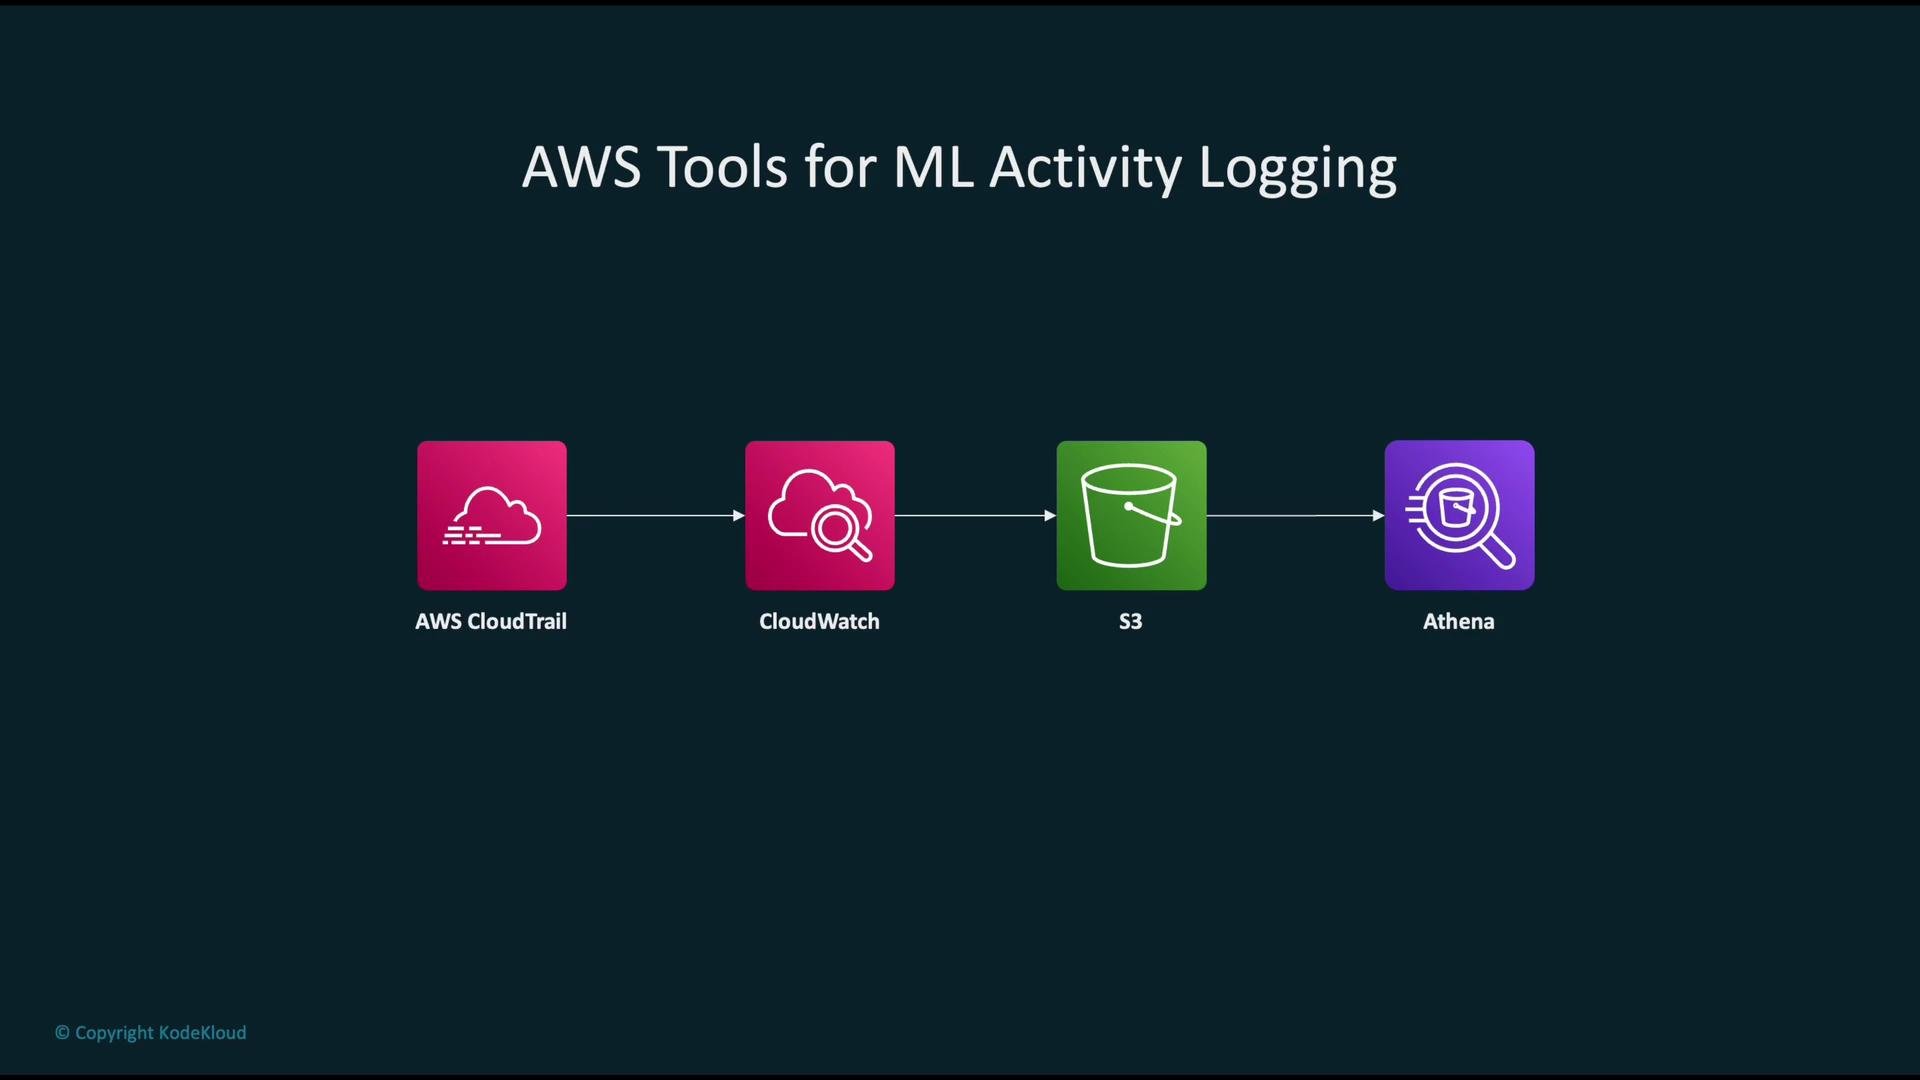
A common, robust pattern for ML activity logging and auditing:- AWS CloudTrail records API calls and user activity as events.
- Deliver CloudTrail events to CloudWatch Logs for near real-time monitoring and alerting.
- Archive logs to Amazon S3 for durable, low-cost, long-term storage.
- Use Amazon Athena to run SQL queries directly against logs in S3 for forensic analysis and audits.
Choosing instance types for each stage
Select instance families based on workload characteristics (training, inference, preprocessing) to balance cost and performance.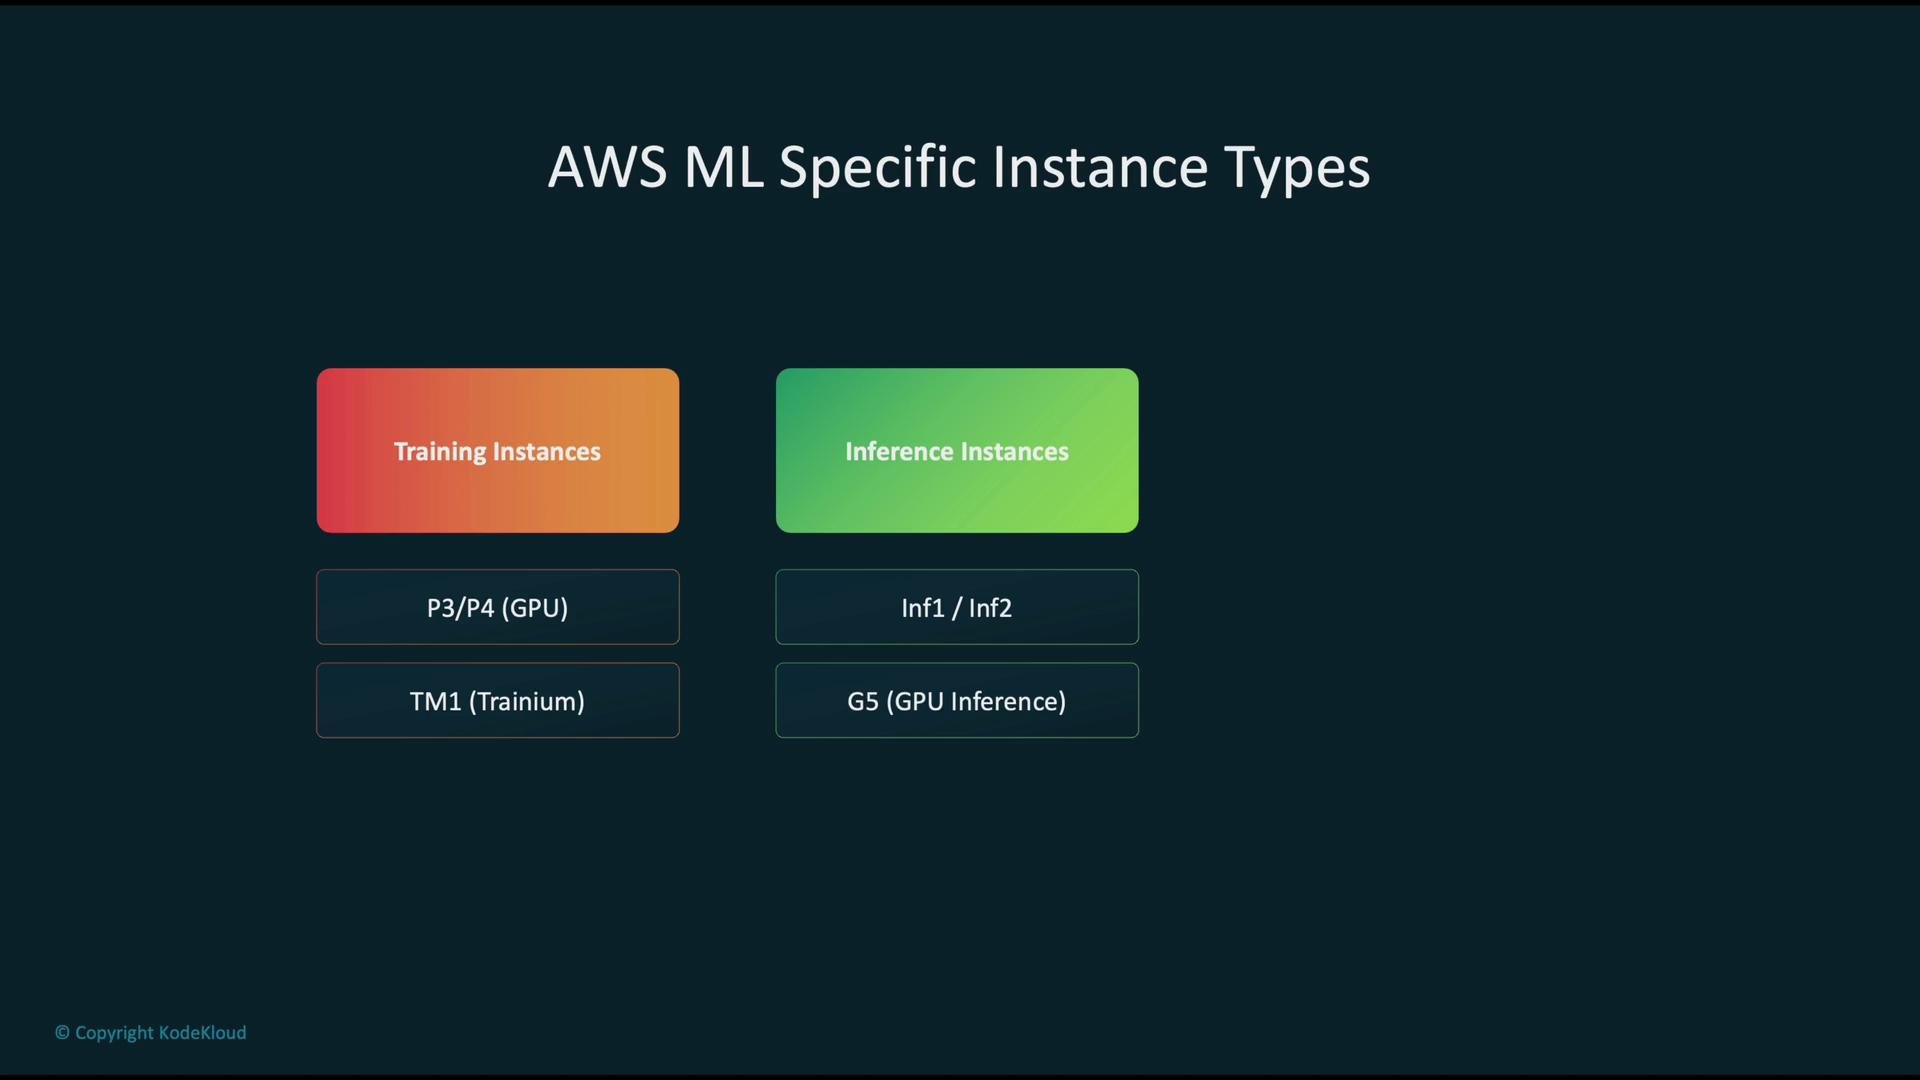
Right-sizing workflow
Right-sizing reduces cost while meeting performance SLAs. A recommended workflow:- Profile training and inference using SageMaker Debugger’s profiling tools and offline traces.
- Monitor CPU/GPU/memory utilization and latency using CloudWatch.
- Analyze cost patterns with AWS Cost Explorer.
- Use Compute Optimizer (fed by CloudWatch metrics and CloudTrail) to get concrete instance-type recommendations.
- Validate changes in staging and then implement instance-type adjustments.

Compliance and configuration governance
Enforce and automate compliance of SageMaker and related resources:- Use AWS Config to define desired configurations and rules for SageMaker resources.
- AWS Config evaluates resources against rules and generates compliance reports.
- Use CloudTrail to capture API-level activity for auditing and incident investigation.

Quick reference: AWS tools for ML observability and governance
Summary
Combine these AWS tools to build a resilient ML observability and governance stack:- Use CloudWatch for real-time operational monitoring and alerting.
- Use CloudTrail for a full audit trail of API calls and user actions.
- Use AWS Config for continuous configuration compliance checks.
- Use SageMaker Model Monitor (and related SageMaker tooling) to detect data drift and model-quality issues and feed automated remediation pipelines.
Automate detection and response: feed Model Monitor and CloudWatch outputs into an automated pipeline (for example, Lambda → CodePipeline) to retrain, validate, and redeploy models when drift or anomalies are detected. This keeps model performance stable while minimizing manual intervention.
Links and references
- SageMaker Model Monitor: https://docs.aws.amazon.com/sagemaker/latest/dg/model-monitor.html
- Amazon CloudWatch: https://aws.amazon.com/cloudwatch/
- SageMaker endpoints: https://docs.aws.amazon.com/sagemaker/latest/dg/endpoint.html
- SageMaker Clarify: https://aws.amazon.com/sagemaker/clarify/
- Amazon Lookout for Metrics: https://aws.amazon.com/lookout-for-metrics/
- Multi-model endpoints: https://docs.aws.amazon.com/sagemaker/latest/dg/multi-model-endpoints.html
- AWS CloudTrail: https://aws.amazon.com/cloudtrail/
- Amazon S3: https://aws.amazon.com/s3/
- Amazon Athena: https://aws.amazon.com/athena/
- EC2 instance families: P3/P4: https://aws.amazon.com/ec2/instance-types/p3/ P4: https://aws.amazon.com/ec2/instance-types/p4/ Inferentia: https://aws.amazon.com/machine-learning/inferentia/ G5: https://aws.amazon.com/ec2/instance-types/g5/
- SageMaker Debugger: https://docs.aws.amazon.com/sagemaker/latest/dg/debugger.html
- AWS Cost Explorer: https://aws.amazon.com/aws-cost-management/aws-cost-explorer/
- Compute Optimizer: https://aws.amazon.com/compute-optimizer/
- AWS Config: https://aws.amazon.com/config/