

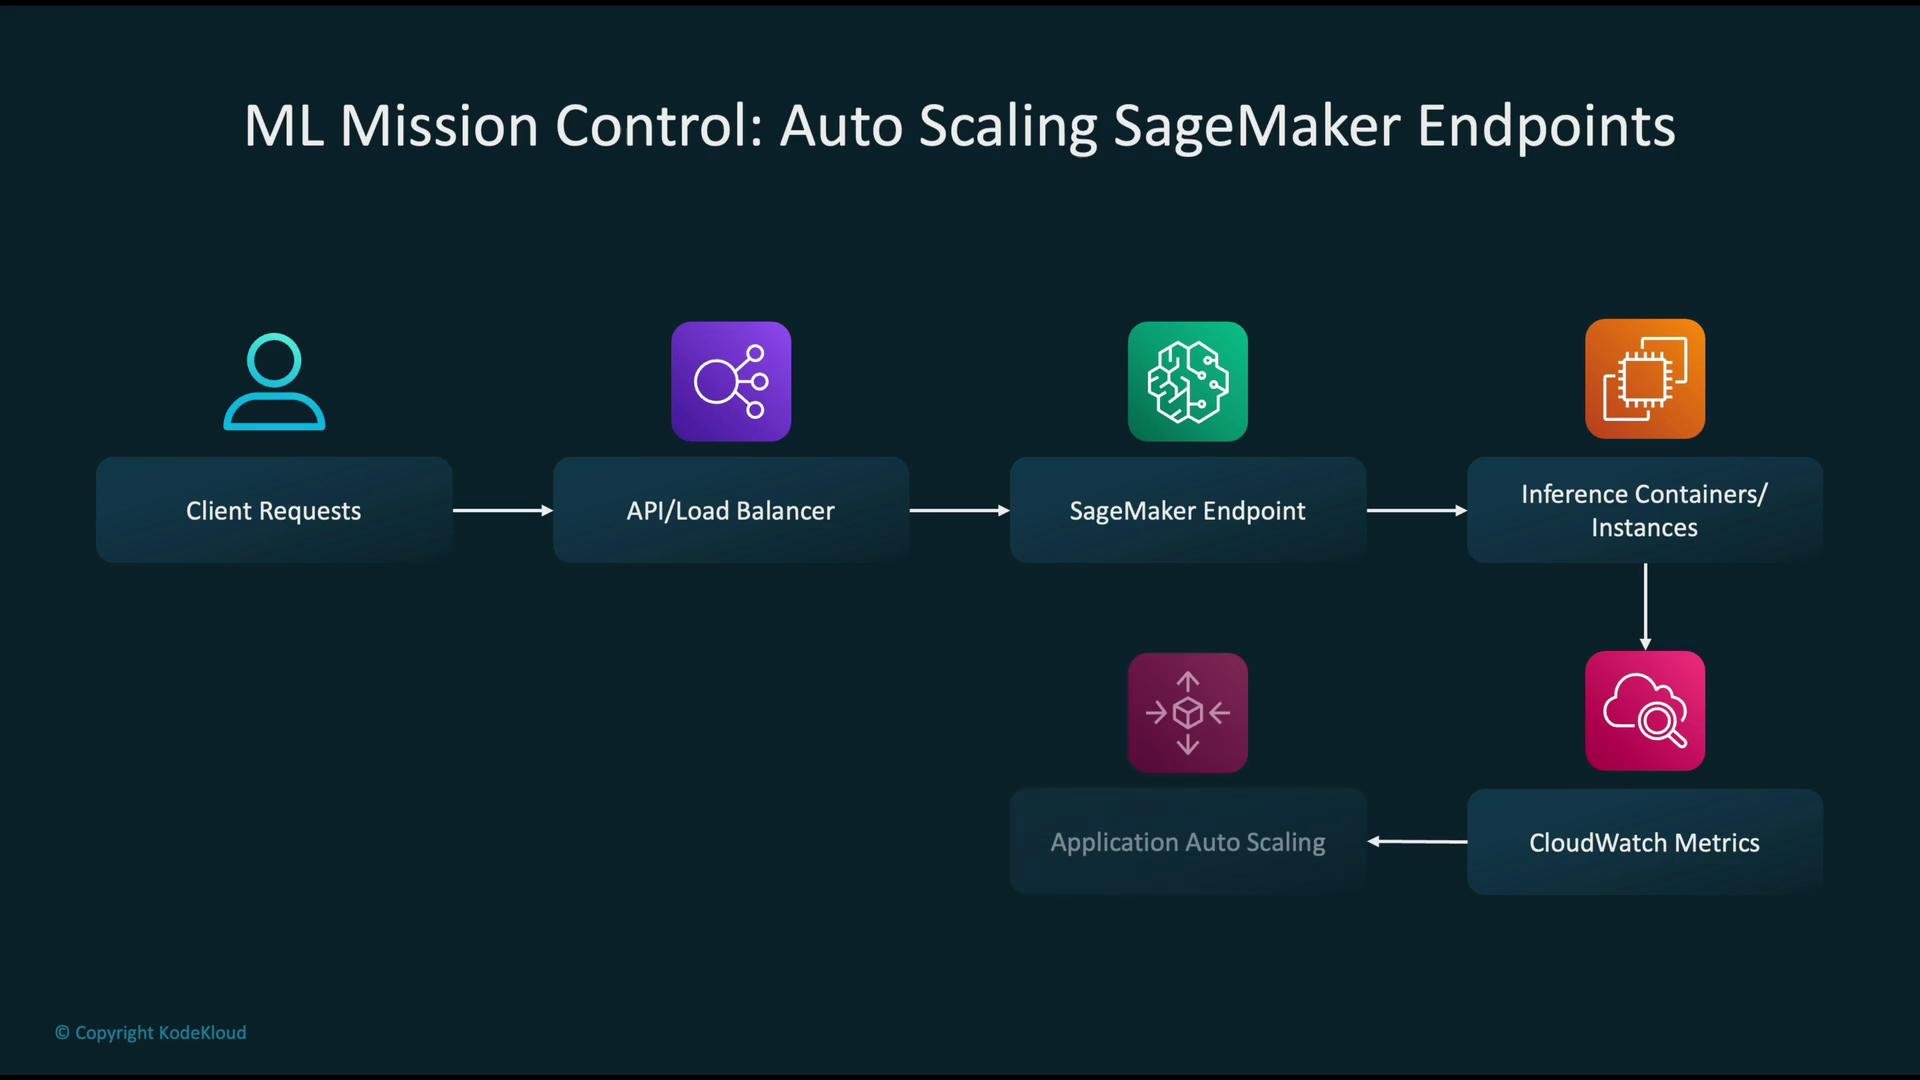
Why auto scaling matters
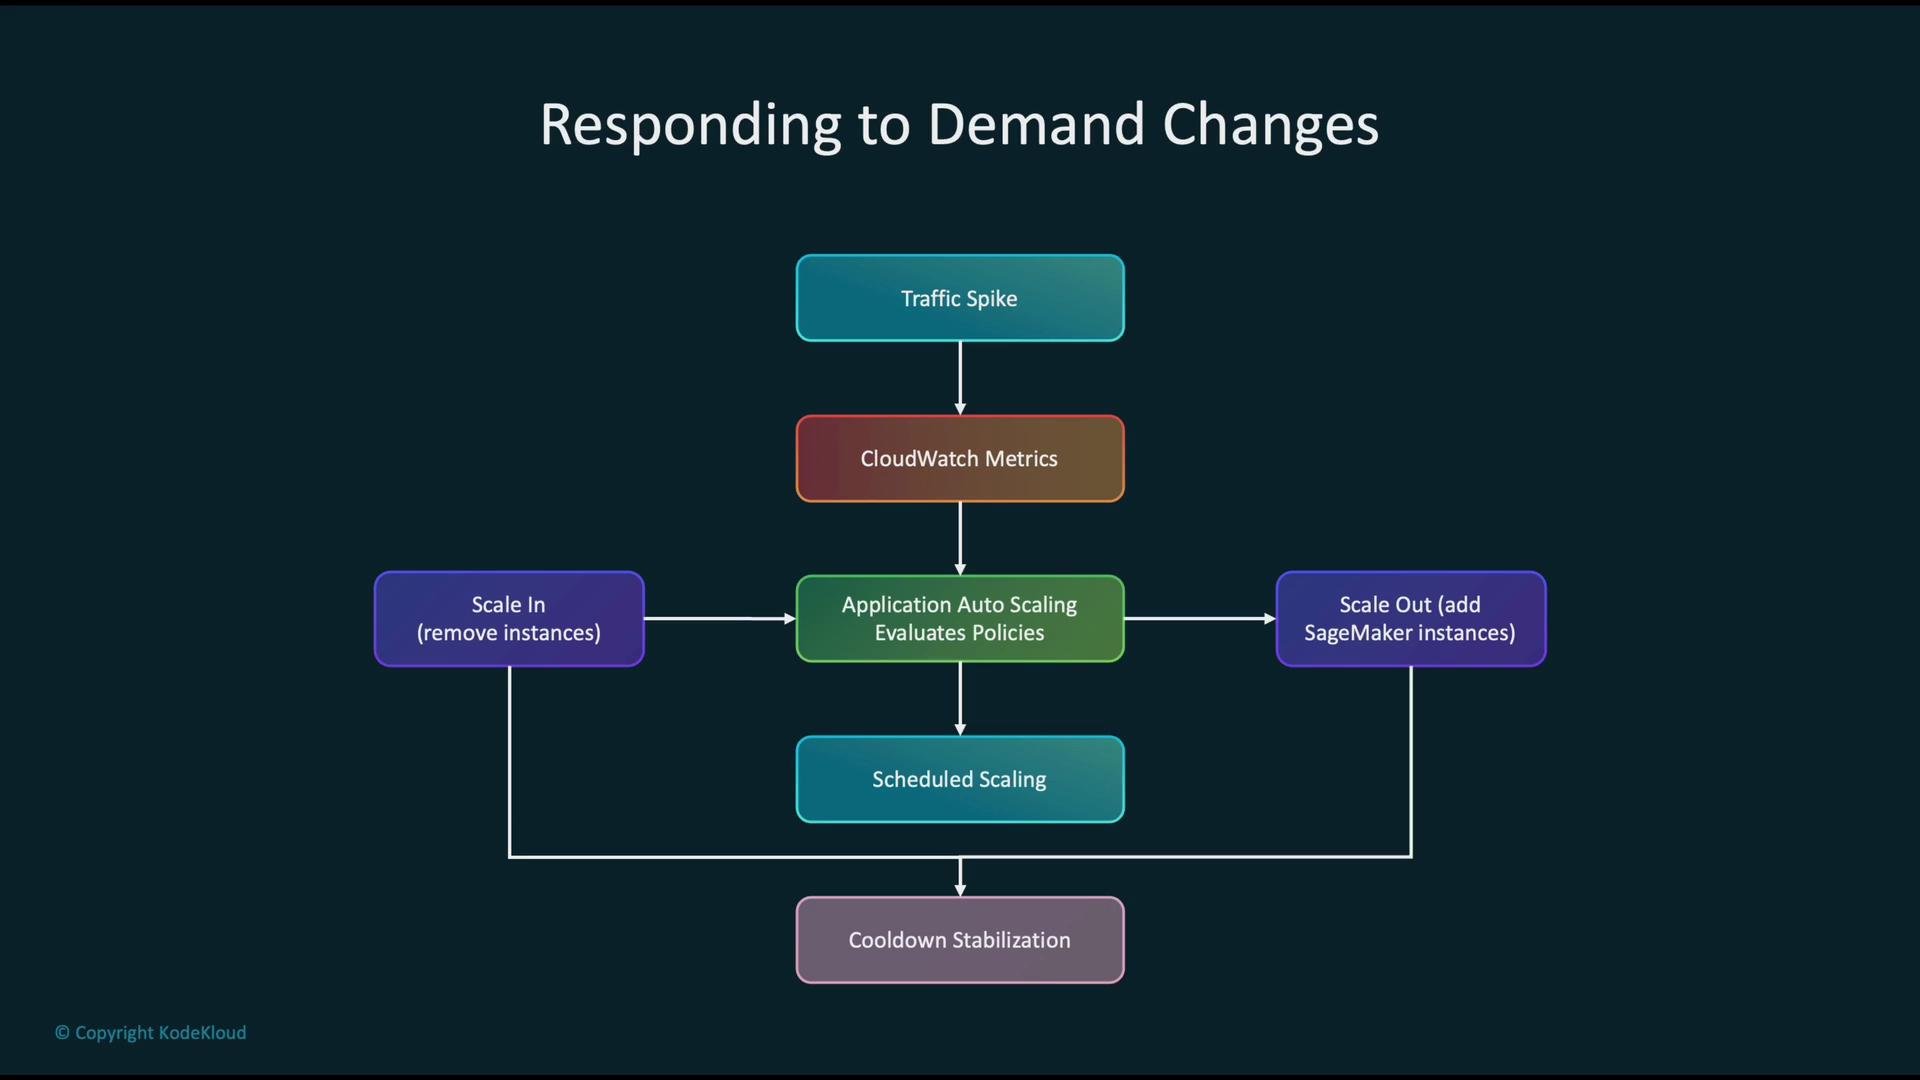
When traffic patterns change—such as sudden spikes—CloudWatch metrics capture the increased activity and trigger Auto Scaling. The endpoint scales out to preserve latency and throughput, then scales in when traffic subsides to reduce cost. Scaling decisions trade off short-term cost increases for sustained SLA compliance.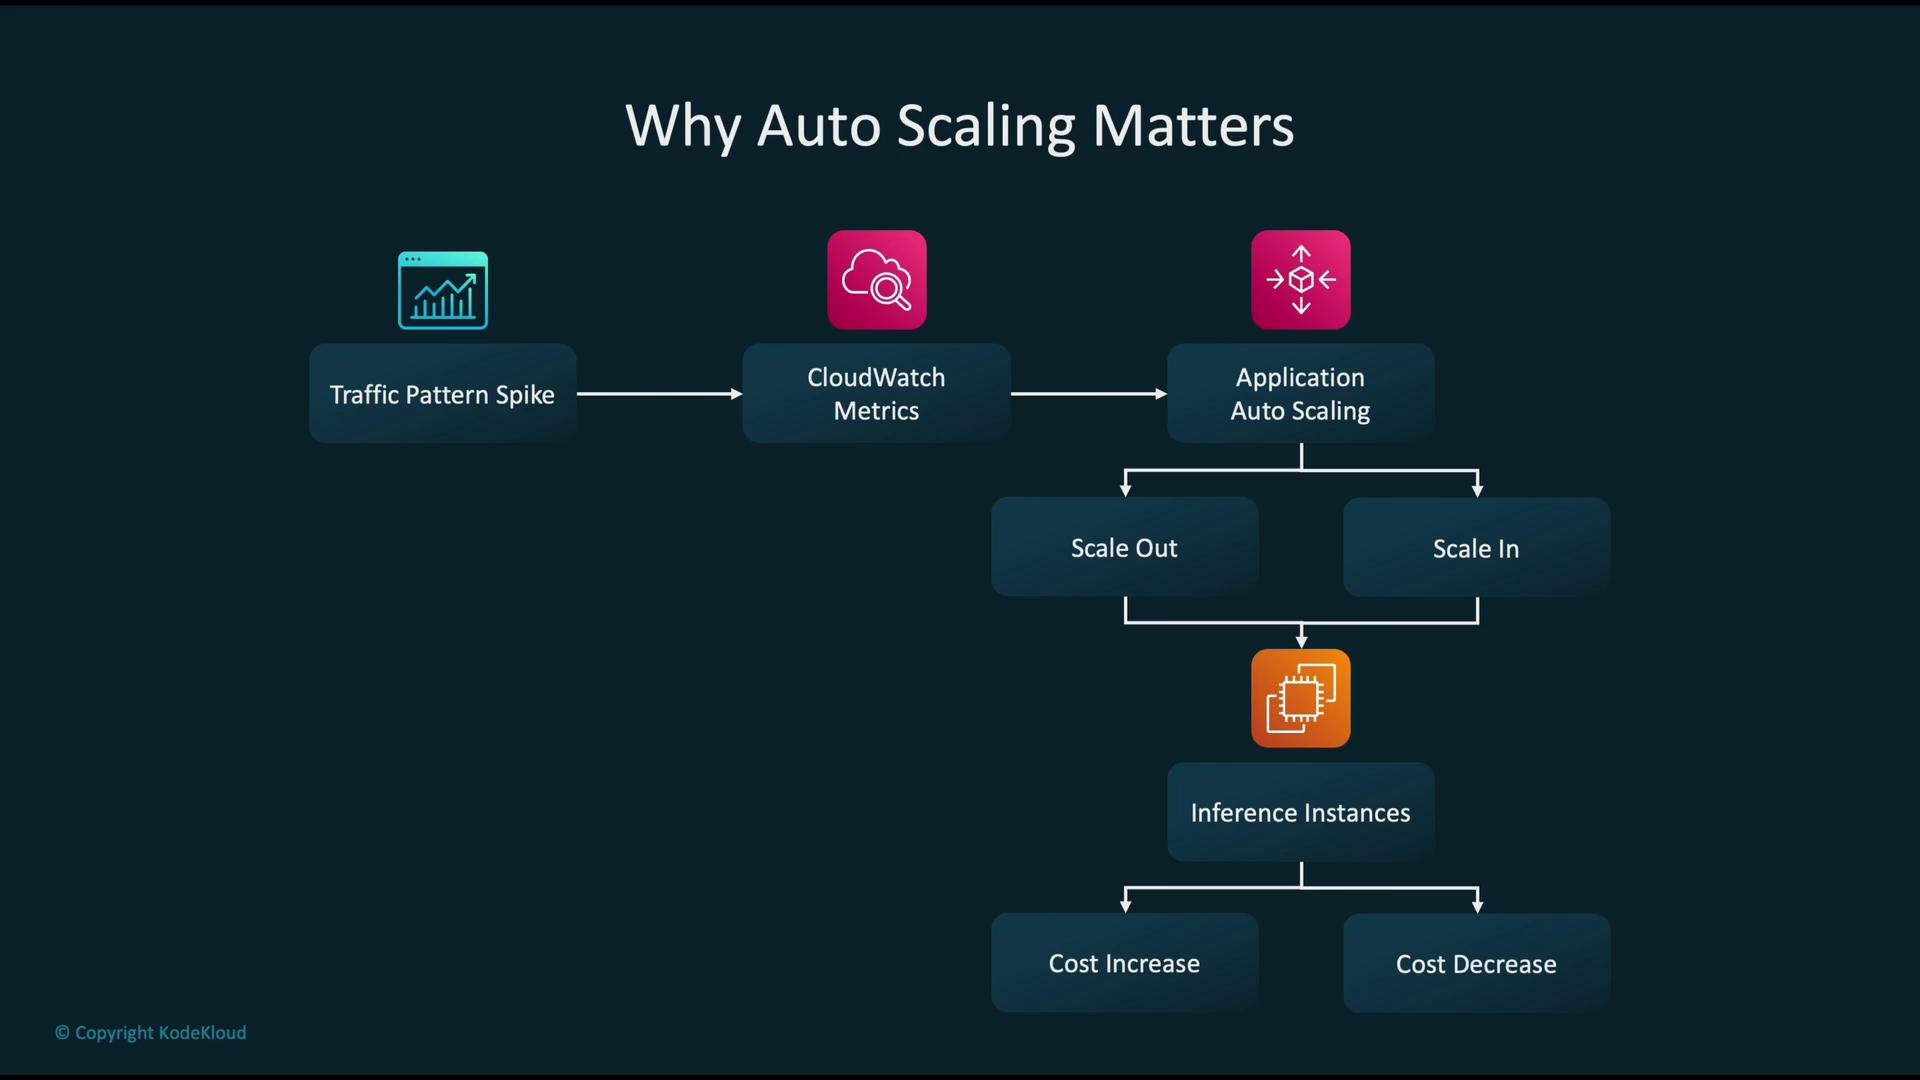
Auto Scaling toolkit and policy types
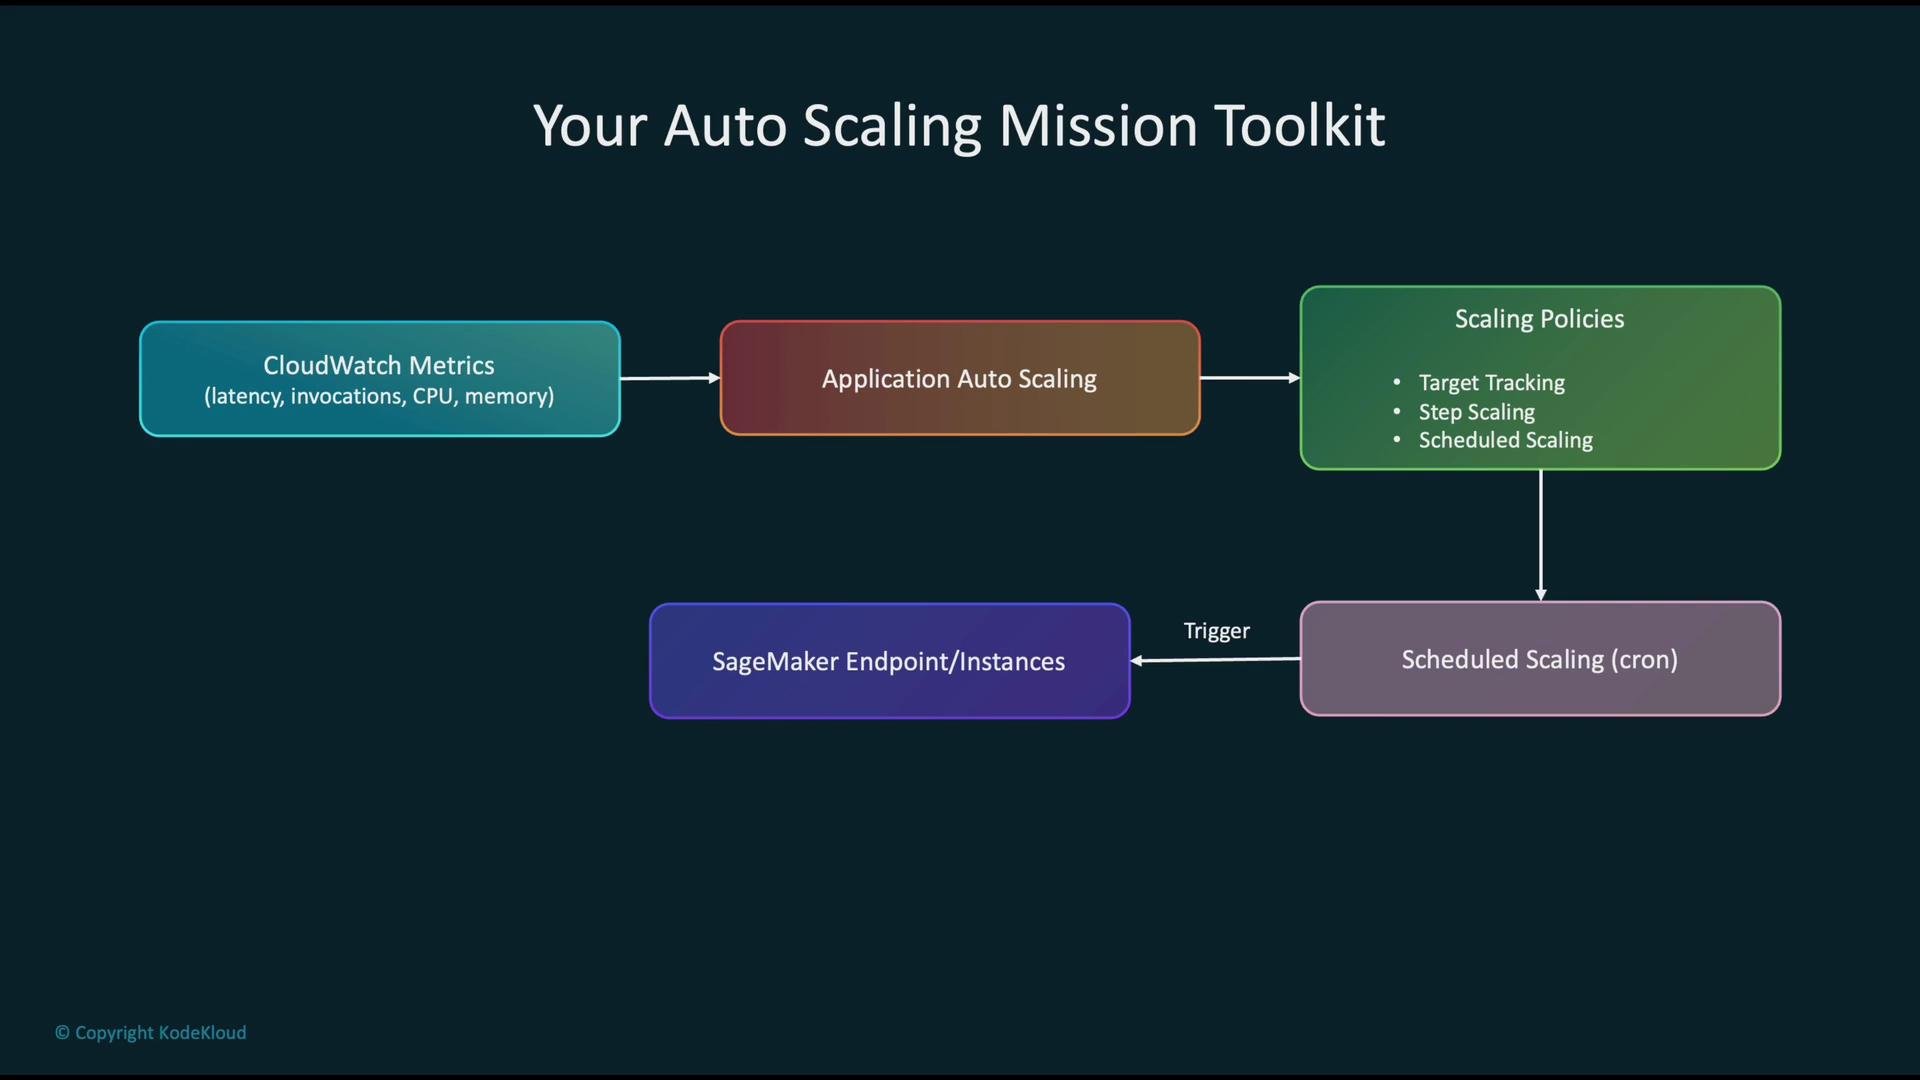
CloudWatch collects metrics (latency, CPU, memory, invocation count). Application Auto Scaling evaluates those metrics against your configured policies and then changes endpoint capacity.- Target tracking: automatically adjusts capacity to maintain a metric at a target value (recommended for SLA-driven latency targets).
- Step scaling: triggers discrete scaling actions at defined thresholds (recommended when you need staged changes).
- Scheduled scaling: pre-allocates capacity at predictable times (useful for known traffic patterns).
Monitoring metrics and alarms
Key metrics to monitor:- Latency percentiles:
p95,p99(use for SLA targets) - Invocation count / requests per second
- CPU / memory utilization
- Model-specific indicators (e.g., batch queue length)
Use latency percentiles like
p95 or p99 for SLA-driven targets. Set conservative thresholds and reasonable cooldown/stabilization windows to reduce scaling oscillation.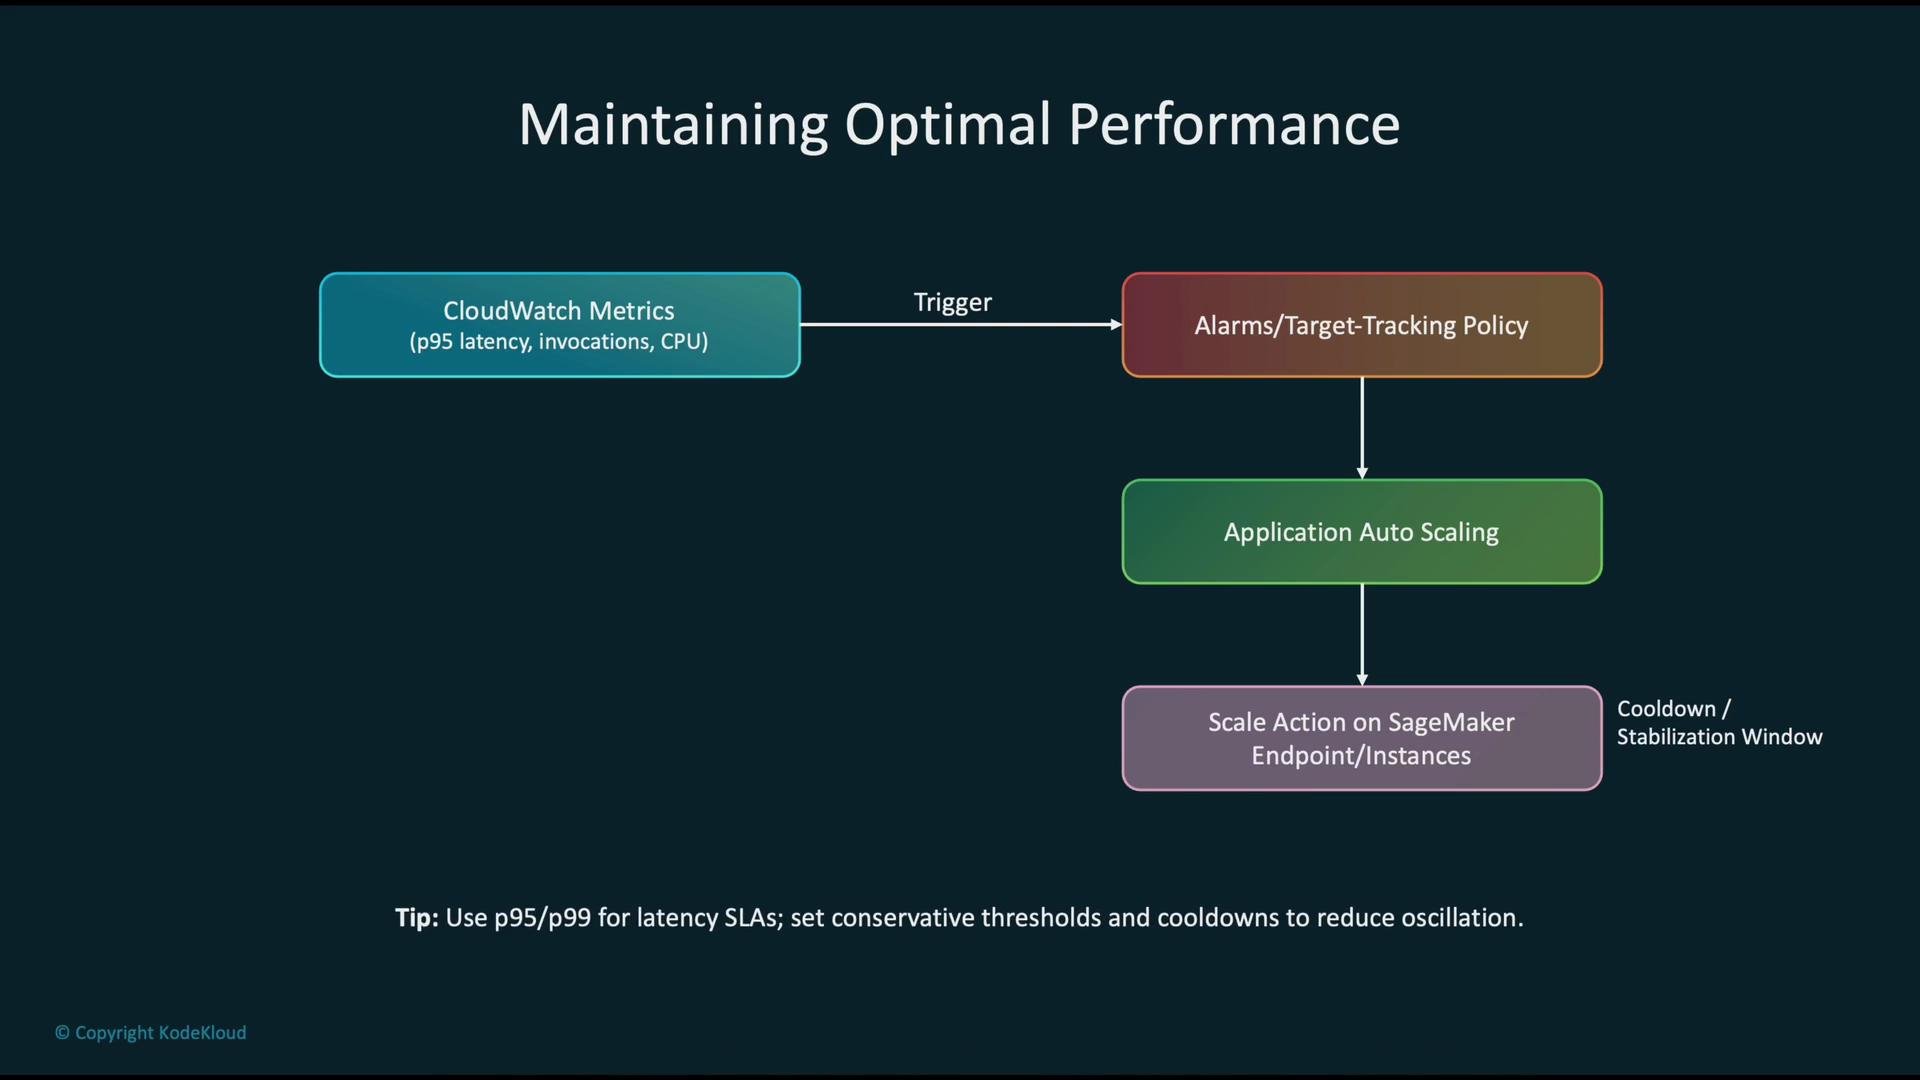
Automatic response to demand changes
CloudWatch evaluates metrics continuously. Application Auto Scaling compares the observations to your policies and scales out when load rises or scales in when demand falls. Scheduled scaling handles predictable adjustments. Always configure cooldown periods so the system stabilizes before another scaling action occurs.Avoid very short cooldown windows; they can cause rapid scale-in/scale-out oscillations. Tune cooldowns and aggregation periods for the metric you rely on.
Time-based (scheduled) scaling
Scheduled scaling is useful for predictable load patterns (for example, scale up every weekday at 08:00). Combine scheduled scaling with dynamic policies to cover both predictable and unexpected spikes.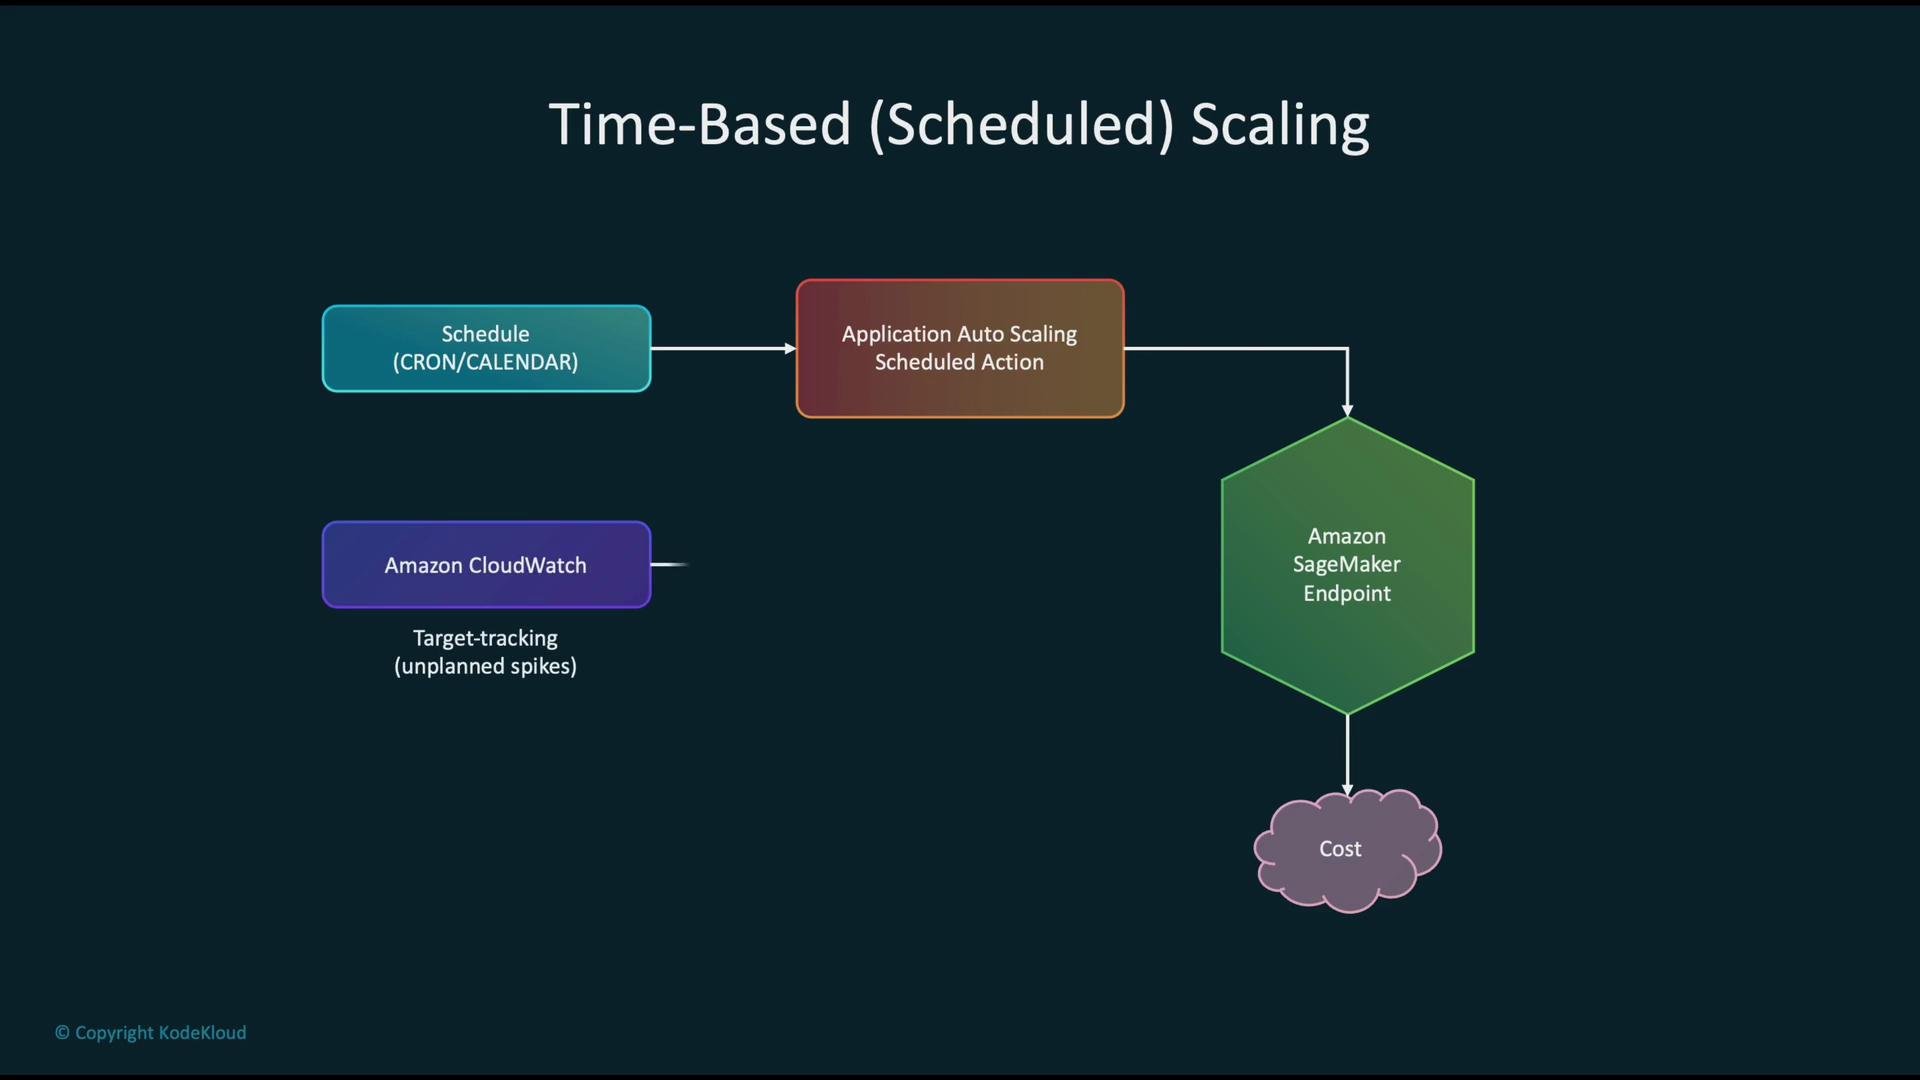
Multi-model scaling pattern
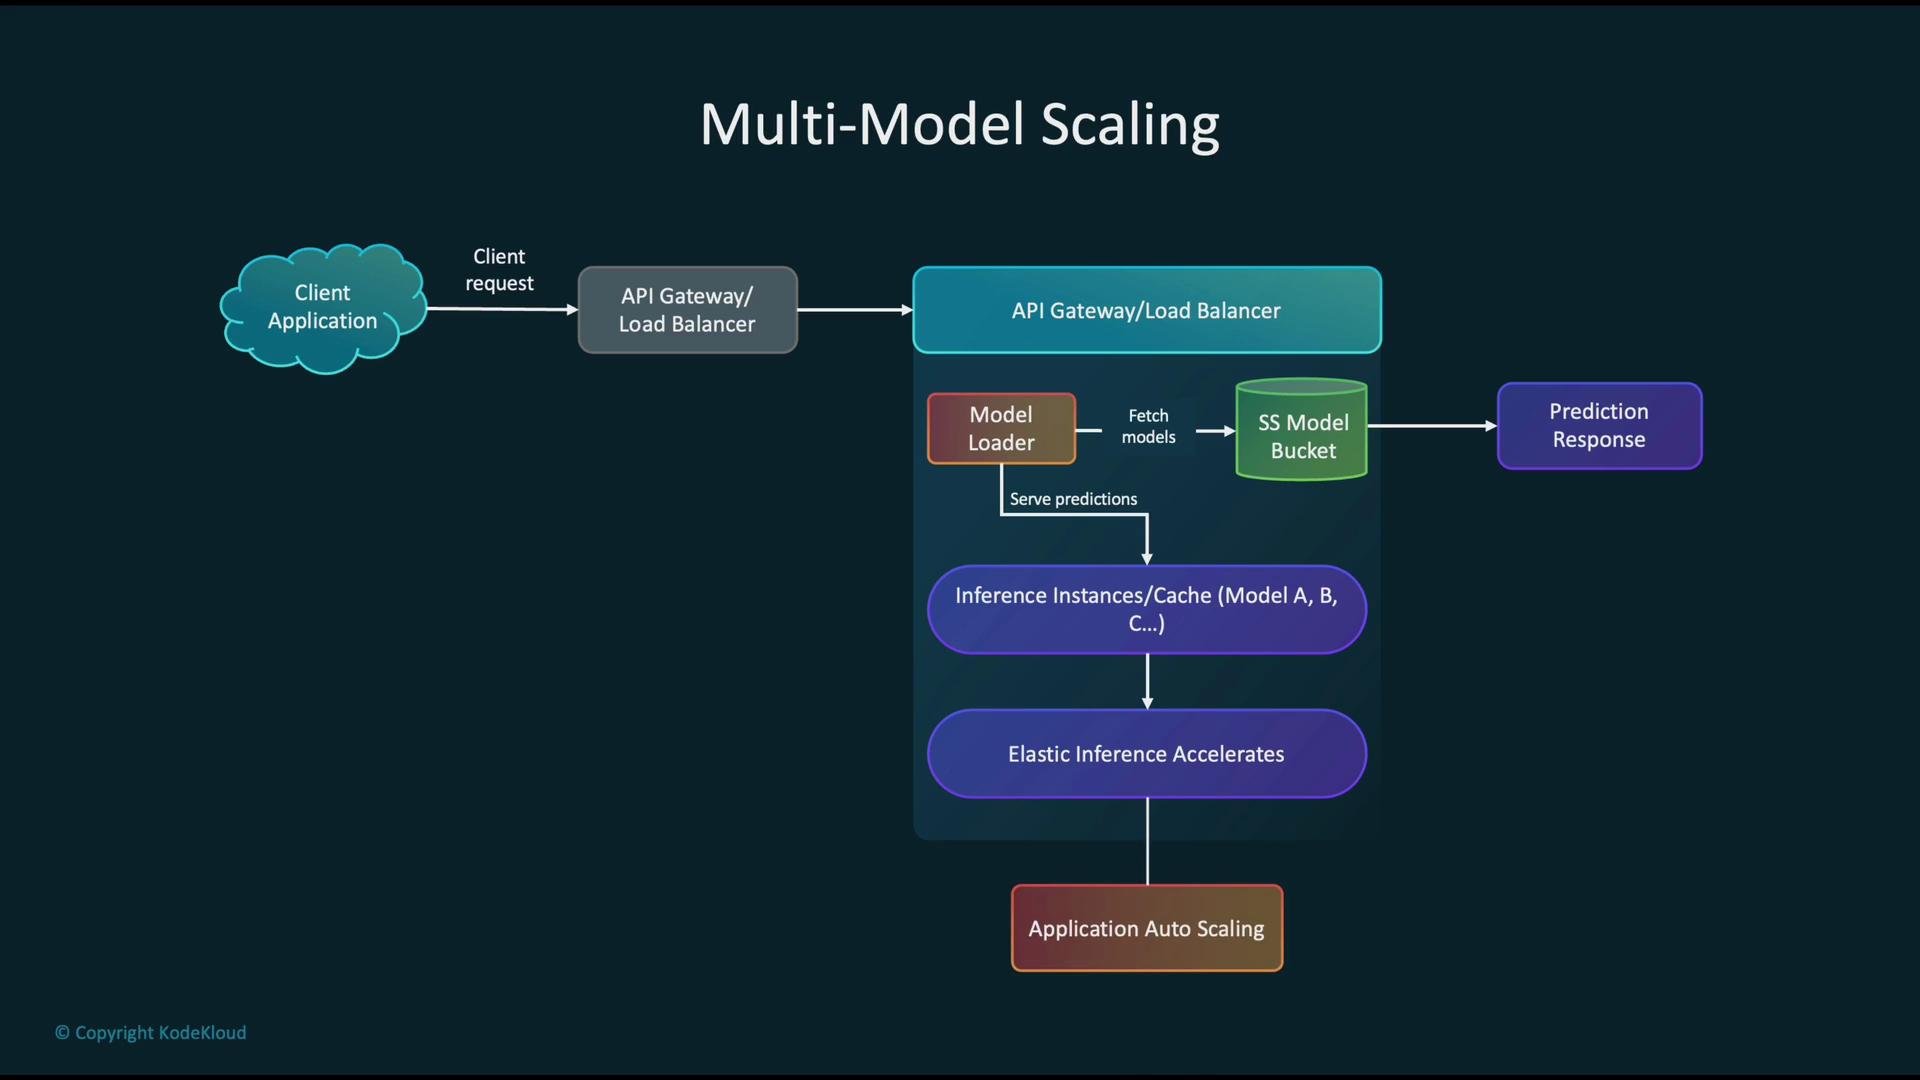
In multi-model endpoints, the request flow often looks like:- Client sends a prediction request via API Gateway or a load balancer.
- Model loader retrieves the required model from central storage (e.g., Amazon S3).
- The model is loaded onto an inference instance (optionally with accelerators like Elastic Inference).
- Inference is executed and a response is returned to the client.
- CloudWatch collects operational metrics and Auto Scaling adjusts capacity based on policy.
Observability and operations
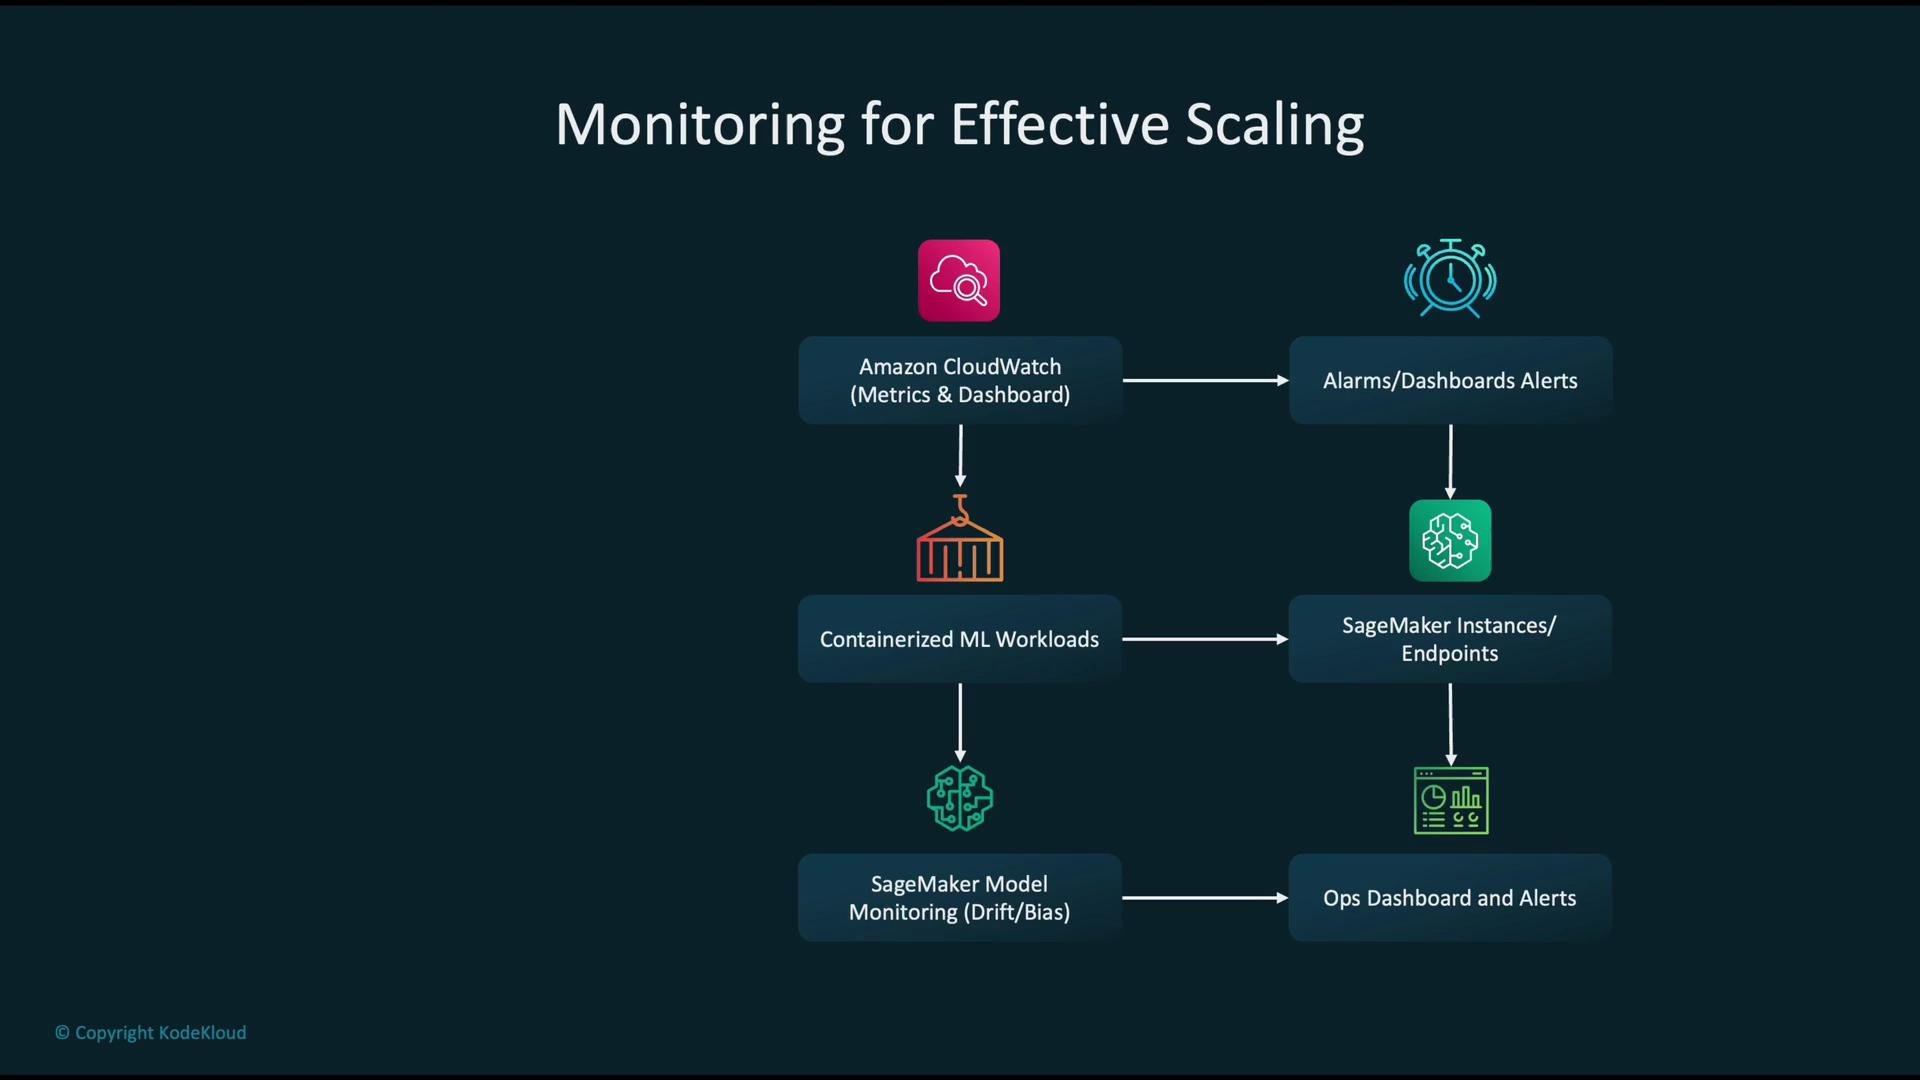
- Emit CloudWatch metrics from containerized ML workloads.
- Surface alarms and dashboards for latency, error rates, and instance utilization.
- Log scaling actions to CloudTrail for auditability.
- Use SageMaker Model Monitor to detect data drift, prediction skew, or model quality regressions.
- Consolidate infra and model-monitoring into a single ops dashboard for faster incident response.
Security and compliance
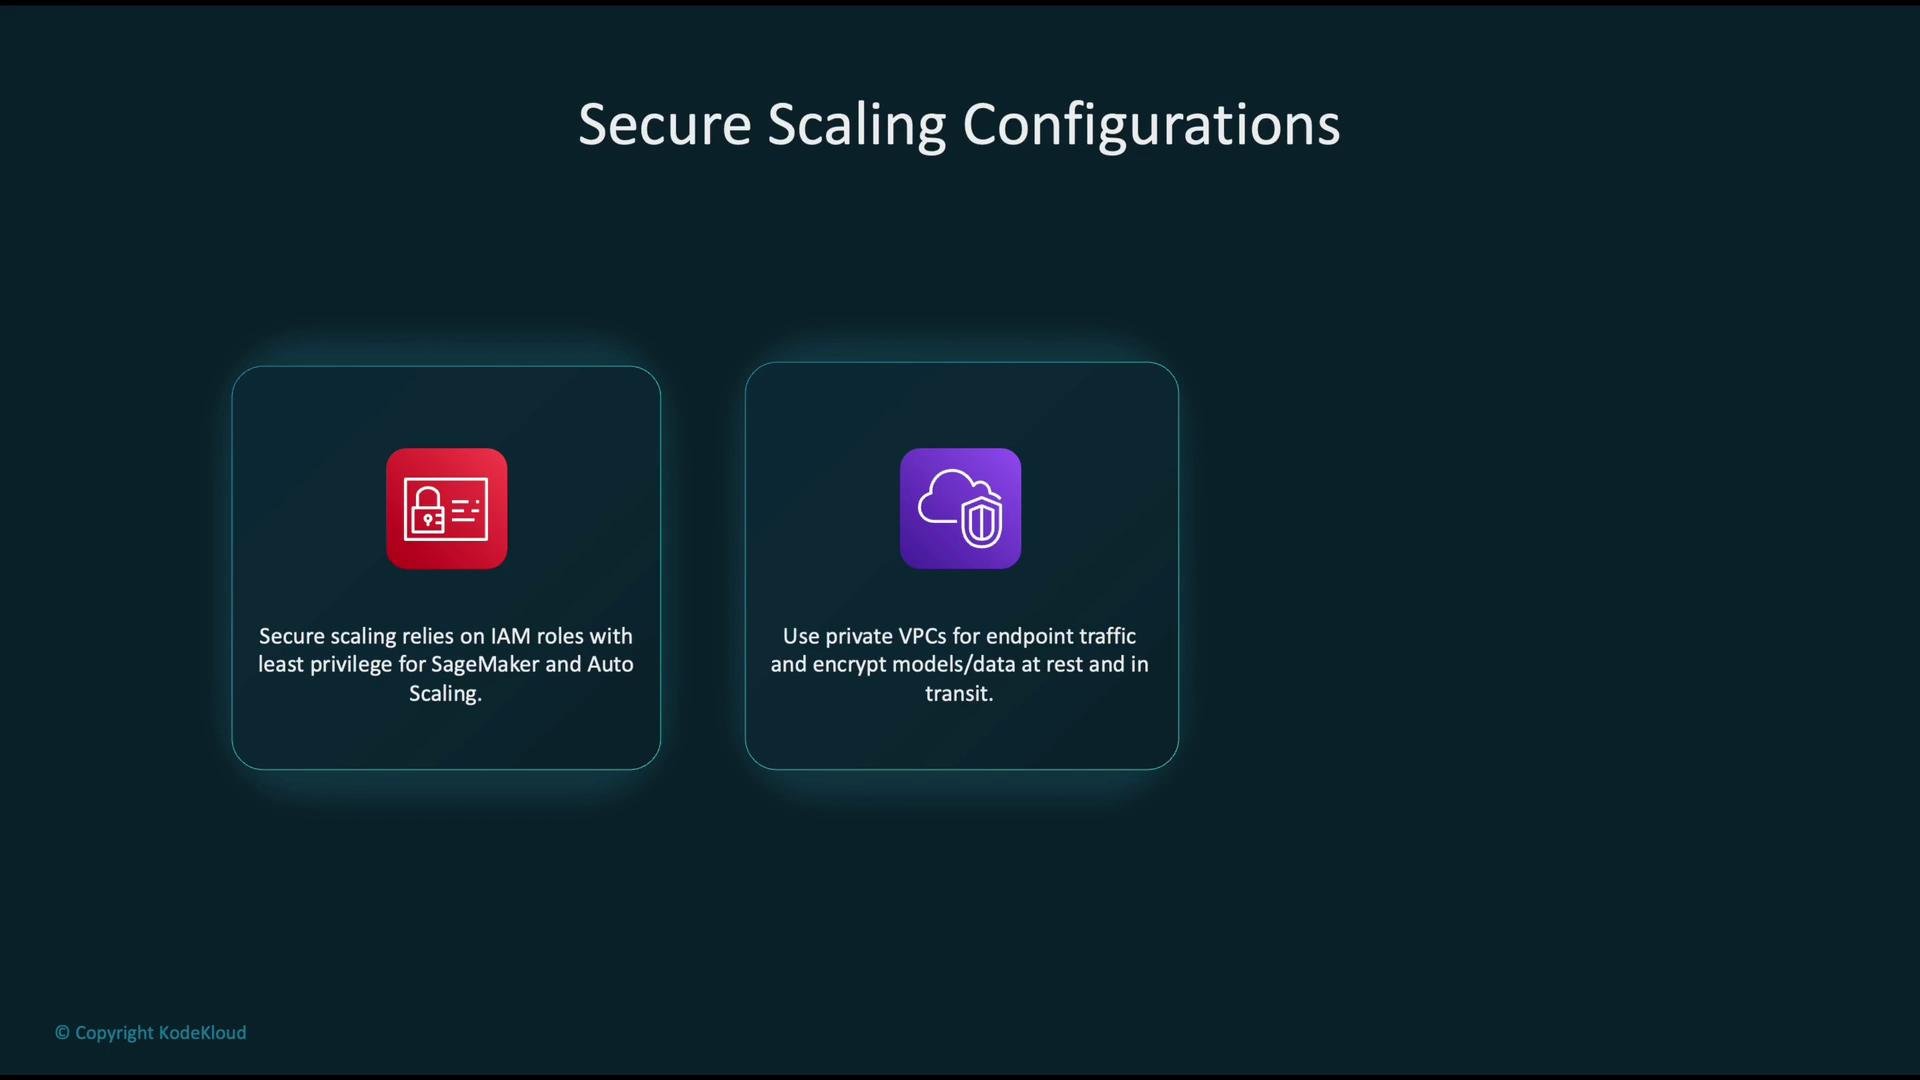
Apply these three core controls for secure scaling:- Least-privilege IAM roles for SageMaker, Application Auto Scaling, and any service integrations.
- Private VPCs and VPC endpoints to isolate traffic; encrypt data and model artifacts at rest and in transit.
- Scan container images (Amazon ECR) and enforce image provenance and vulnerability checks before deploying scaled instances.
Cost and automation best practices
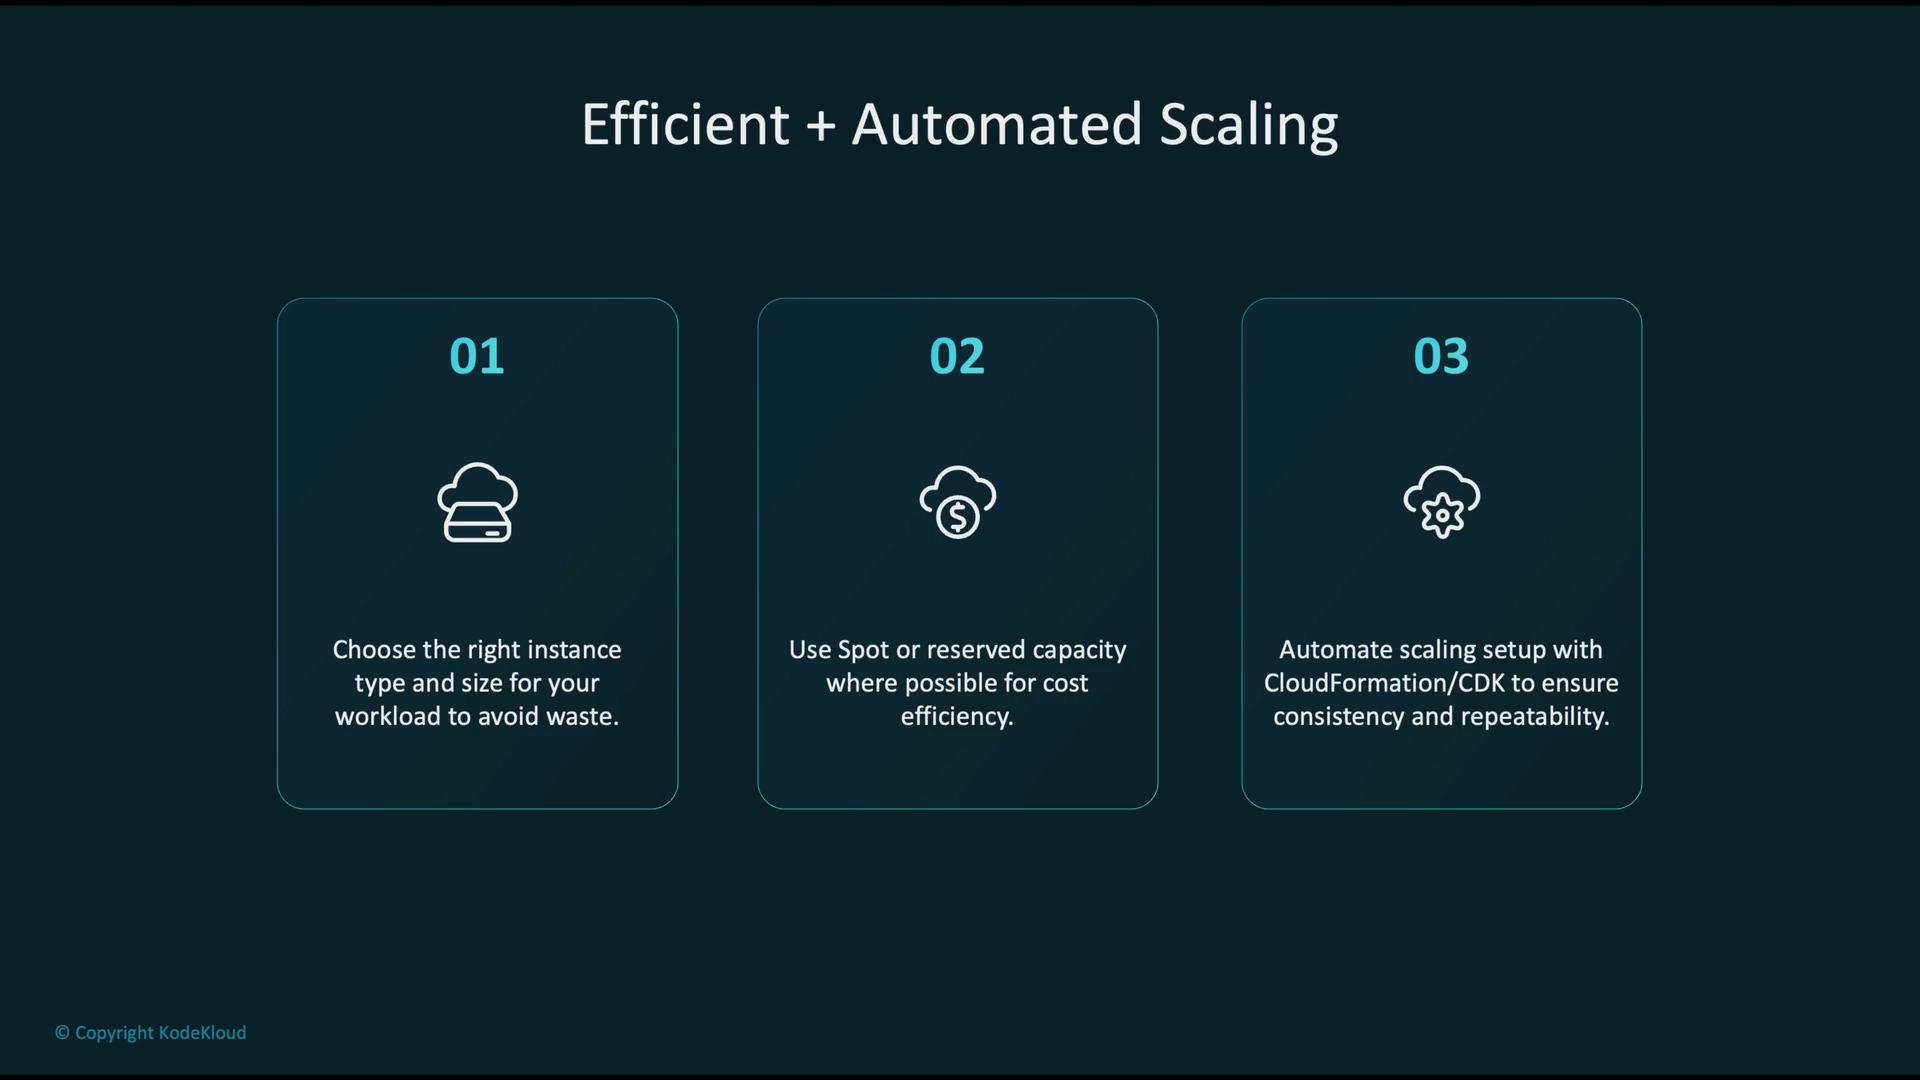
Three practical steps to optimize automated scaling:- Right-size instances: choose instance families and sizes that match CPU, memory, and accelerator requirements.
- Use Reserved capacity or Savings Plans where appropriate; consider Spot instances for non-critical batch workloads (account for preemption risk).
- Automate everything with infrastructure-as-code (CloudFormation, CDK for Terraform with TypeScript, Terraform) to ensure repeatability and reduce manual mistakes.
Patterns and anti-patterns
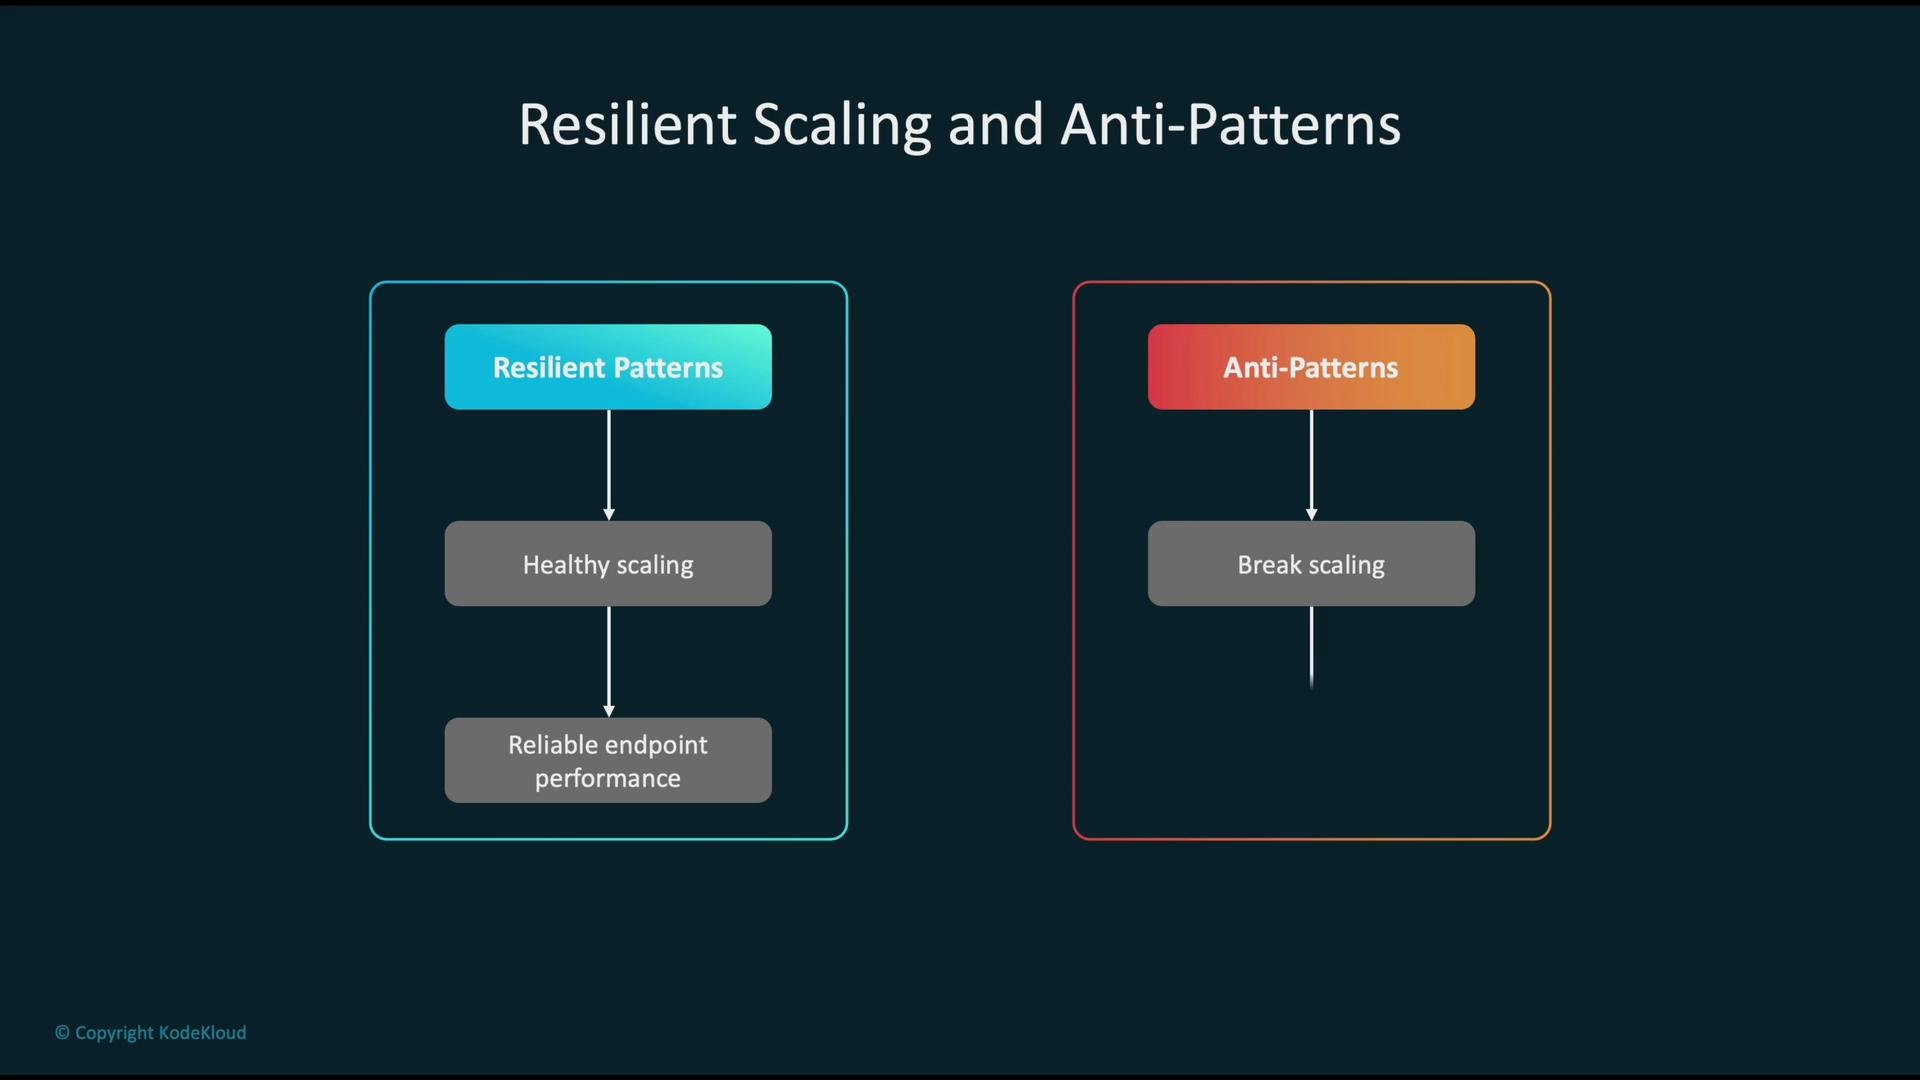
Follow resilient scaling patterns:- Conservative thresholds and gradual step-scaling
- Robust monitoring and observability
- Reasonable cooldown windows
- Aggressive thresholds that force unnecessary scaling
- No cooldowns or stabilization (causes oscillation)
- Unchecked scheduled scaling that misaligns with real demand
Common use case — real-time fraud detection
A fraud detection endpoint receives a stream of transactions. Auto Scaling adjusts inference capacity to match volume, ensuring low-latency predictions and real-time flagging of suspicious transactions.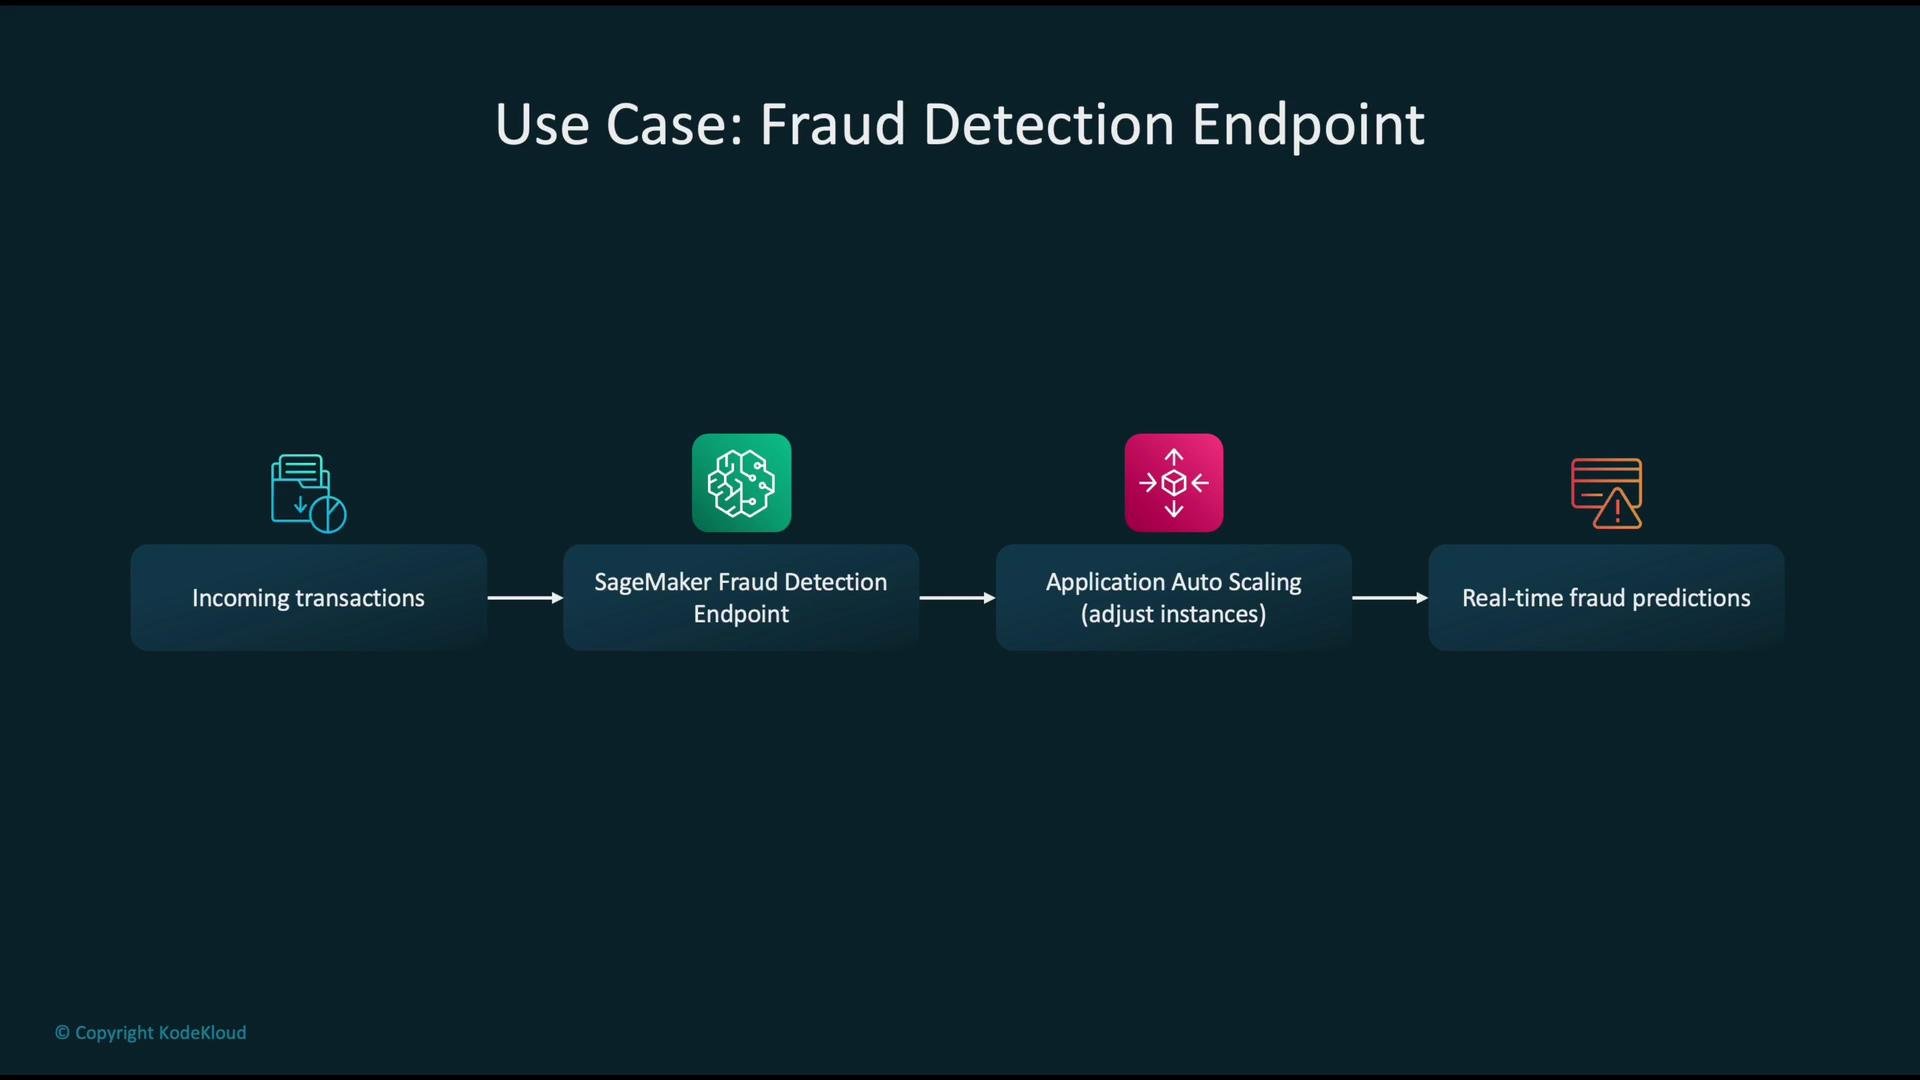
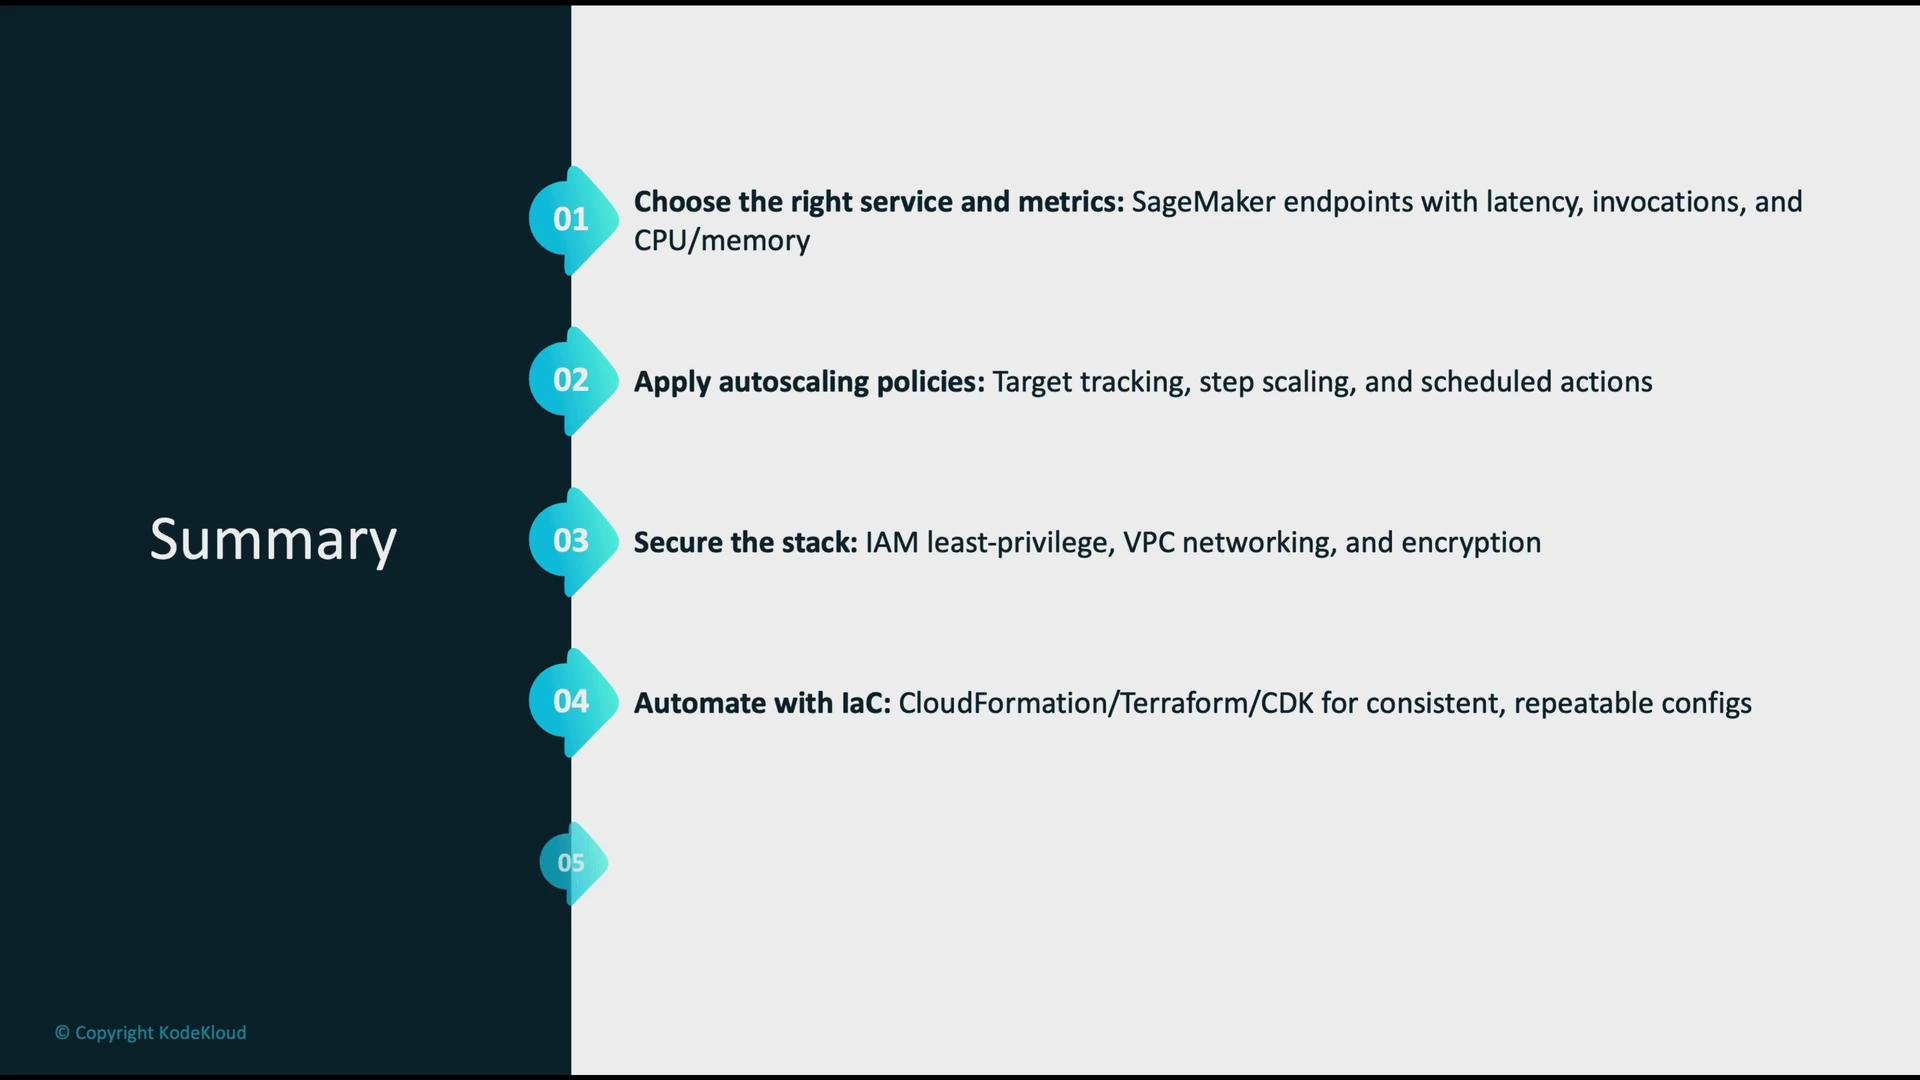
Key takeaways
- Choose the right metrics: latency percentiles (
p95/p99), invocation counts, resource utilization. - Pick the appropriate scaling policy: target tracking for SLAs, step scaling for staged control, scheduled scaling for predictable traffic.
- Secure your stack with least-privilege IAM, VPC isolation, and encryption.
- Automate deployments and scaling config with infrastructure-as-code for consistency and faster recovery.
- Continuously monitor infra, application, and model health (CloudWatch, CloudTrail, SageMaker Model Monitor) and tune thresholds and cooldowns to prevent oscillation.
Links and references
- Amazon SageMaker documentation
- Amazon CloudWatch documentation
- Application Auto Scaling
- AWS IAM best practices
- SageMaker Model Monitor