

Cost Analysis: visualize and explore spend
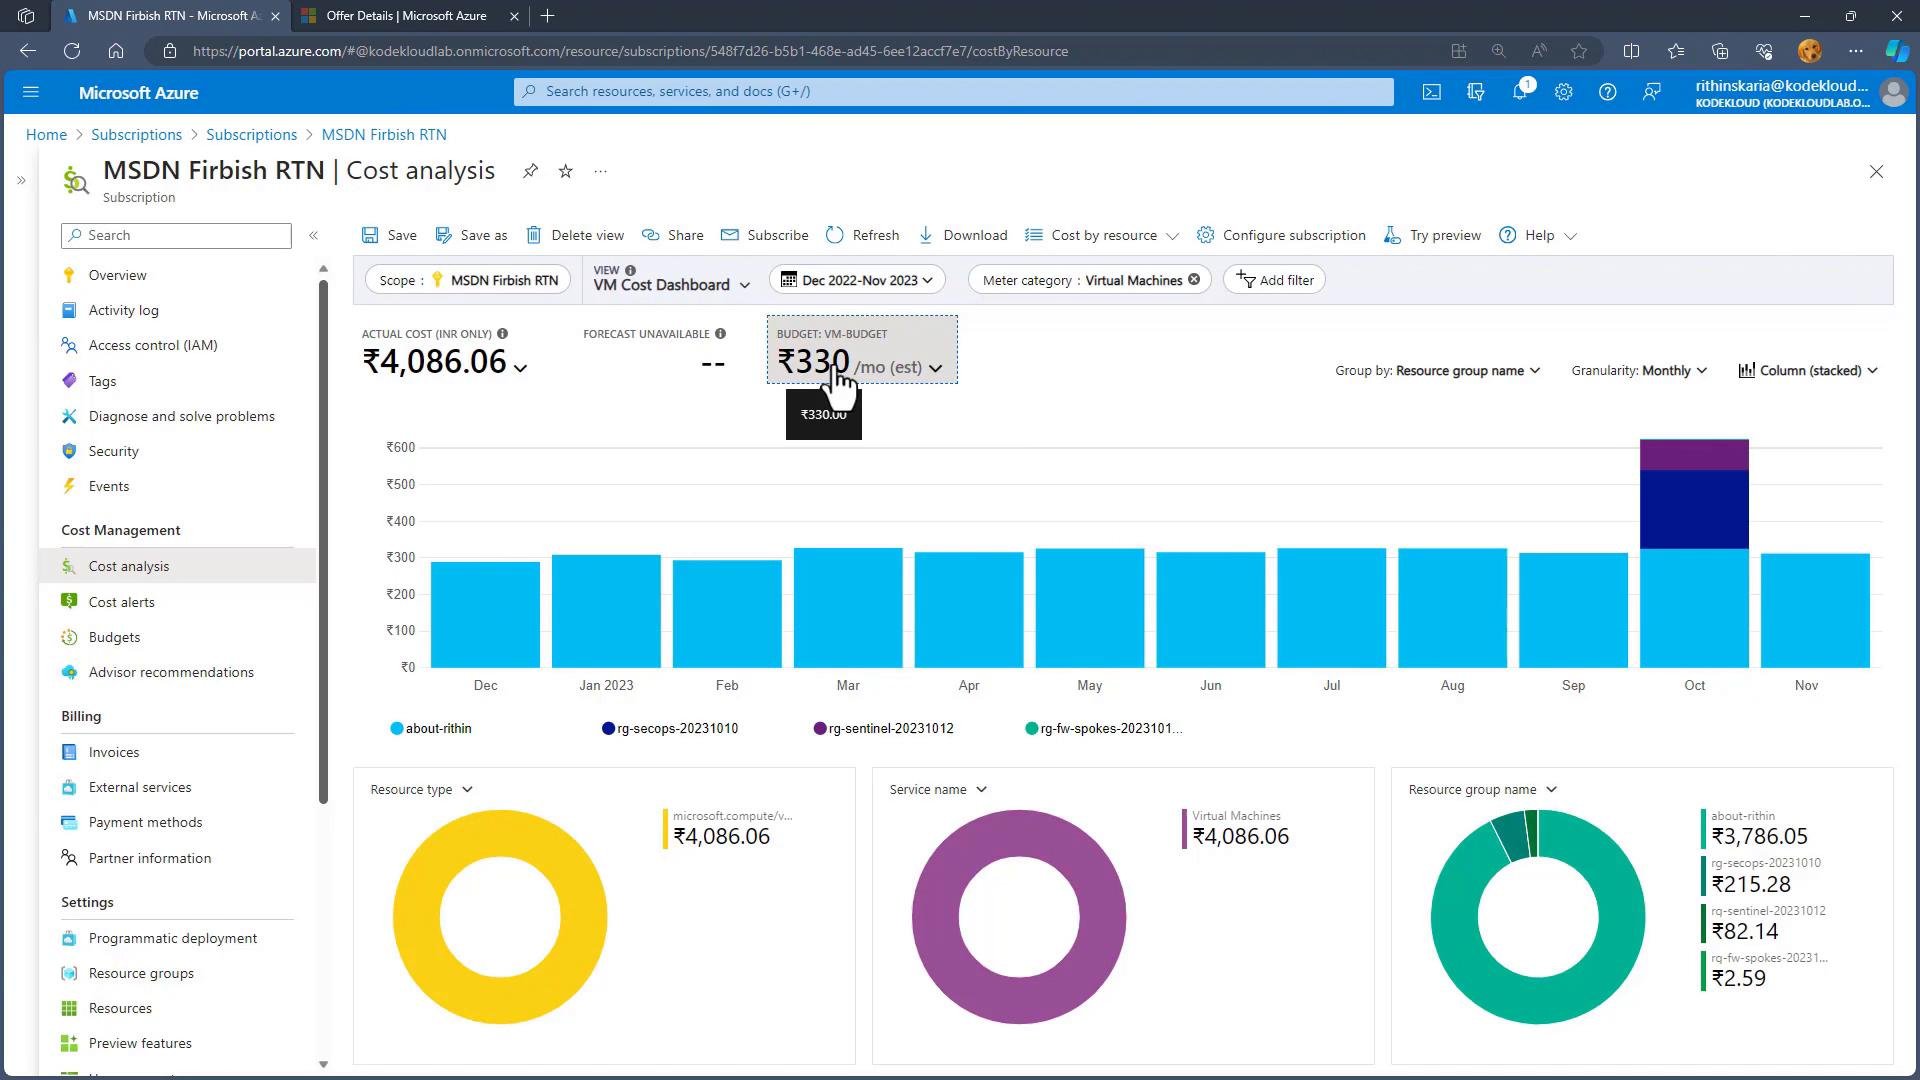
Cost Analysis is the interactive dashboard that reveals where your cloud dollars go. It slices costs by services, locations, resource groups, tags, and more, and presents charts and tables so you can quickly identify high-cost areas and trends. Open the subscription blade to see Cost Analysis in context.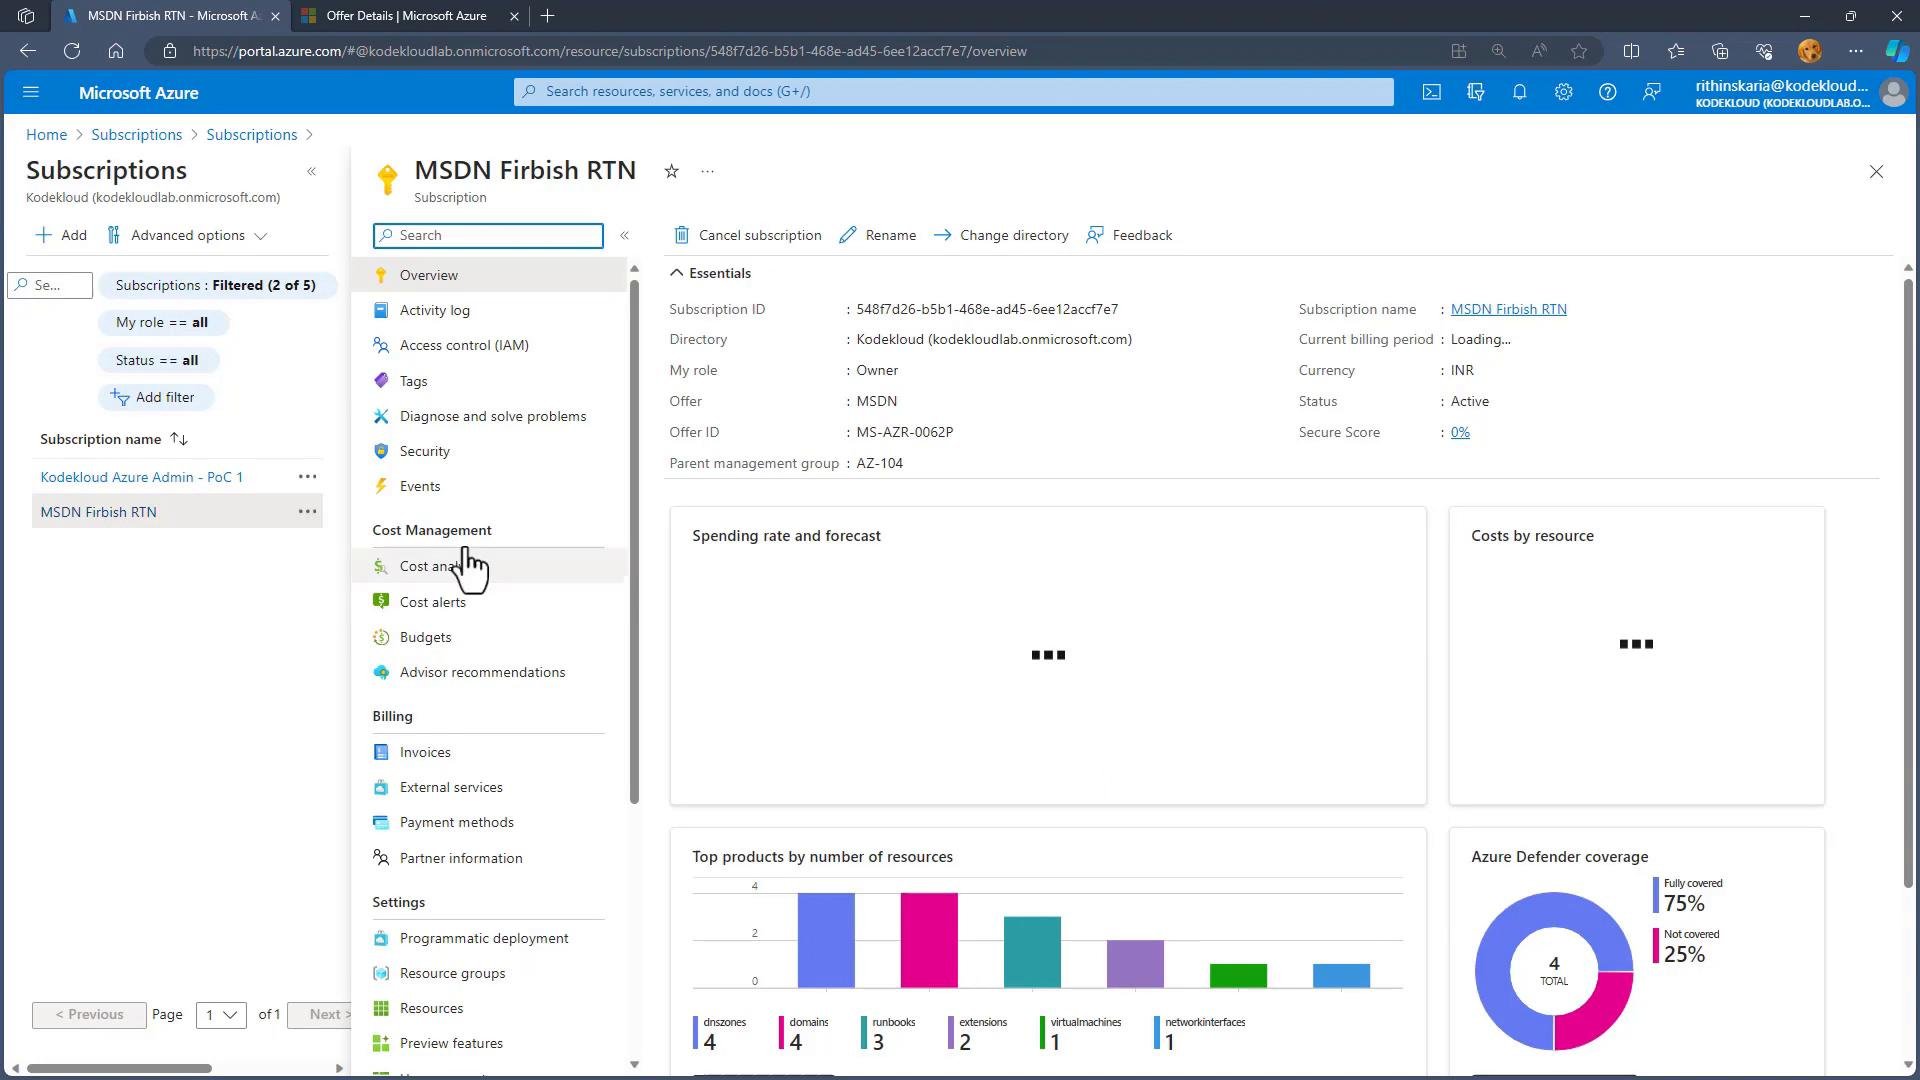
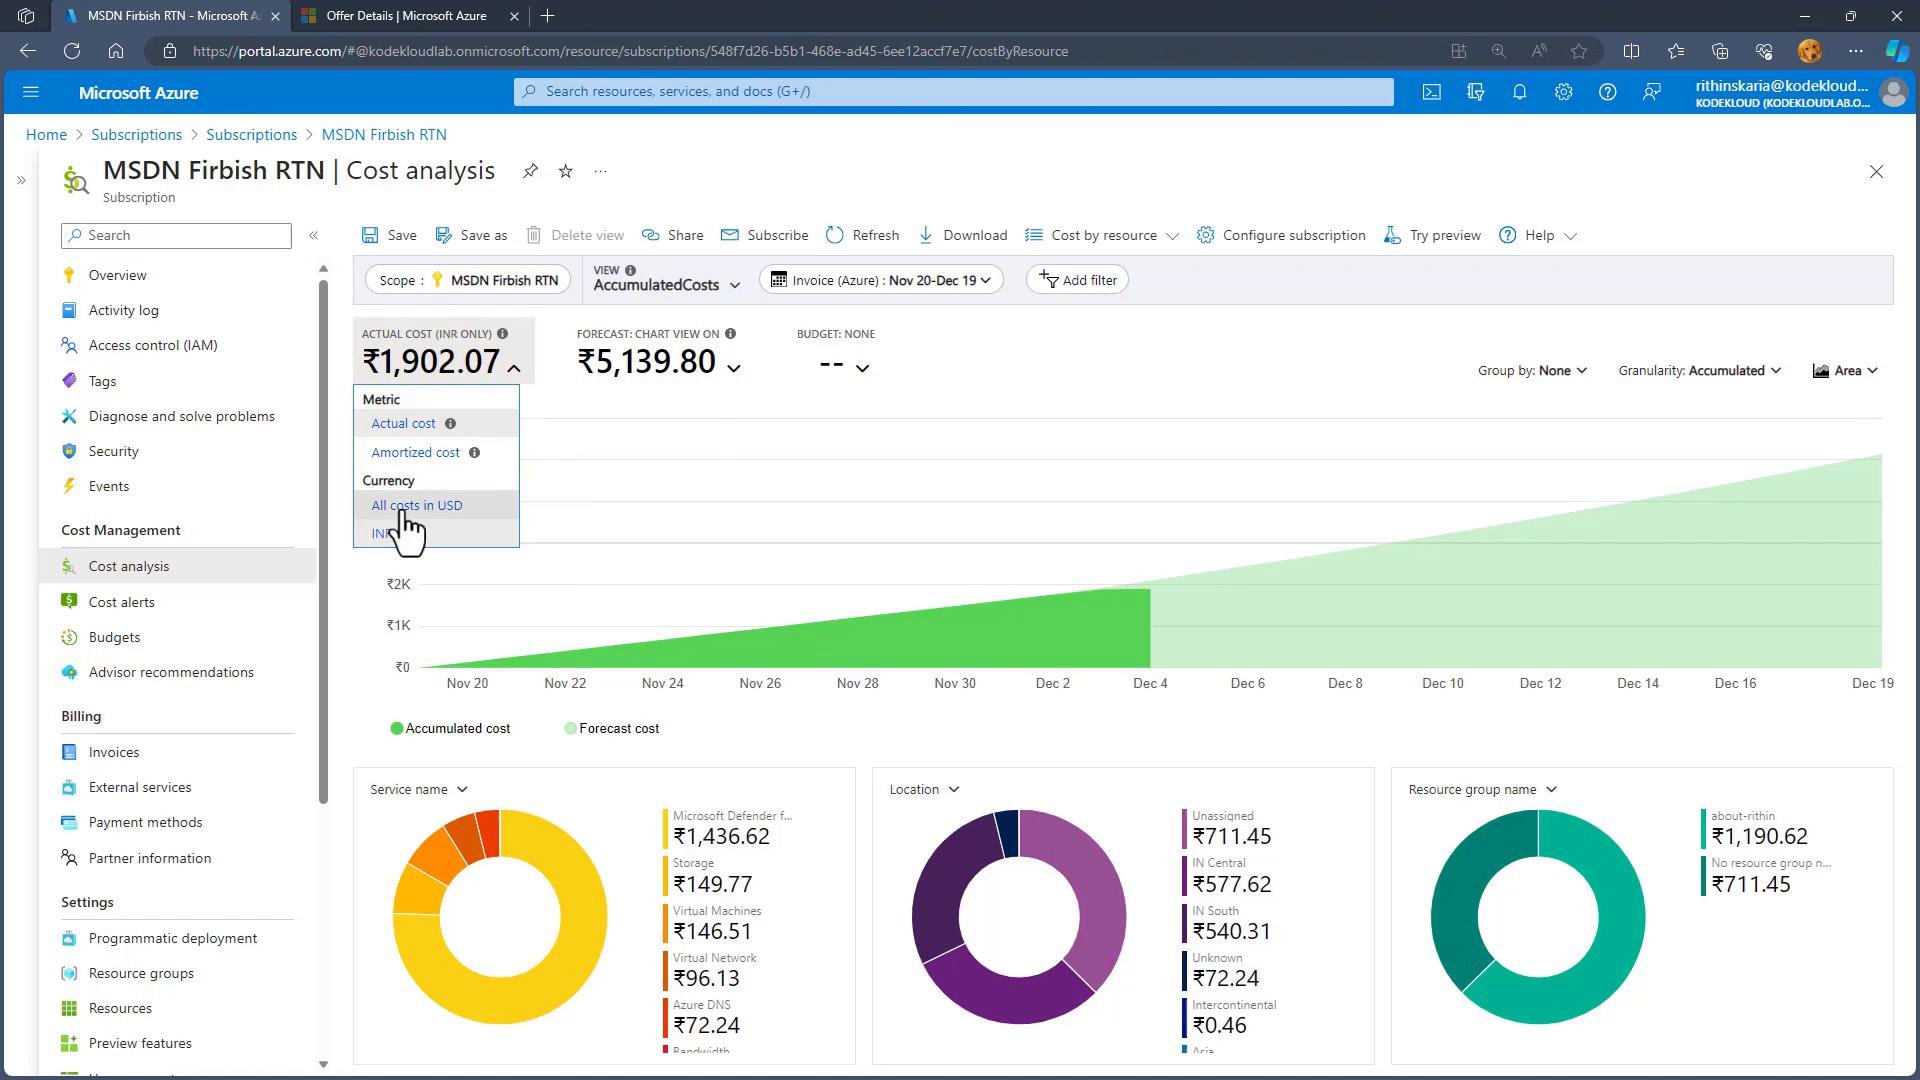
- Currency: Convert to a common currency (e.g., USD) to compare across subscriptions.
- Time range: Use built-in ranges (Last 7 days, This month, Last month, Quarter, Year) or select a custom range for historical analysis.
- Scope: Choose management groups, subscriptions, or resource groups to aggregate or isolate costs.
- Filters: Narrow by service, meter category, tags, or resource group to focus investigations.
- Grouping: Group by Resource Group, Service Name, Resource Type, Location, etc., to see allocations.
- Granularity & chart type: Toggle between accumulated vs. monthly granularity and switch chart types (area, column, stacked) for different perspectives.
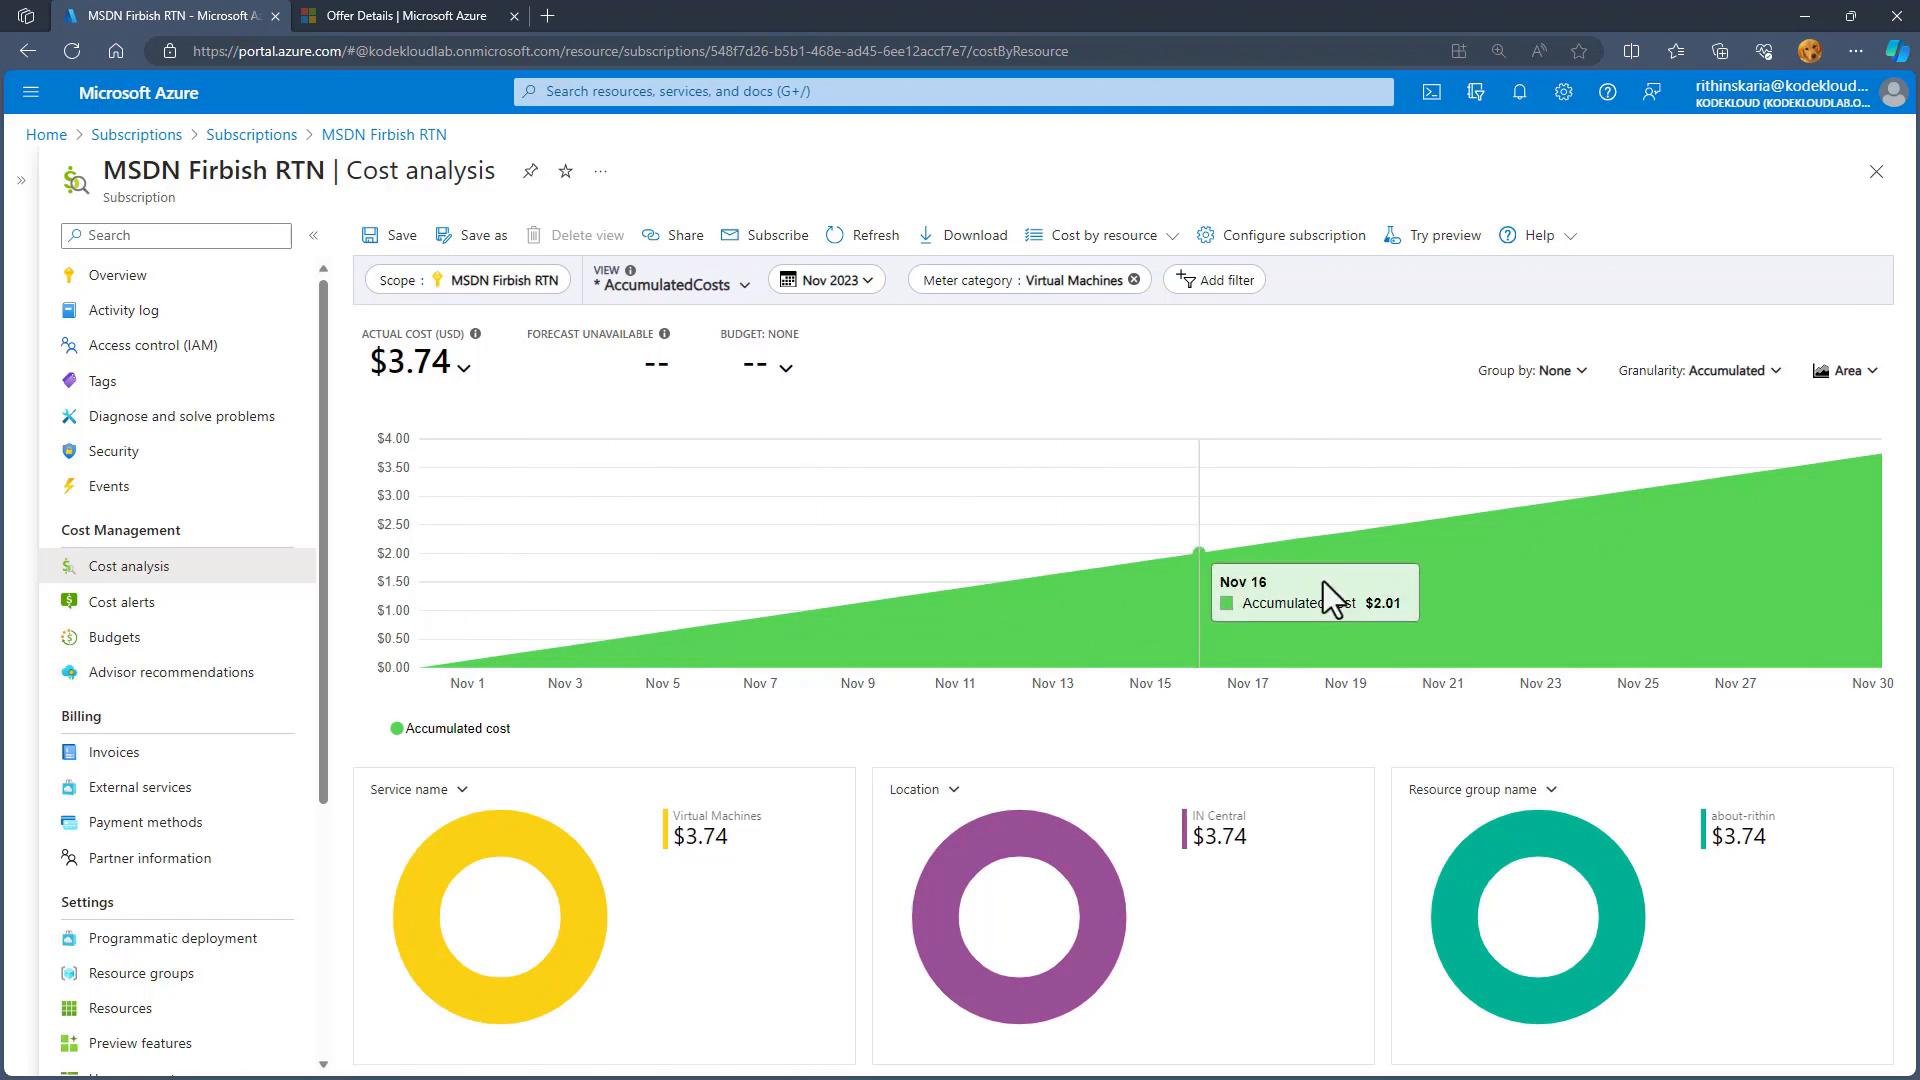
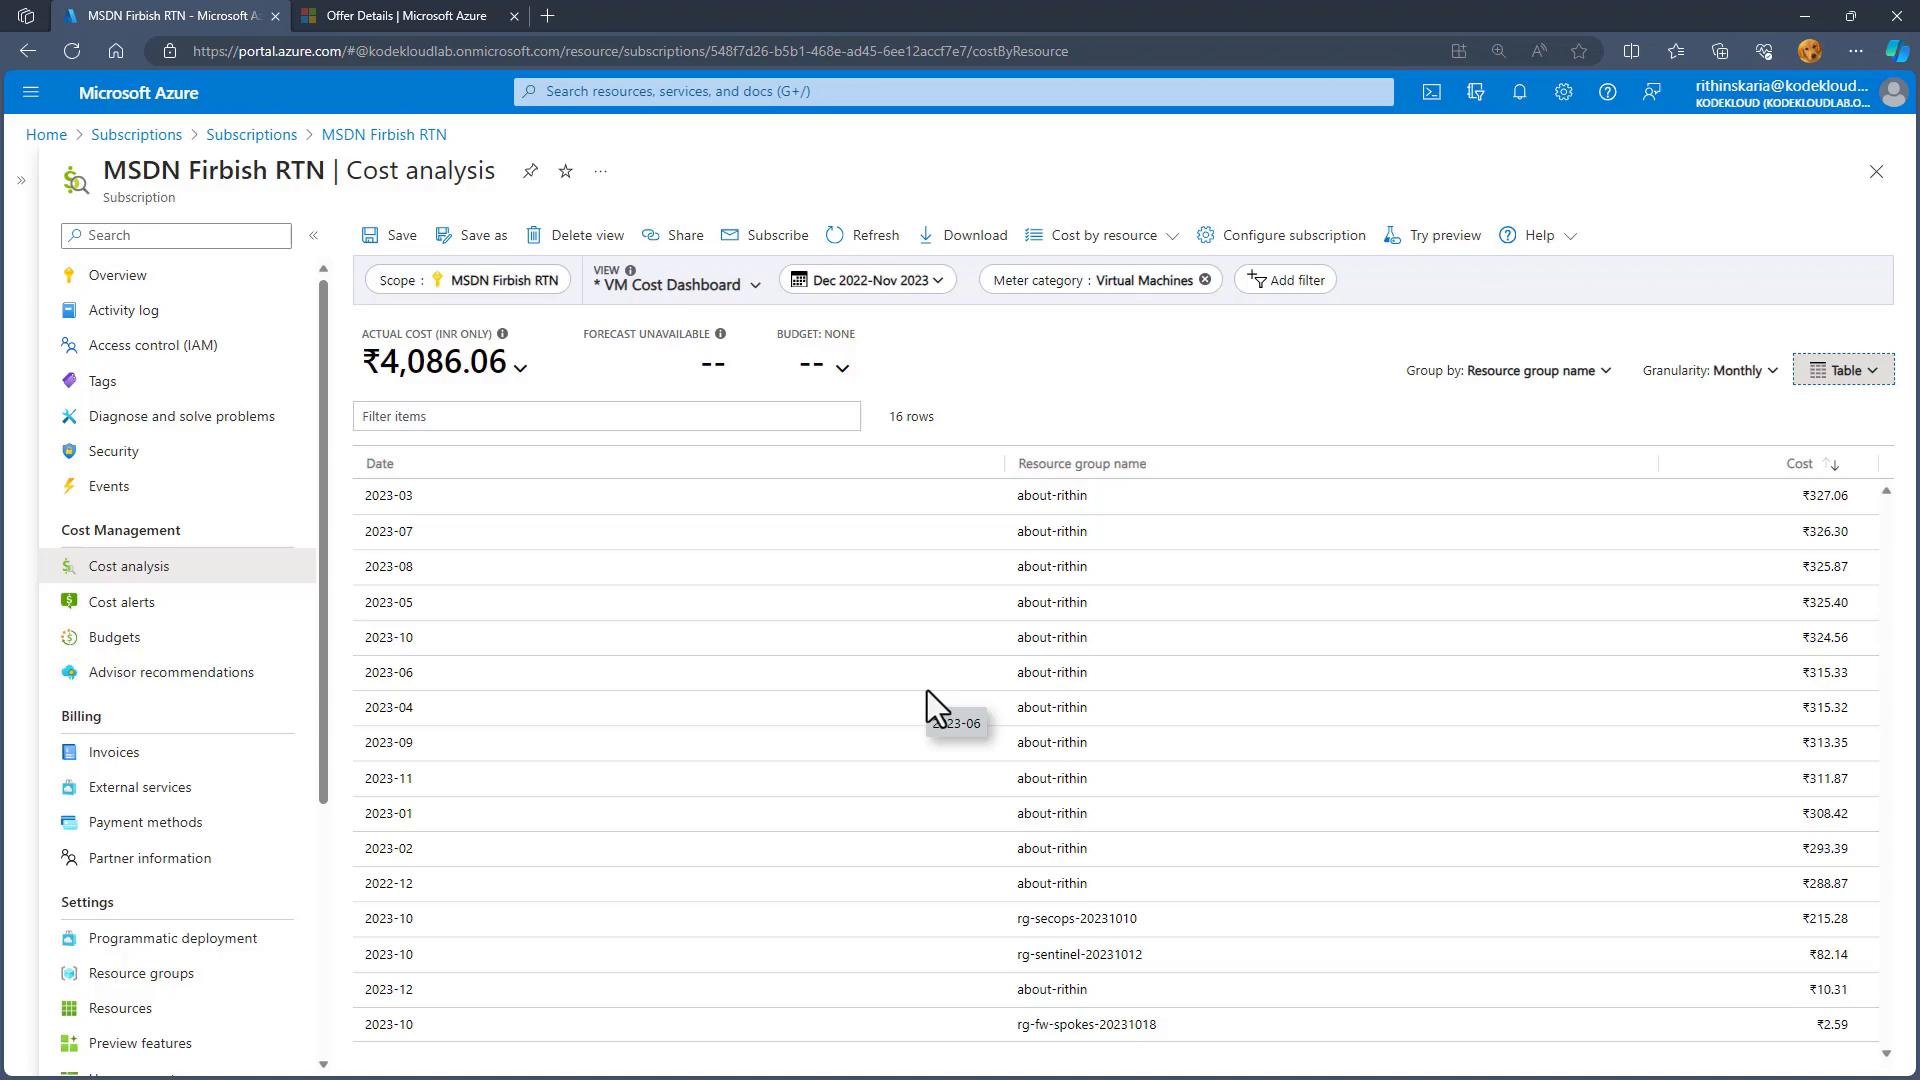
- Save configured filters and groupings as custom views (for example, “VM Cost Dashboard”). Saved views persist your settings and can be shared or exported (PNG, Excel, CSV) for reporting or collaboration.
Budgets and Alerts: prevent overspend
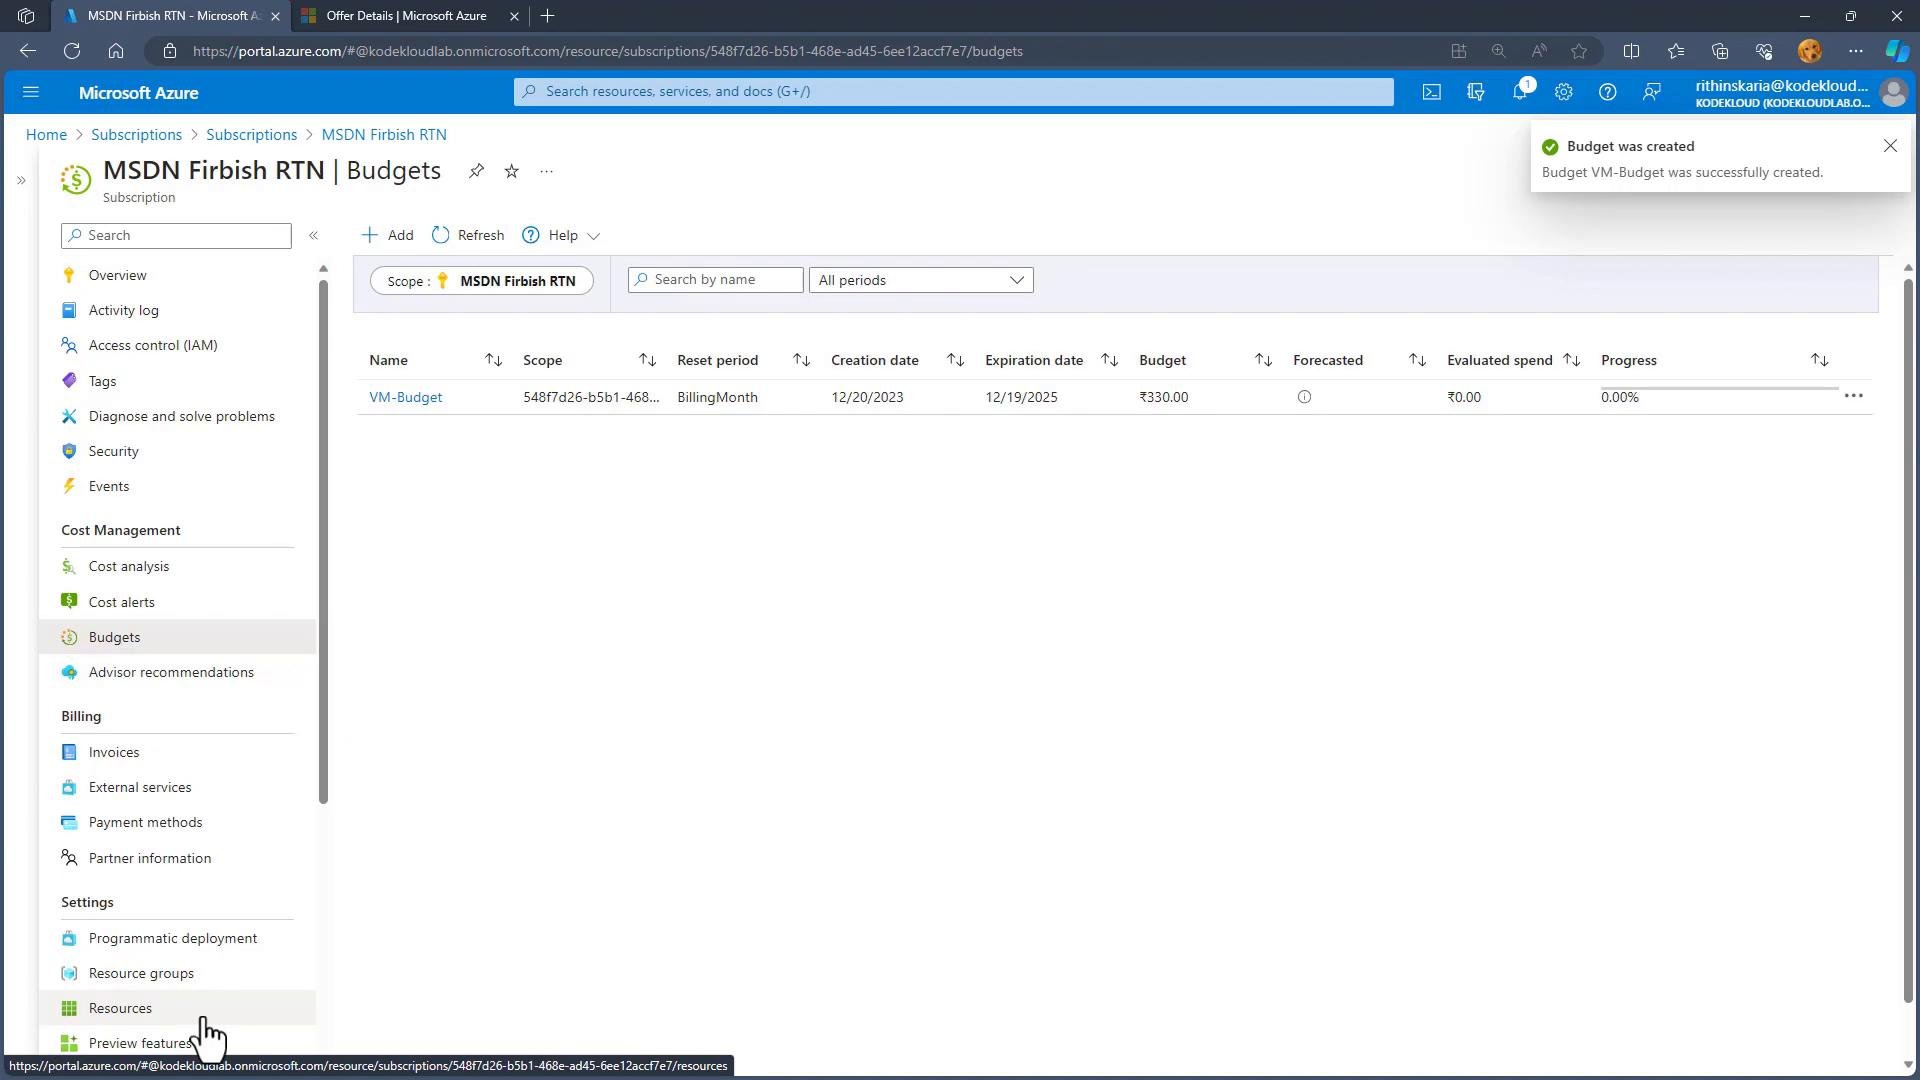
Budgets are proactive controls that let you define spending limits and notify stakeholders before you exceed them. You can scope budgets to subscriptions or resource groups and refine them with filters (e.g., only Virtual Machines). To create a budget:- Set the scope (subscription or resource group).
- Apply filters such as meter category = Virtual Machines if you want a targeted budget.
- Name the budget (use a program-friendly identifier if you’ll reference it via APIs).
- Choose the reset cadence (Monthly, Quarterly, Annually).
- Set start and end dates and the budget amount.
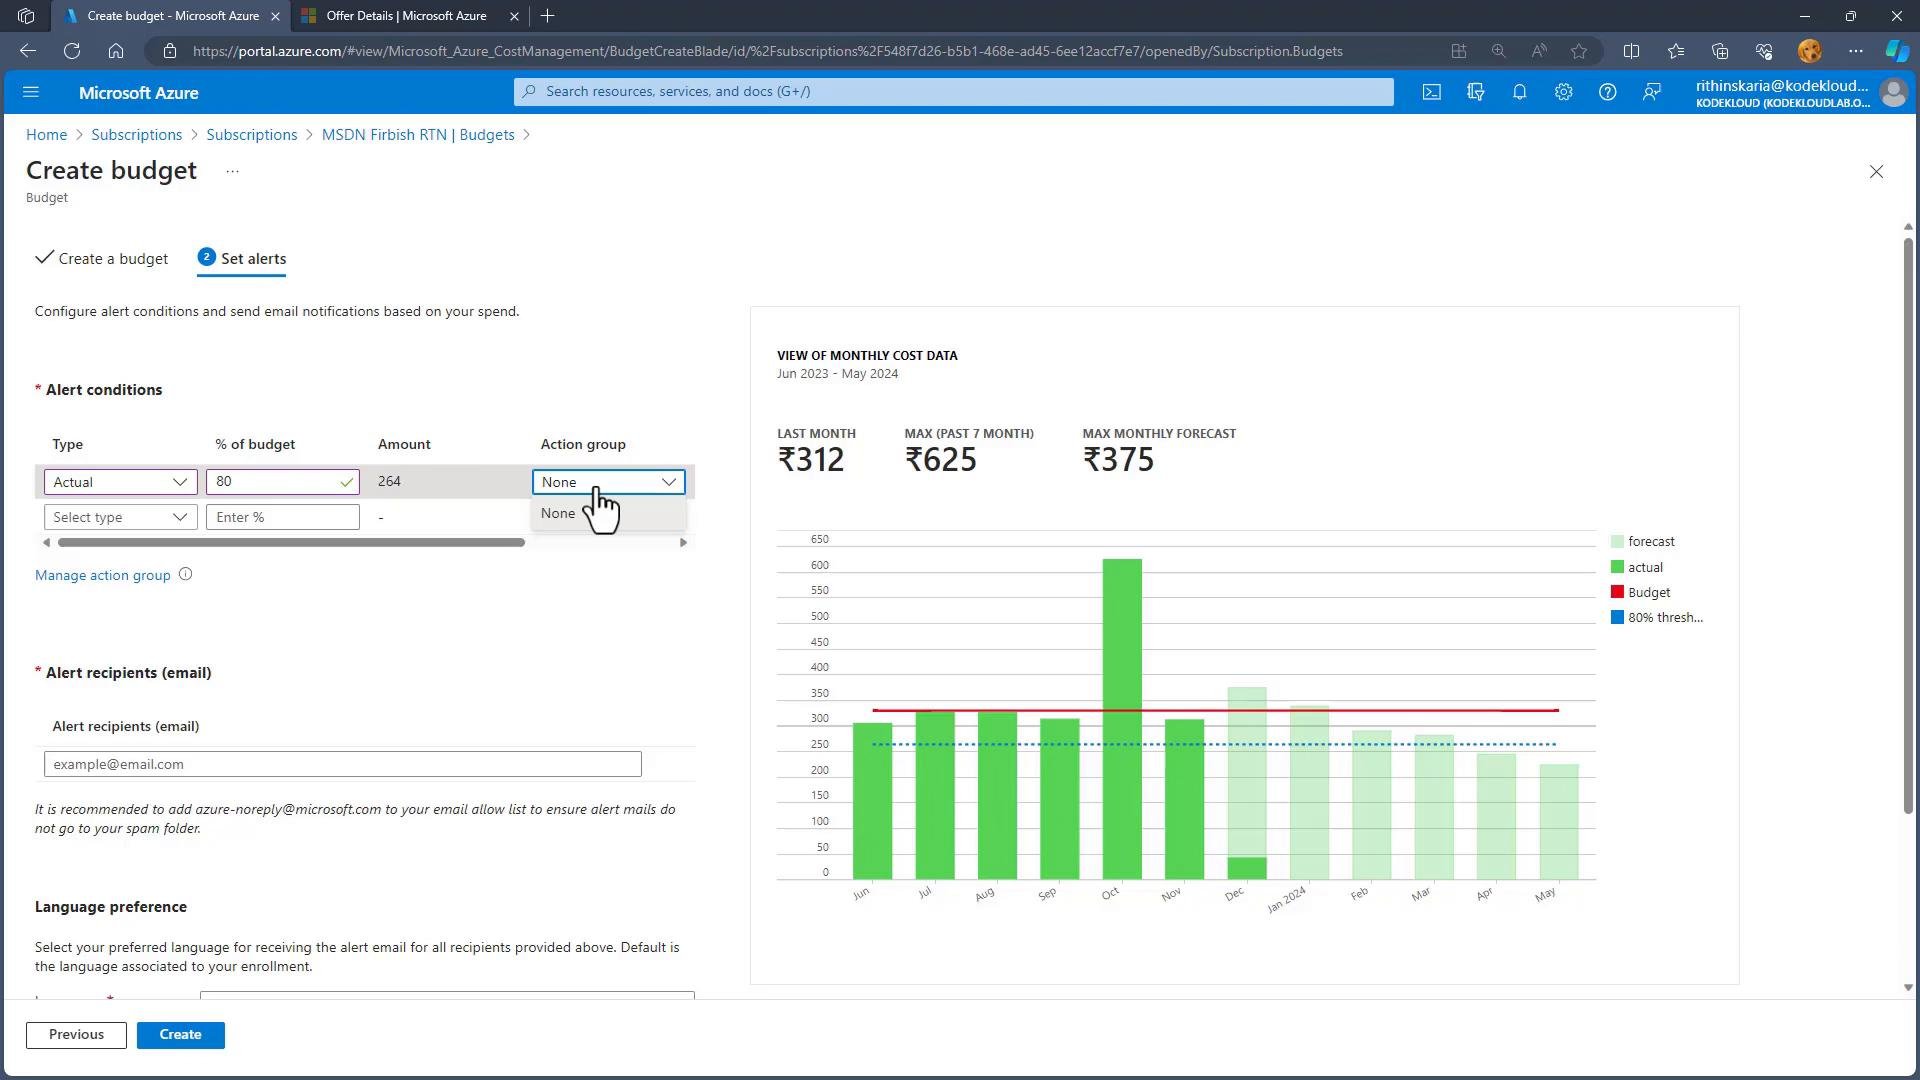
- Alerts fire when spend crosses thresholds you define (e.g., at 50%, 80%, 100% of budget). Attach an Action Group to each threshold.
- Action Groups configure notification channels (email, SMS, voice, webhook) and can trigger automation runbooks to remediate or scale resources.
- Additionally, add alert recipients to ensure key stakeholders receive direct notifications.
Action Groups are configured in Azure Monitor and can include multiple notification channels and automated actions. Use them to route budget alerts to the right teams and systems.
Advisor recommendations: actionable cost optimization
Azure Advisor analyzes your environment and suggests actions to save money or improve performance:- Detect underutilized VMs that can be deallocated, shut down or resized.
- Recommend Reservations or Savings Plans for consistent workloads.
- Suggest right-sized VM SKUs to match actual utilization.
Exports: integrate costs with BI and reporting
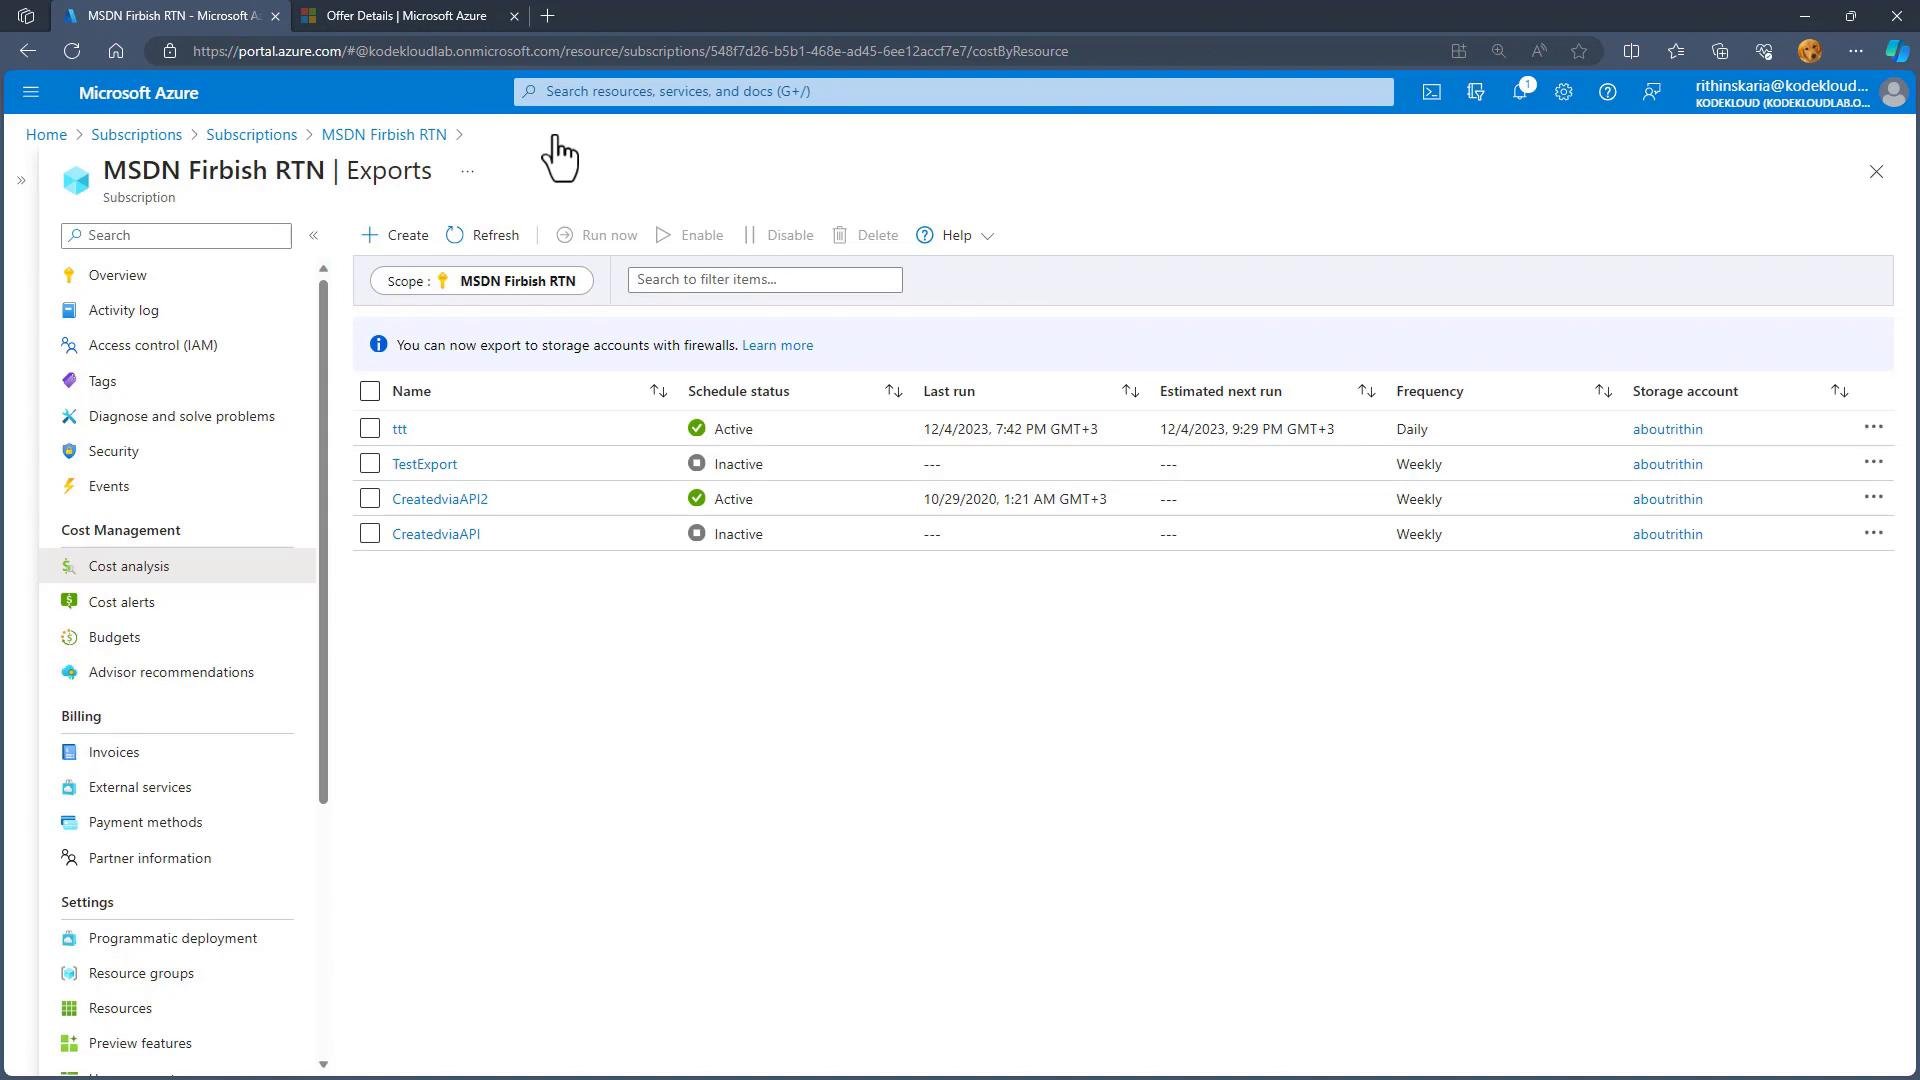
Configure export jobs to push cost data to a storage account on a schedule for downstream analysis:- One-time export — ad hoc snapshot for immediate analysis.
- Recurring exports — daily, weekly, or monthly feeds for long-term reporting.
Cost-saving strategies: choose the right levers
Every cost-optimization decision includes trade-offs. Use the right combination of tools and programs to lower costs while protecting performance and compliance.Cost optimization often involves trade-offs. Balance cost reductions with security, performance, compliance, and operational needs. For example, selecting a cheaper region might conflict with regulatory or latency requirements.
- Pay-as-you-go sets the baseline price.
- Applying a 1- or 3-year Reservation or Savings Plan reduces compute costs.
- Combining Reservations or Savings Plans with Azure Hybrid Benefit can yield larger savings if you bring eligible licenses.
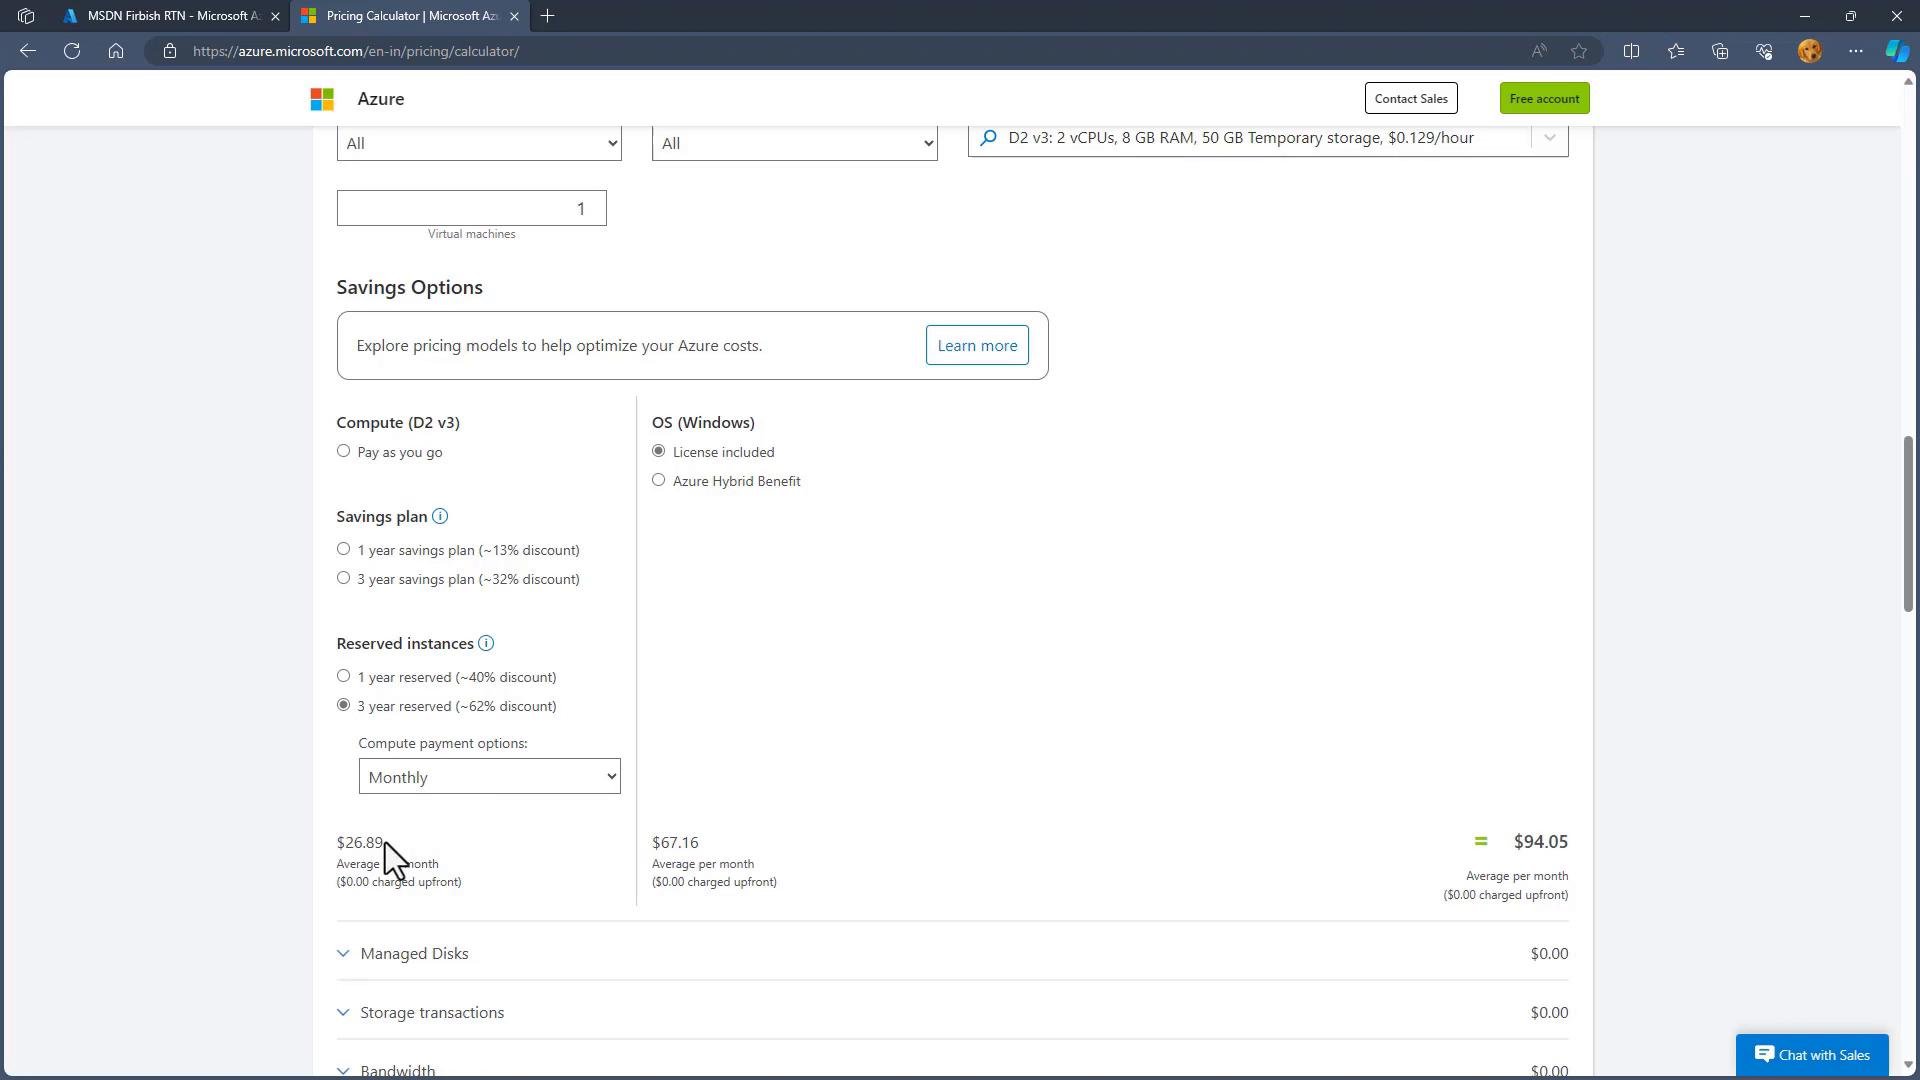
- Pay-as-you-go: $70.08 / month
- 1-year RI (pay monthly): ~$41.75 / month
- 3-year RI (upfront): ~$26.89 / month
- Add Azure Hybrid Benefit to reduce licensing portion further
Quick reference table: when to use which tool
Summary
- Use Cost Analysis to explore and visualize spending across services, resource groups, tags, and time ranges.
- Create Budgets with alerts and Action Groups to prevent surprises and notify teams automatically.
- Review Azure Advisor recommendations for targeted cost savings, but validate against performance and compliance needs.
- Export cost data to storage and ingest in Power BI or financial systems for reporting and automation.
- Apply Reserved Instances, Savings Plans, Azure Hybrid Benefit, dev/test subscriptions, and informed region selection to reduce cost — always weighing trade-offs.
Links and references
- Azure Cost Management Documentation
- Azure Monitor and Action Groups
- Azure Pricing Calculator
- Power BI