

What Log Analytics provides
- Data collection: Ingest logs and metrics from cloud resources, on‑premises systems, and other clouds into a Log Analytics workspace.
- Querying and visualization: Use KQL to query data and create dashboards, alerts, and visualizations.
- Data isolation and residency: Create workspaces in specific regions to meet compliance and data-residency needs.
- Integration with Azure services: Services such as Application Insights and Microsoft Sentinel store telemetry in a Log Analytics workspace. Note that using those services can increase workspace ingestion and retention charges in addition to the service costs.
Workspaces and architecture
- A Log Analytics workspace is an Azure resource that aggregates telemetry, enables analysis, and powers visualization.
- You can create multiple workspaces. Common patterns:
- Centralized workspace: Consolidate telemetry across environments or teams for unified monitoring and simpler query/alerting.
- Per-project or per-team workspace: Provide isolation and separate billing for sensitive or compliance-bound workloads.
- For strict data-residency requirements (for example, production vs DR), deploy separate workspaces in each region to ensure data remains in the appropriate geographic location.
Pricing basics
Additional retention notes:
- The Azure Activity Log is retained by the platform for 90 days by default.
- Log Analytics workspaces commonly include a default retention (often 30 days). To retain logs longer (for example, 180 days) you must send logs to a workspace via a diagnostic setting and set the workspace retention accordingly; this will incur additional charges.
Sample KQL query
The following KQL example filters performance data for machines with “SQL” in their Computer name, selects LogicalDisk counters for the C: drive where the counter is ”% Free Space”, converts TimeGenerated to Eastern Standard Time by subtracting 5 hours, and projects relevant fields:Onboarding resources
Resources can be onboarded to a workspace in several ways:- Agents:
- Azure Monitor Agent (AMA) — the modern unified agent for logs and metrics; preferred for new deployments.
- Log Analytics agent / Microsoft Monitoring Agent (MMA) — legacy agent that is being superseded by AMA; use only when AMA is not supported.
- Diagnostic settings: Configure at resource, resource-group, or subscription level to send resource logs and metrics to a workspace.
- Azure Arc: Onboard non‑Azure or hybrid resources (machines, Kubernetes clusters) and send telemetry to a workspace.
Agent recommendation: Prefer the Azure Monitor Agent (AMA) for new deployments because it provides improved performance, flexible data collection, and unified management. Use the legacy Log Analytics agent (MMA) only where AMA is not supported.
Creating a Log Analytics workspace in the Azure portal
To create a workspace you need:- Subscription
- Resource group
- Workspace name
- Region (data residency)
- Optionally: pricing tier and retention settings
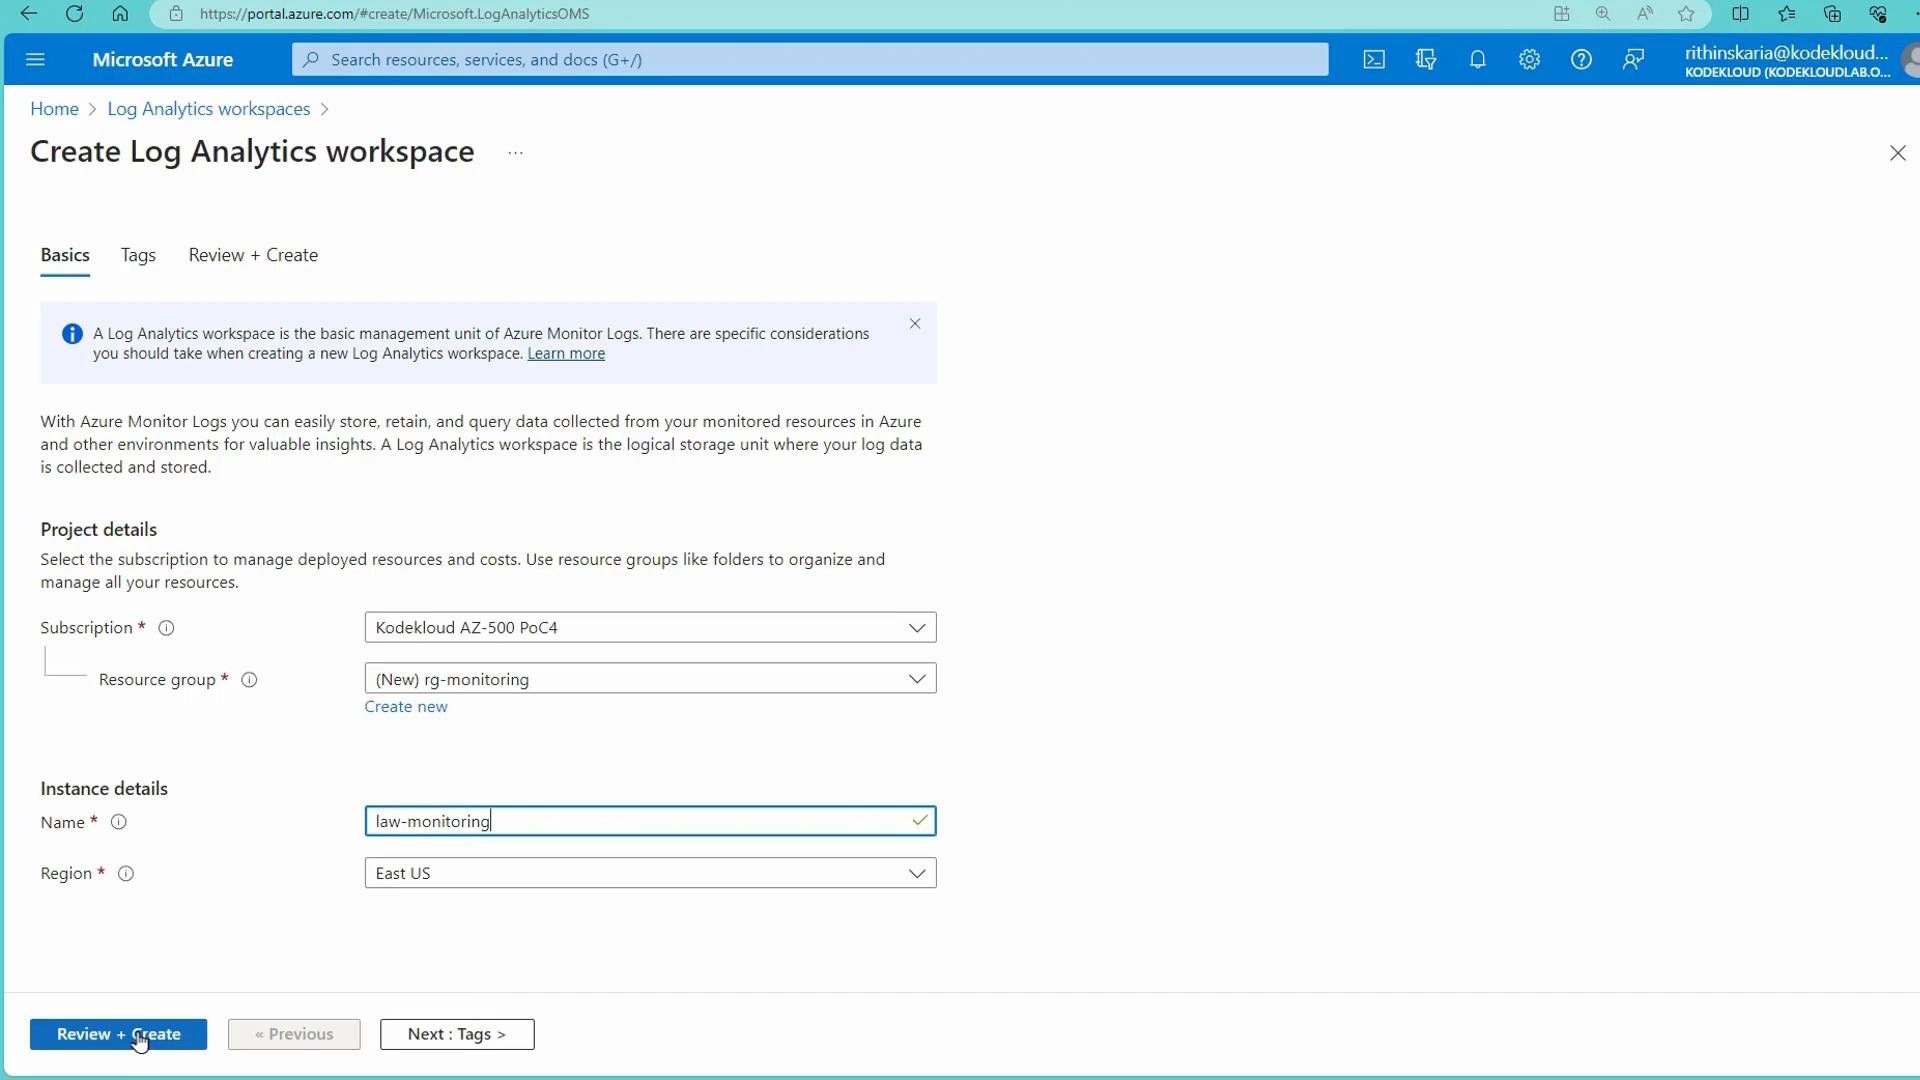
- In the Azure portal, search for “Log Analytics workspaces” and click Create.
- Select the subscription, create or choose a resource group (for example
RG-monitoring), and provide a workspace name (for examplelawmonitoring). - Choose the region where data should reside.
- Review and optionally adjust pricing tier and retention, then click Review + create and Finish.
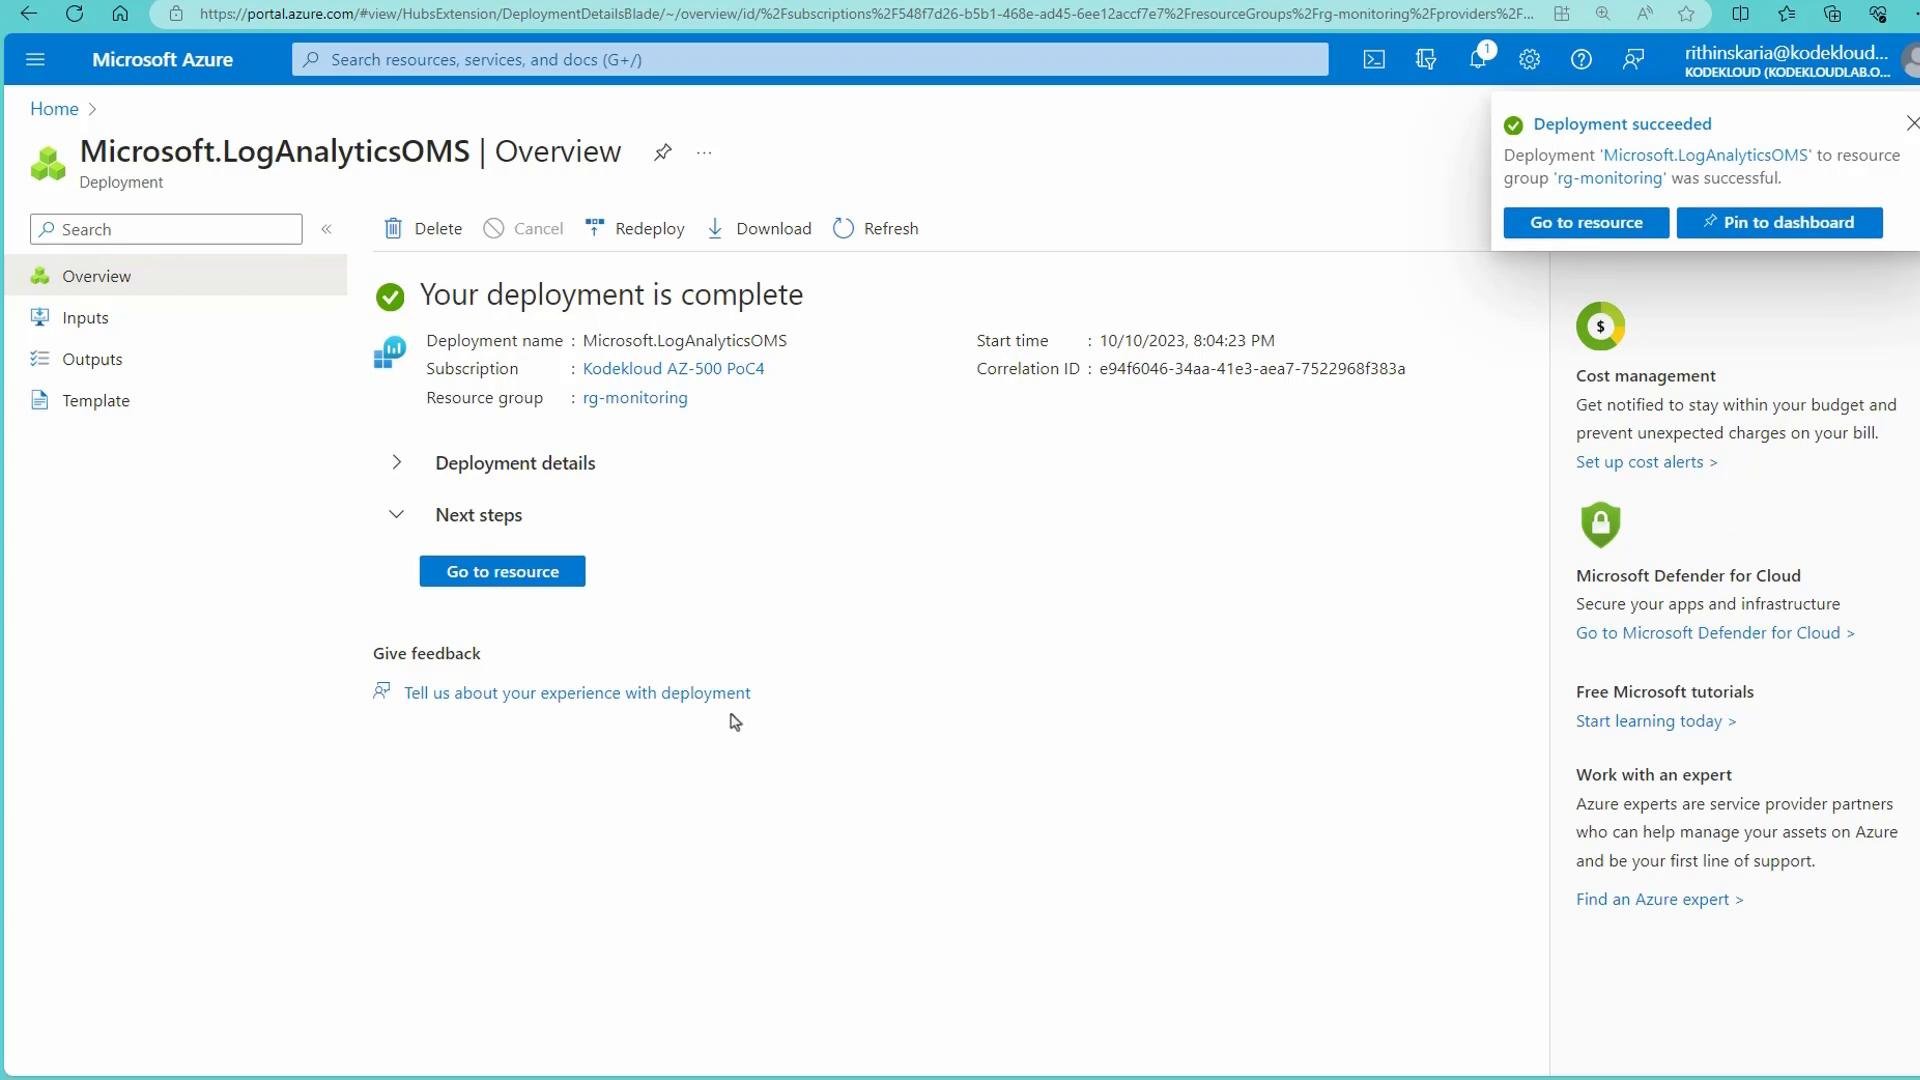
After you create the workspace
- Configure connected sources: add VMs, configure diagnostic settings for platform and resource logs, and enable Azure services to forward telemetry.
- Install agents: deploy AMA/MMA to VMs or use Azure Policy to automate agent installation.
- Start exploring Logs (KQL): build queries, set alerts, and pin visualizations to dashboards.
Remember: Sending data to a Log Analytics workspace and retaining it beyond included retention will incur costs. Monitor ingestion and retention settings and consider data filtering, sampling, or export strategies to control spend.
Useful links and references
- Azure Log Analytics overview: https://learn.microsoft.com/azure/azure-monitor/logs/
- Azure Monitor agents comparison: https://learn.microsoft.com/azure/azure-monitor/agents/agents-overview
- Diagnostic settings for Azure resources: https://learn.microsoft.com/azure/azure-monitor/essentials/diagnostic-settings
- Kusto Query Language (KQL) documentation: https://learn.microsoft.com/azure/data-explorer/kusto/query