

Architecture — data flow and components
Monitoring begins at the data sources and flows through collection and transformation into Azure Monitor’s central data platform. From there, insights and response features consume the data.- Data sources: applications, infrastructure, Azure services, subscription/tenant events, and custom telemetry.
- Collection & routing: Agents, SDKs, data collection rules, diagnostic settings, and APIs collect and shape telemetry.
- Data platform: Stores and processes metrics, logs, traces, and change records.
- Consumption & integrations: Visualizations, insights, alerts, autoscale, AIOps, and integrations with SCOM, Event Hubs, Storage, Logic Apps, Functions, DevOps pipelines, and third‑party tools.
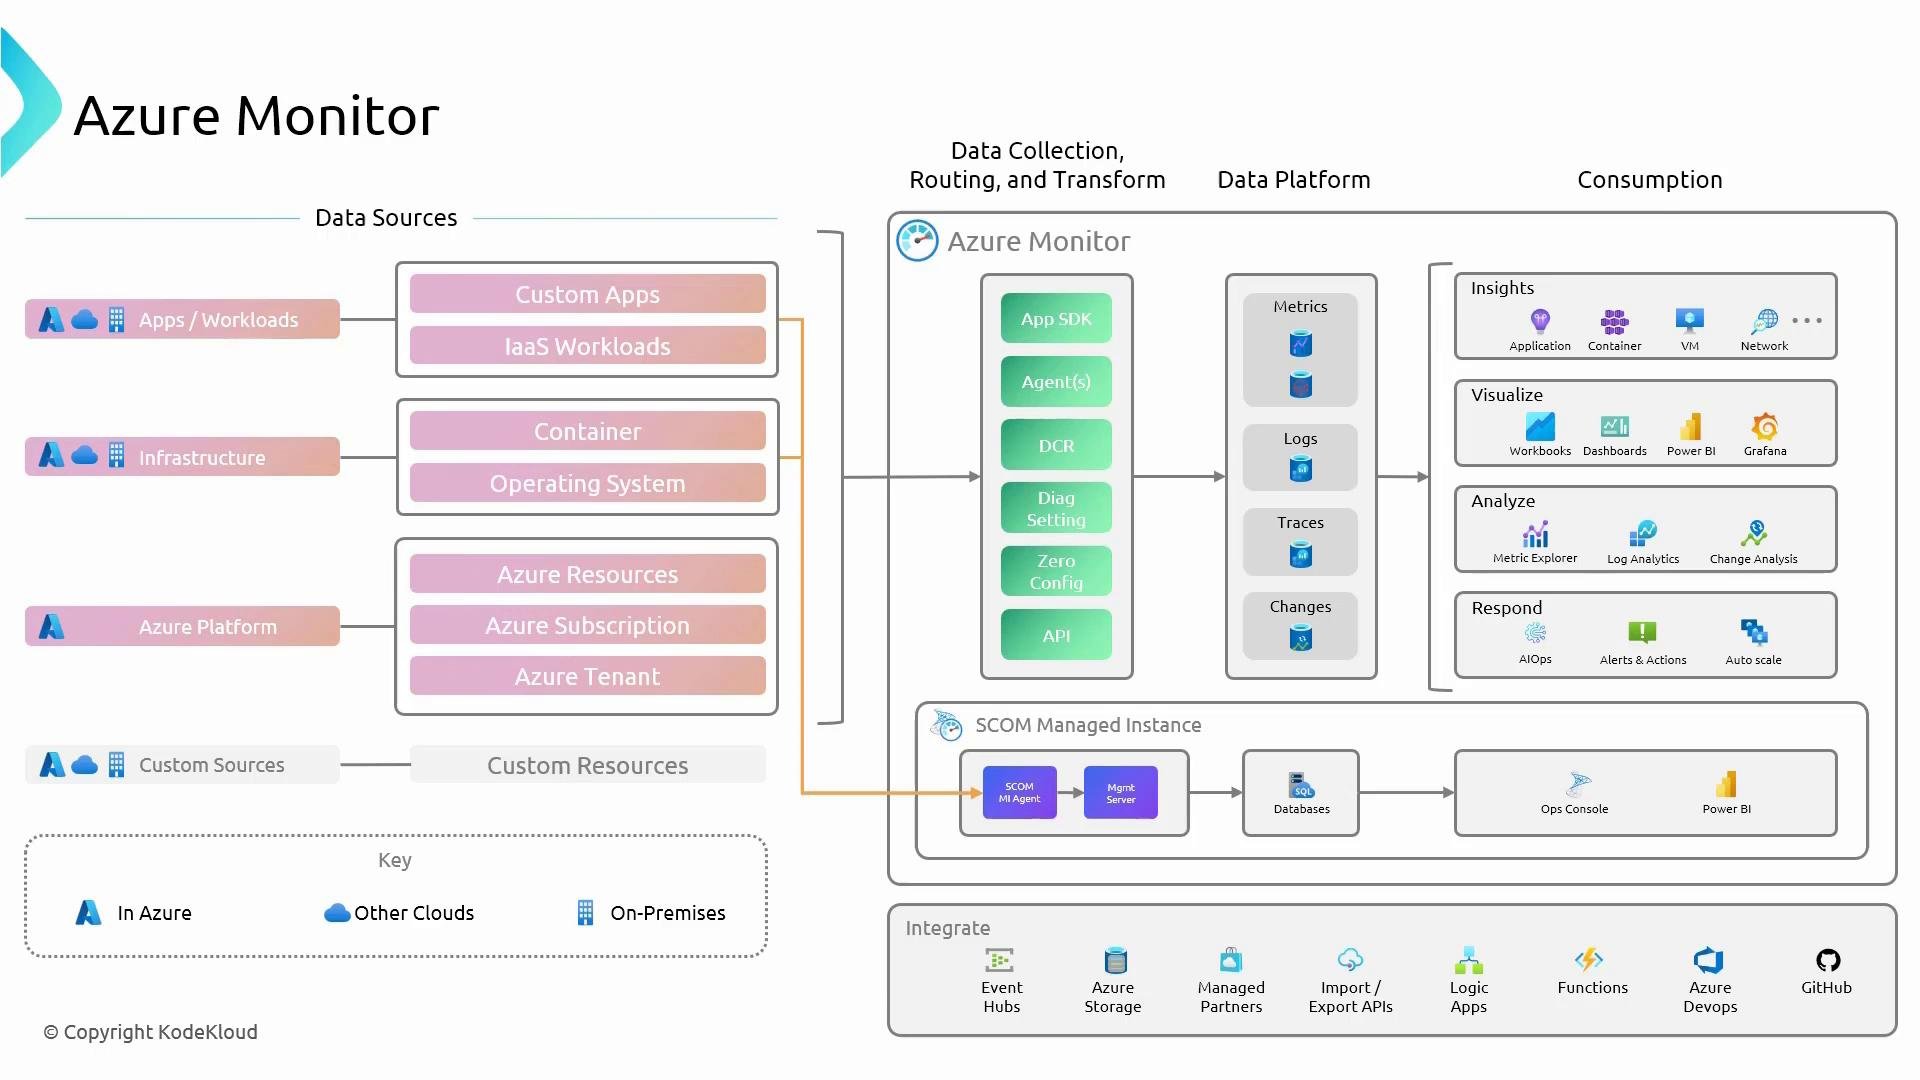
This article concentrates on metrics and logs — the primary Azure Monitor data types that you need to master for monitoring, troubleshooting, and exam scenarios.
Key components (quick reference)
- Metrics: Time‑series numeric data for near real‑time monitoring (used for dashboards, alerts, autoscale).
- Logs: Structured, timestamped records for deep diagnostics, auditing, and complex queries.
- Agents & SDKs: Azure Monitor Agent (AMA), diagnostic extensions, and Application Insights SDKs.
- Data platform: Central storage and processing (Log Analytics, Metrics store).
- Analysis & response: Kusto Query Language (KQL), Metrics Explorer, workbooks, alerts, dashboards.
Metrics
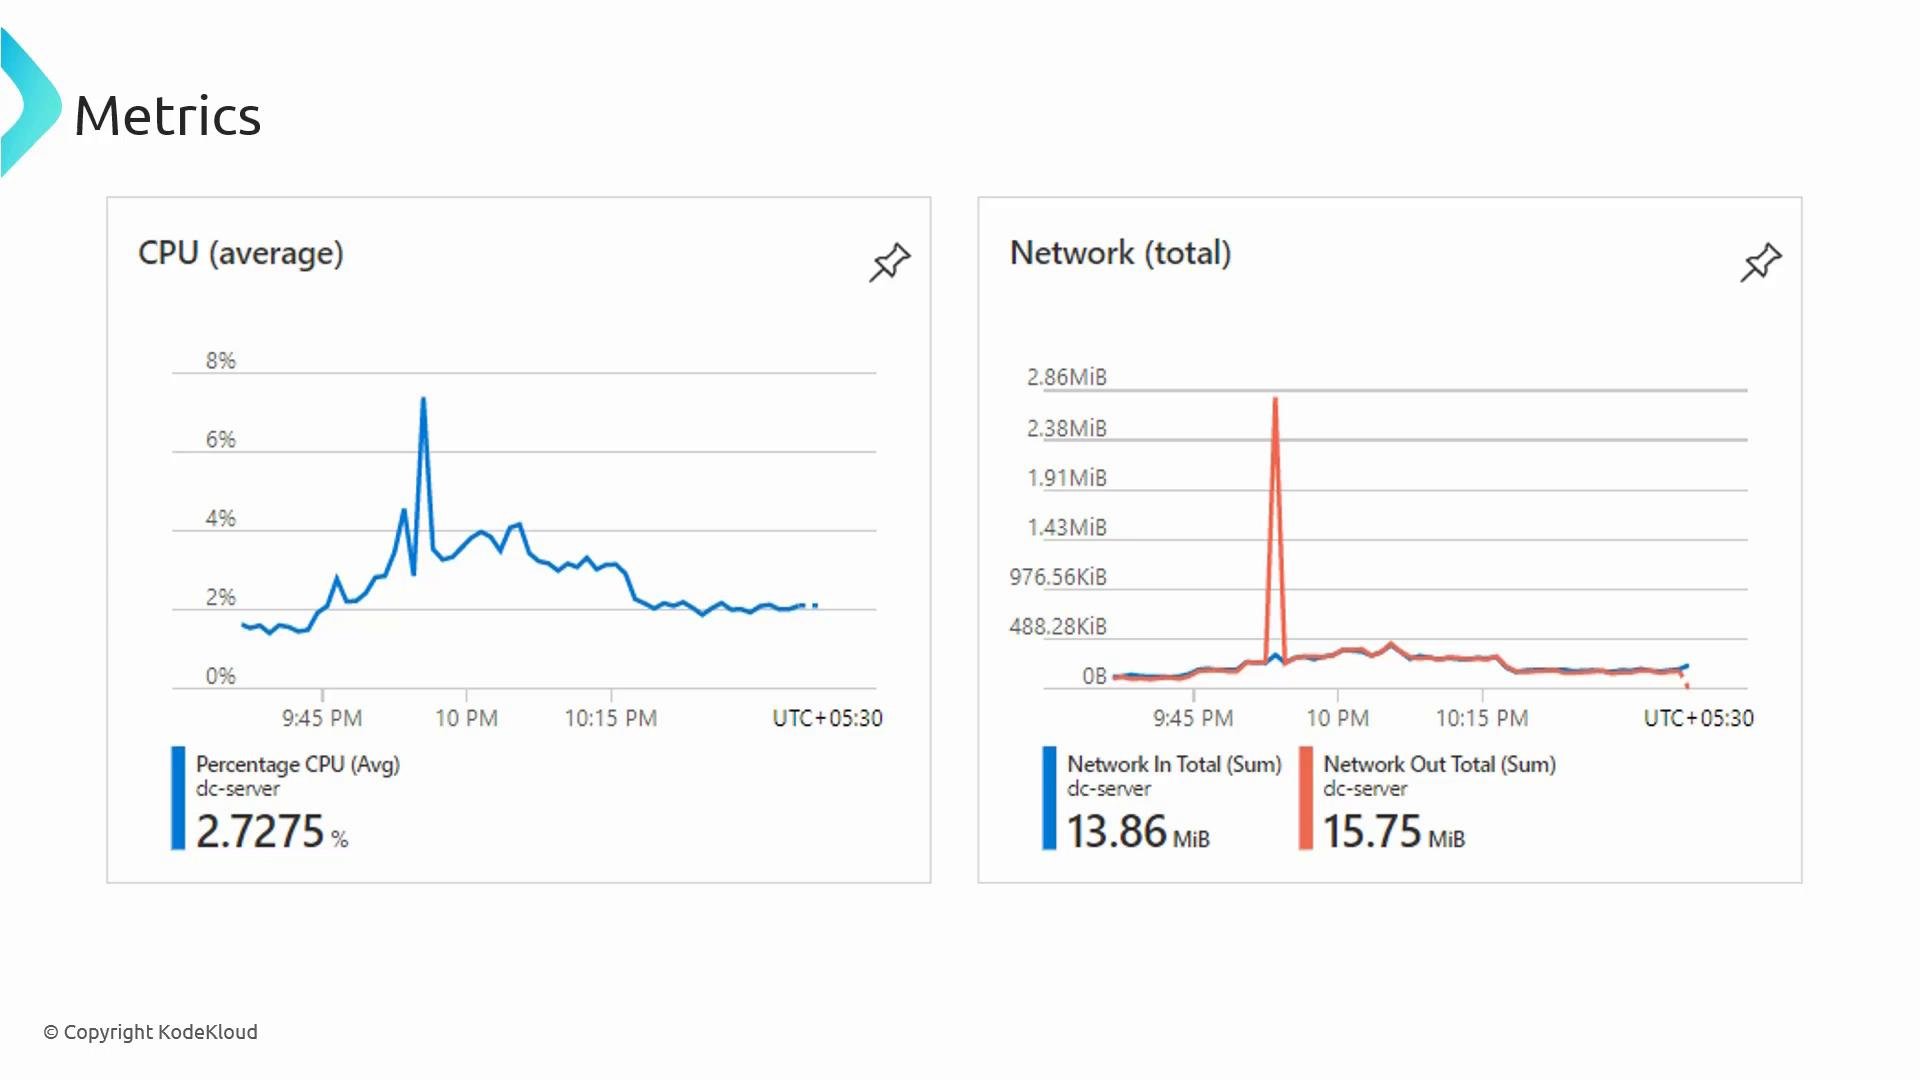
Metrics are numerical values sampled at regular intervals that describe the performance or state of a resource. They provide near real‑time visibility and are commonly used for dashboards, alerting, and autoscaling.- Platform metrics: Many Azure resources expose platform metrics by default (for example, VM CPU percentage or web app request latency).
- Visualization: Metrics are typically visualized as time series to identify trends, spikes, and correlations across resources.
- Use cases: Alerts, autoscale rules, short‑term trend analysis, and operational dashboards.
Logs
Logs are structured records that capture events, traces, and diagnostic details. They enable root‑cause analysis, forensic investigations, and complex queries that metrics cannot support.- Collection: Enable diagnostic settings on resources, install the Azure Monitor Agent (AMA) on VMs, or instrument applications with Application Insights SDKs.
- Storage & query: Logs are stored in Log Analytics and queried using Kusto Query Language (KQL).
- Use cases: Troubleshooting, detailed audits, cross‑table queries, joins, and historical analysis.
- Filters the
VMProcesstable for hosts with “SQL” in theComputername andsvchostas the executable. - Adds a
TimeInESTcolumn by applying a fixed offset toTimeGenerated(note: this example uses a simple offset; use timezone-aware functions for production). - Projects (selects) the columns
TimeInEST,Computer,ExecutableName,Group, andFileVersionfor output.
Metrics vs Logs (comparison)
Data sources relevant to Azure Monitor (exam focus)
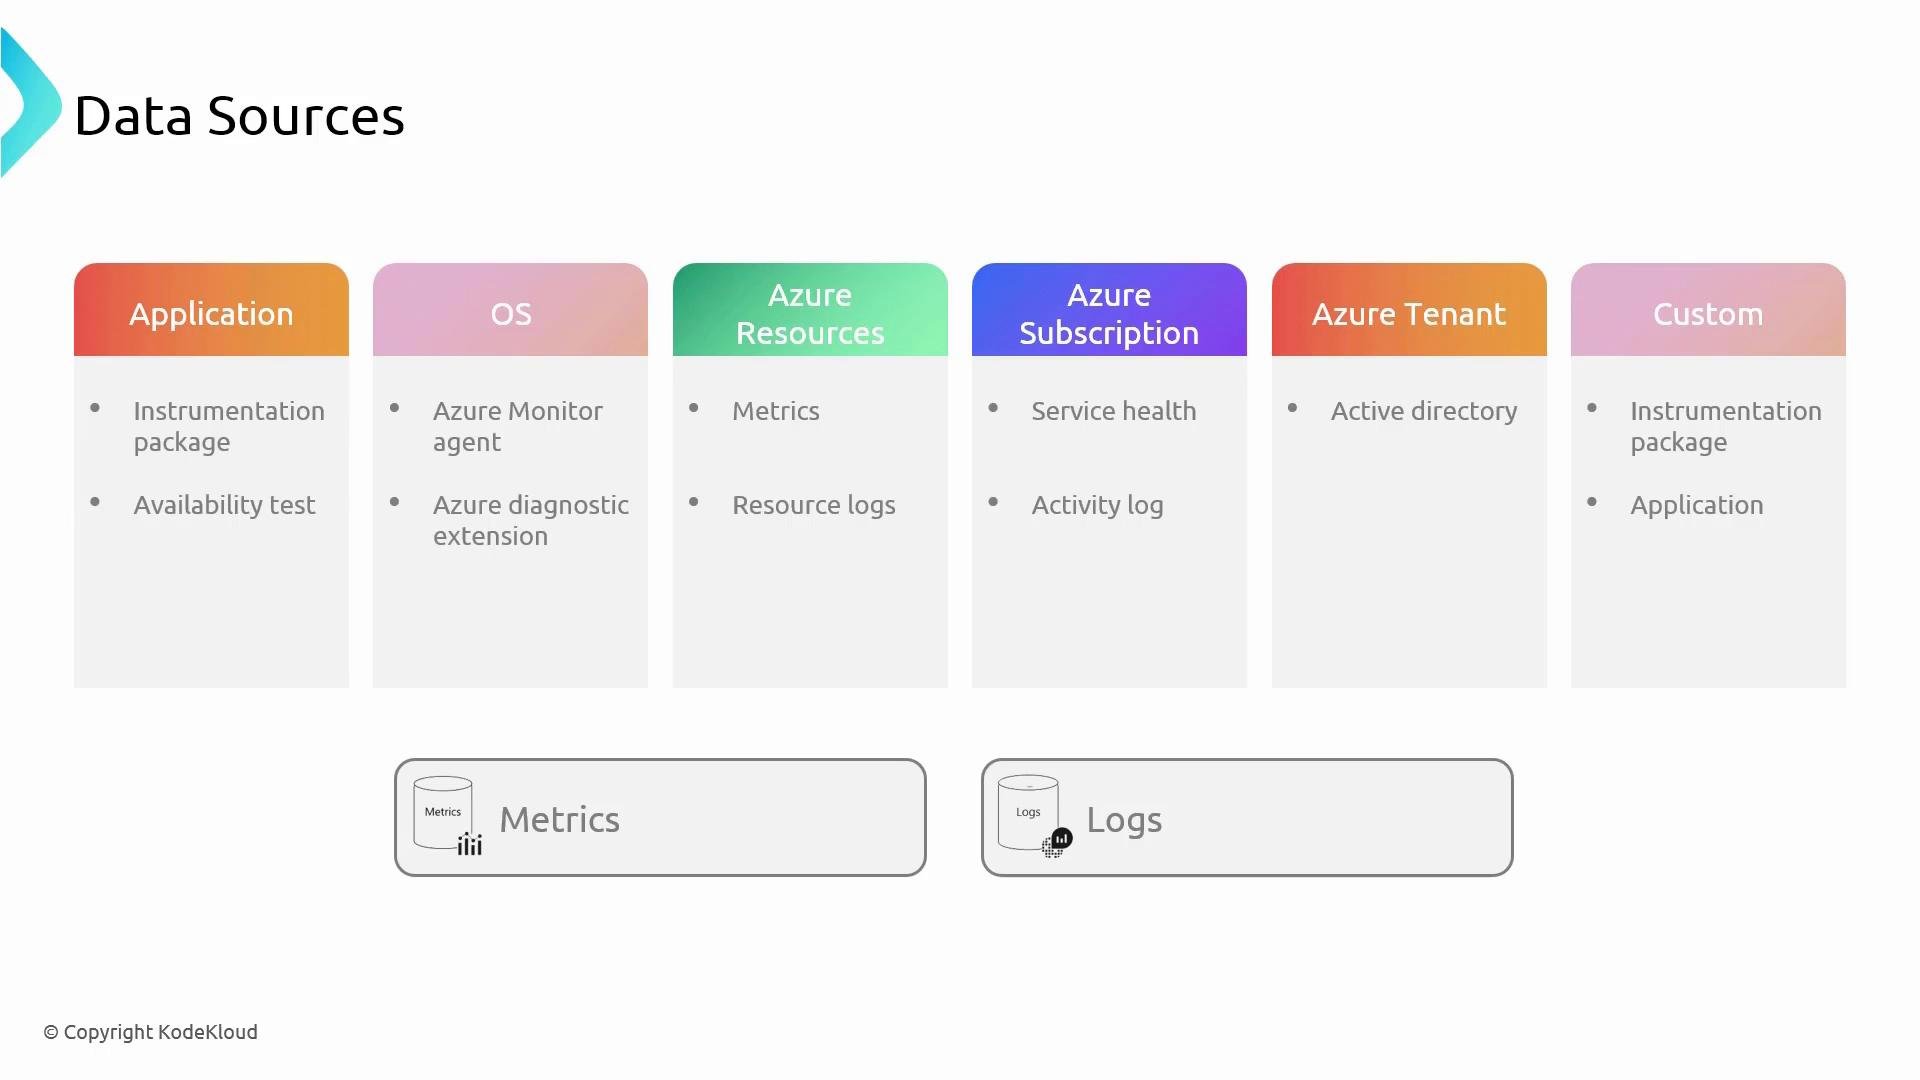
Azure Monitor ingests telemetry from a wide range of sources. The following table summarizes common sources and examples:
All these sources feed into the metrics and logs stores so you can analyze them with Azure Monitor features or route them to external systems.
Tip: For exam scenarios, prioritize knowing how to collect platform metrics (out of the box), enable diagnostic settings for logs, install AMA for VMs, and use KQL in Log Analytics for troubleshooting.
Links and references
- Azure Monitor metrics and logs overview: https://learn.microsoft.com/azure/azure-monitor/
- Log Analytics and KQL: https://learn.microsoft.com/azure/azure-monitor/logs/log-analytics-overview
- Azure Monitor Agent (AMA): https://learn.microsoft.com/azure/azure-monitor/agents/azure-monitor-agent
- Kusto Query Language (KQL) reference: https://learn.microsoft.com/azure/data-explorer/kusto/query
- Activity Logs overview: https://learn.microsoft.com/azure/azure-monitor/essentials/activity-logs