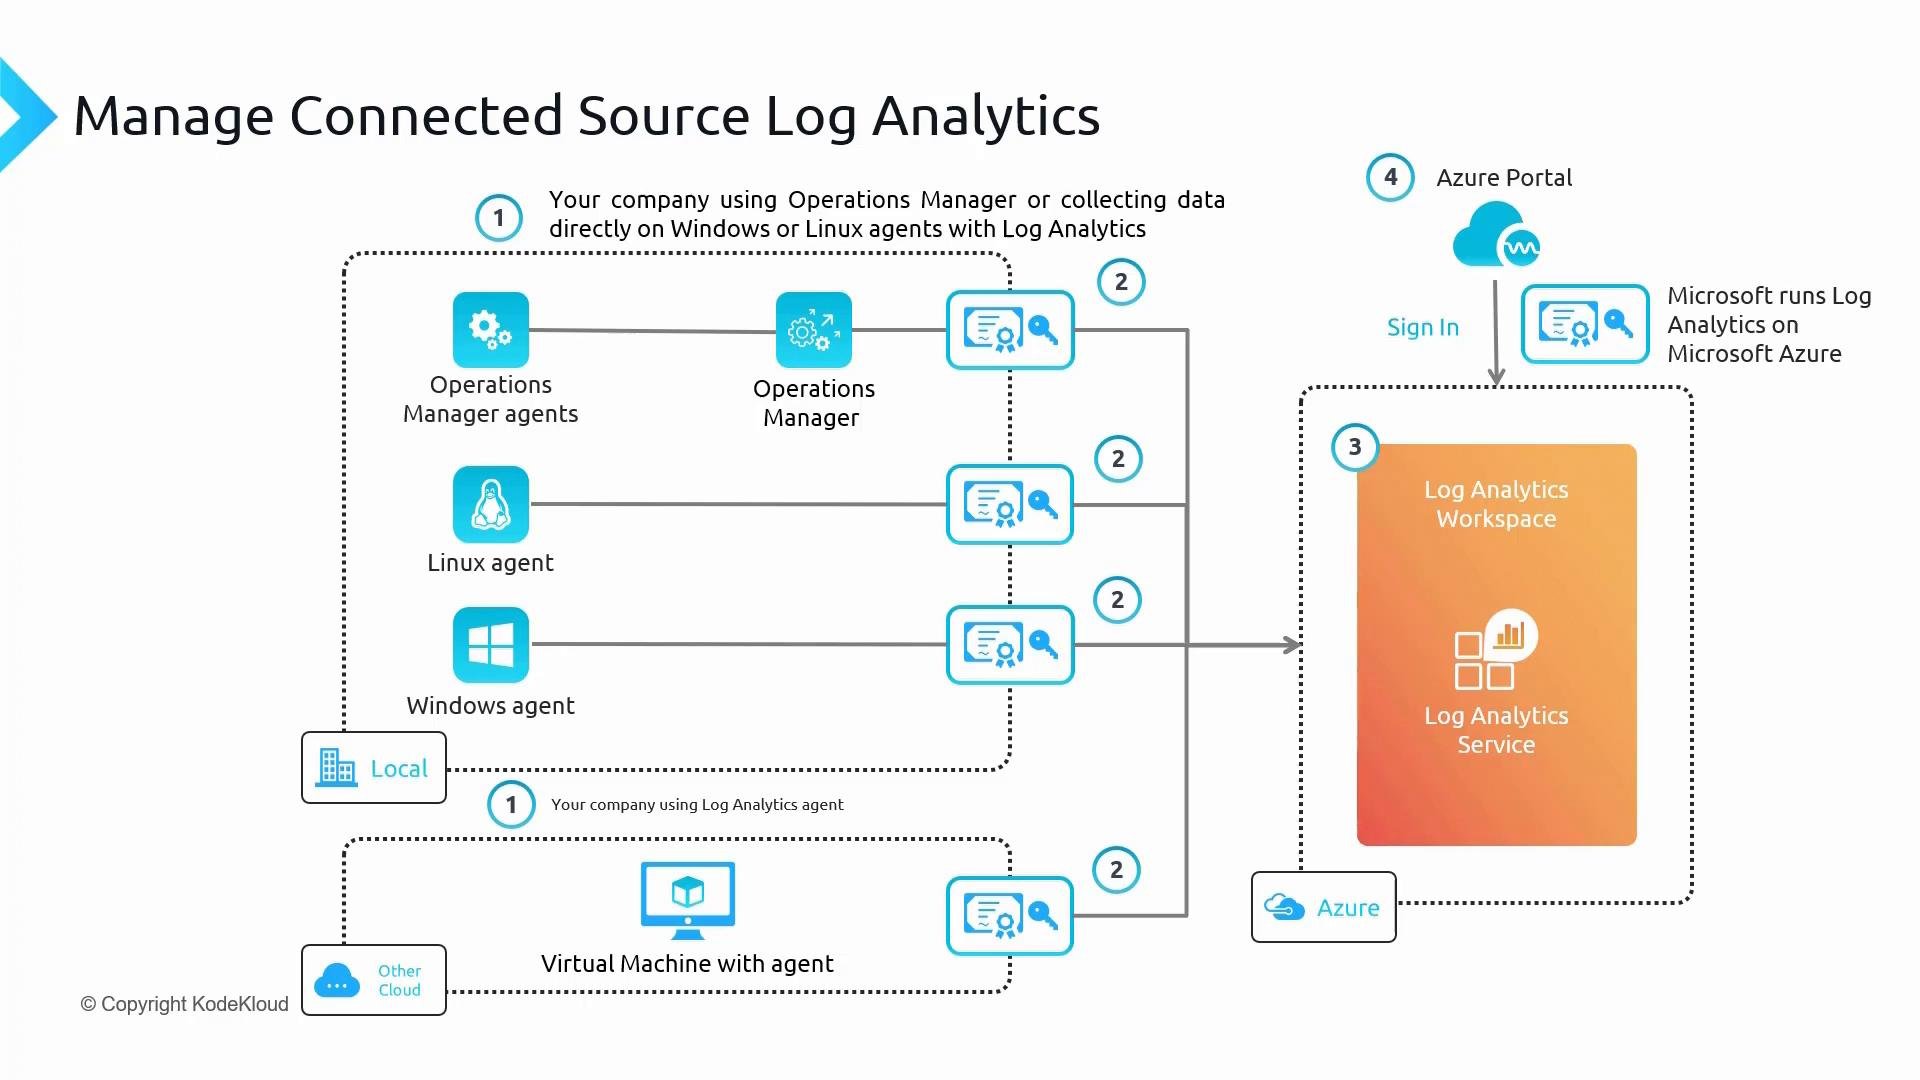
This guide explains how telemetry from on-premises, hybrid, and multi-cloud sources is ingested into an Azure Log Analytics workspace, how that data is stored in tables, and how to query it with Kusto Query Language (KQL). It also shows agent onboarding options (legacy MMA vs. the recommended AMA with Data Collection Rules), diagnostic settings for PaaS services, and example KQL queries you can use right away. We often have data sources both on-premises (local datacenters) and in other clouds such as AWS and GCP. All of this telemetry can be ingested into Azure using an agent or diagnostic settings that report to a Log Analytics workspace. Learn more: Log Analytics workspace overview Historically, the Log Analytics Agent (also called Microsoft Monitoring Agent, MMA, or OMS agent) was used for onboarding non-Azure machines. MMA is being deprecated; the recommended agent is the Azure Monitor Agent (AMA). For on-premises machines, use Azure Arc to onboard and manage machines so you can push extensions (including AMA) similarly to an Azure VM. Regardless of which agent or mechanism you use, you must enable collection on the resource (agent installation or a diagnostic setting) to send telemetry to a Log Analytics workspace.
A schematic diagram titled "Manage Connected Source Log Analytics" showing how Operations Manager, Windows/Linux agents and virtual machines send data to a Log Analytics Workspace running in Microsoft Azure. It illustrates agent types, data flow paths, and access via the Azure portal.

What happens when data arrives

Telemetry that arrives at a Log Analytics workspace is stored in tables. The destination table depends on the source and type of data. Common mappings include: Query the workspace using Kusto Query Language (KQL). See: Kusto query language (KQL) overview
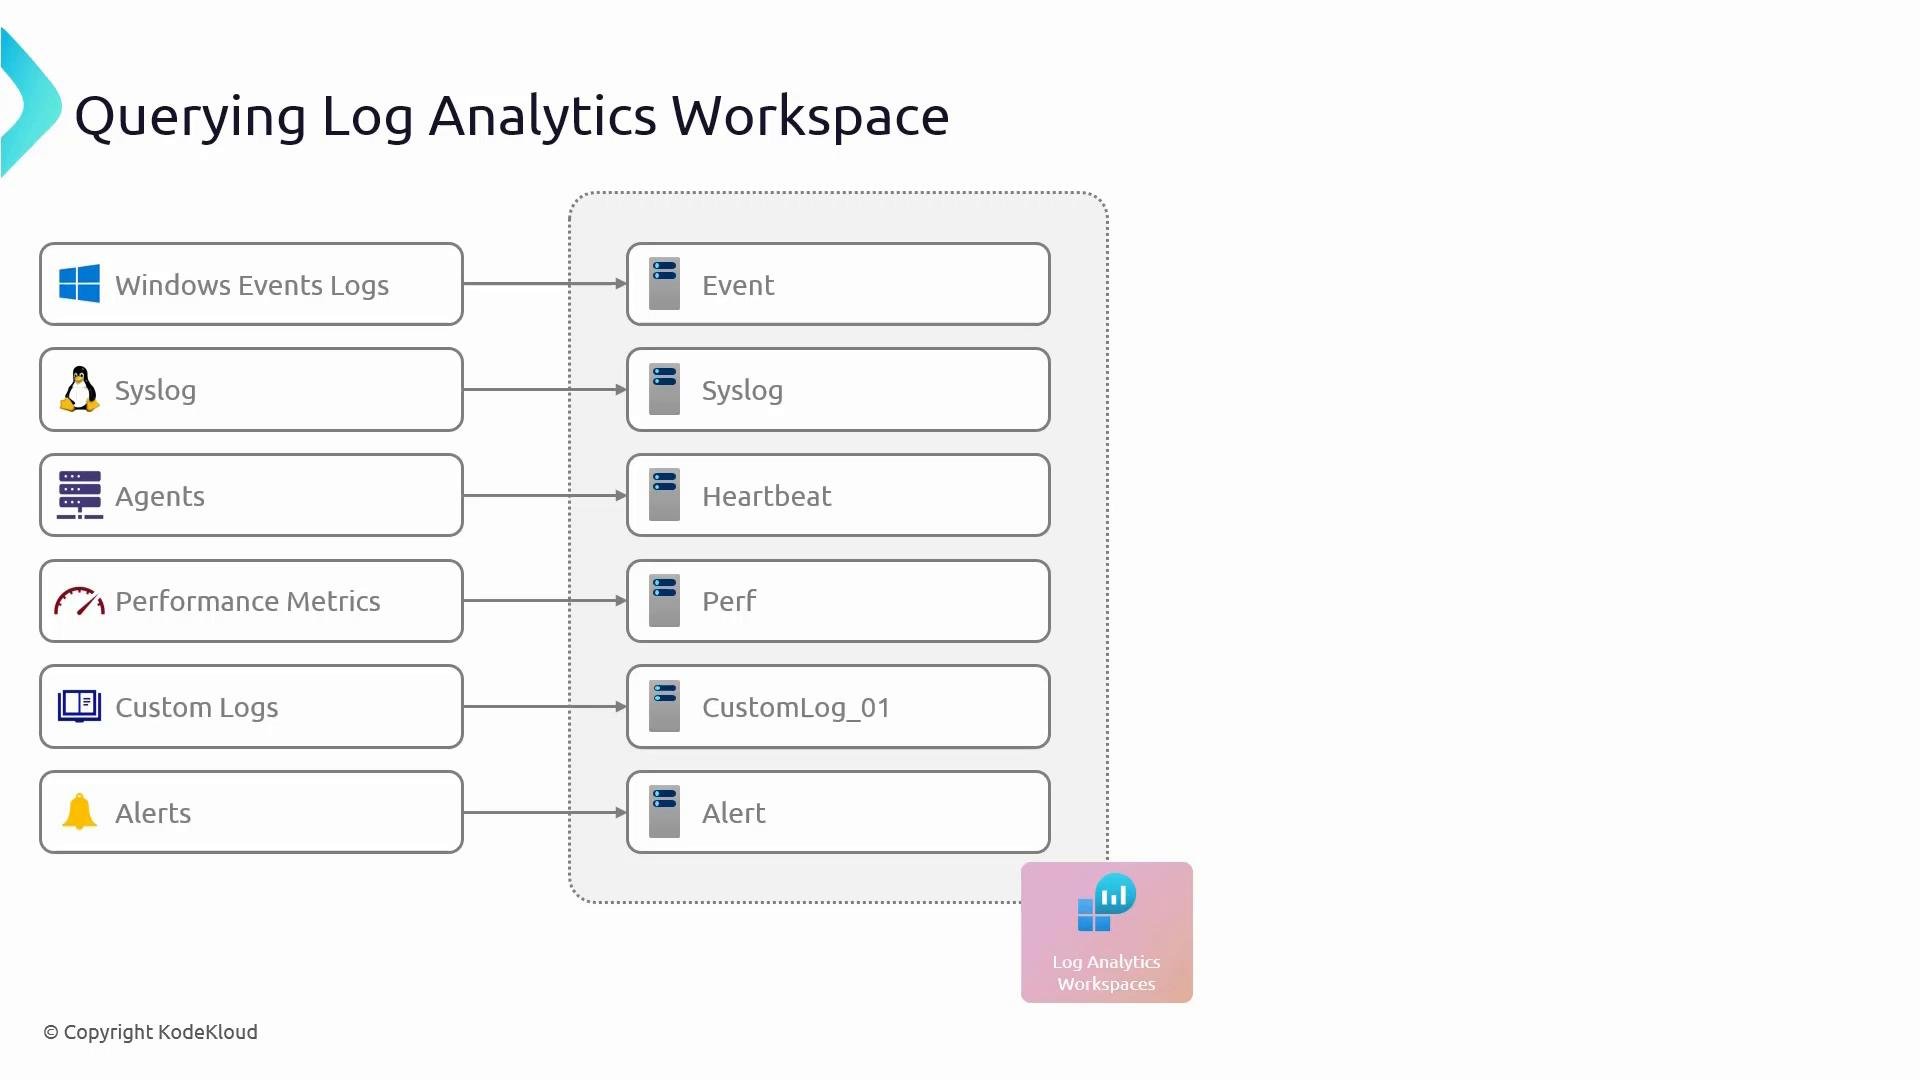
A diagram titled "Querying Log Analytics Workspace" showing data sources (Windows Event Logs, Syslog, Agents, Performance Metrics, Custom Logs, Alerts) feeding into corresponding tables (Event, Syslog, Heartbeat, Perf, CustomLog_01, Alert) inside a Log Analytics workspace. An icon at the bottom represents the Log Analytics Workspace as the destination.
Heartbeat records agent presence and category; Perf contains performance counter data. Custom logs and alert data are also queryable. Use KQL to filter, project, aggregate, and visualize telemetry.

Common KQL examples

Query the Perf table for the Available MBytes counter on a specific computer and render a time chart:
Show events with error severity:
Filter Heartbeat records for Windows Server 2016 domain controllers whose Computer name starts with “DC” and IP starts with “52”:
List recent Syslog entries:
AMA (Azure Monitor Agent) is the modern agent and should be used for new deployments. MMA (OMS agent) is deprecated and lacks support for some newer OS versions. For on-premises machines, use Azure Arc to install and manage AMA. If both MMA and AMA are enabled on a host they will both send telemetry (and both will incur ingestion charges).
This article walks through how agents and diagnostic settings are configured in the Azure portal and how tables populate as telemetry arrives.

Demo resources (example)

The demo referenced in this article uses:
  • A resource group (e.g., created by automation).
  • Two VMs (one Windows, one Linux).
  • A Web App (App Service).
You can create these with automation (scripts or a GitHub repo). The demo resource group in the example is named rgsecops.

Attempting to onboard using MMA (legacy)

The legacy flow installs the Log Analytics (MMA/OMS) agent on a VM and configures it to talk to a workspace. Parts of the portal still use this flow, but MMA does not support all OS releases (e.g., newer Ubuntu versions). When onboarding from the Log Analytics workspace > Virtual Machines (deprecated) blade you may see connection state per VM and a Connect option.
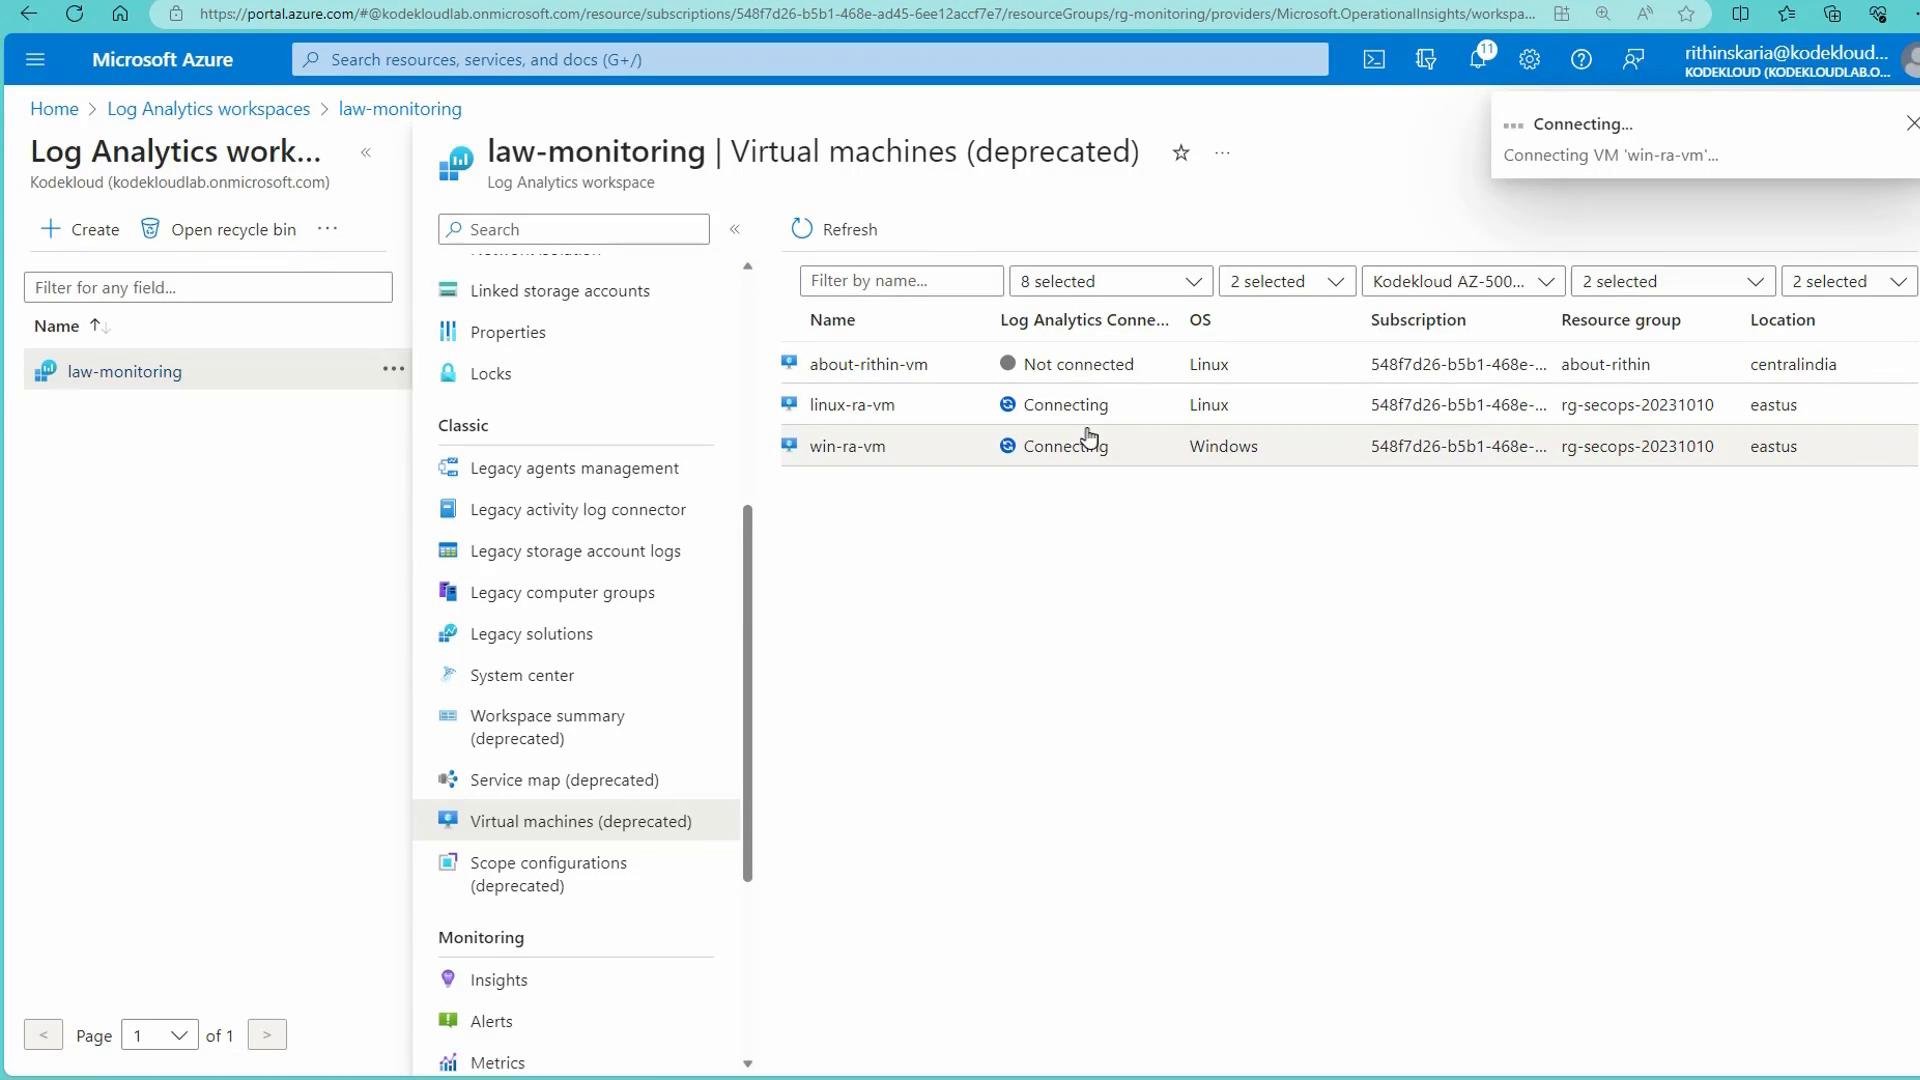
Screenshot of the Microsoft Azure portal showing the Log Analytics workspace "law-monitoring." The right pane displays the "Virtual machines (deprecated)" list with VM names, OS types (Linux/Windows) and connection statuses (Not connected/Connecting).
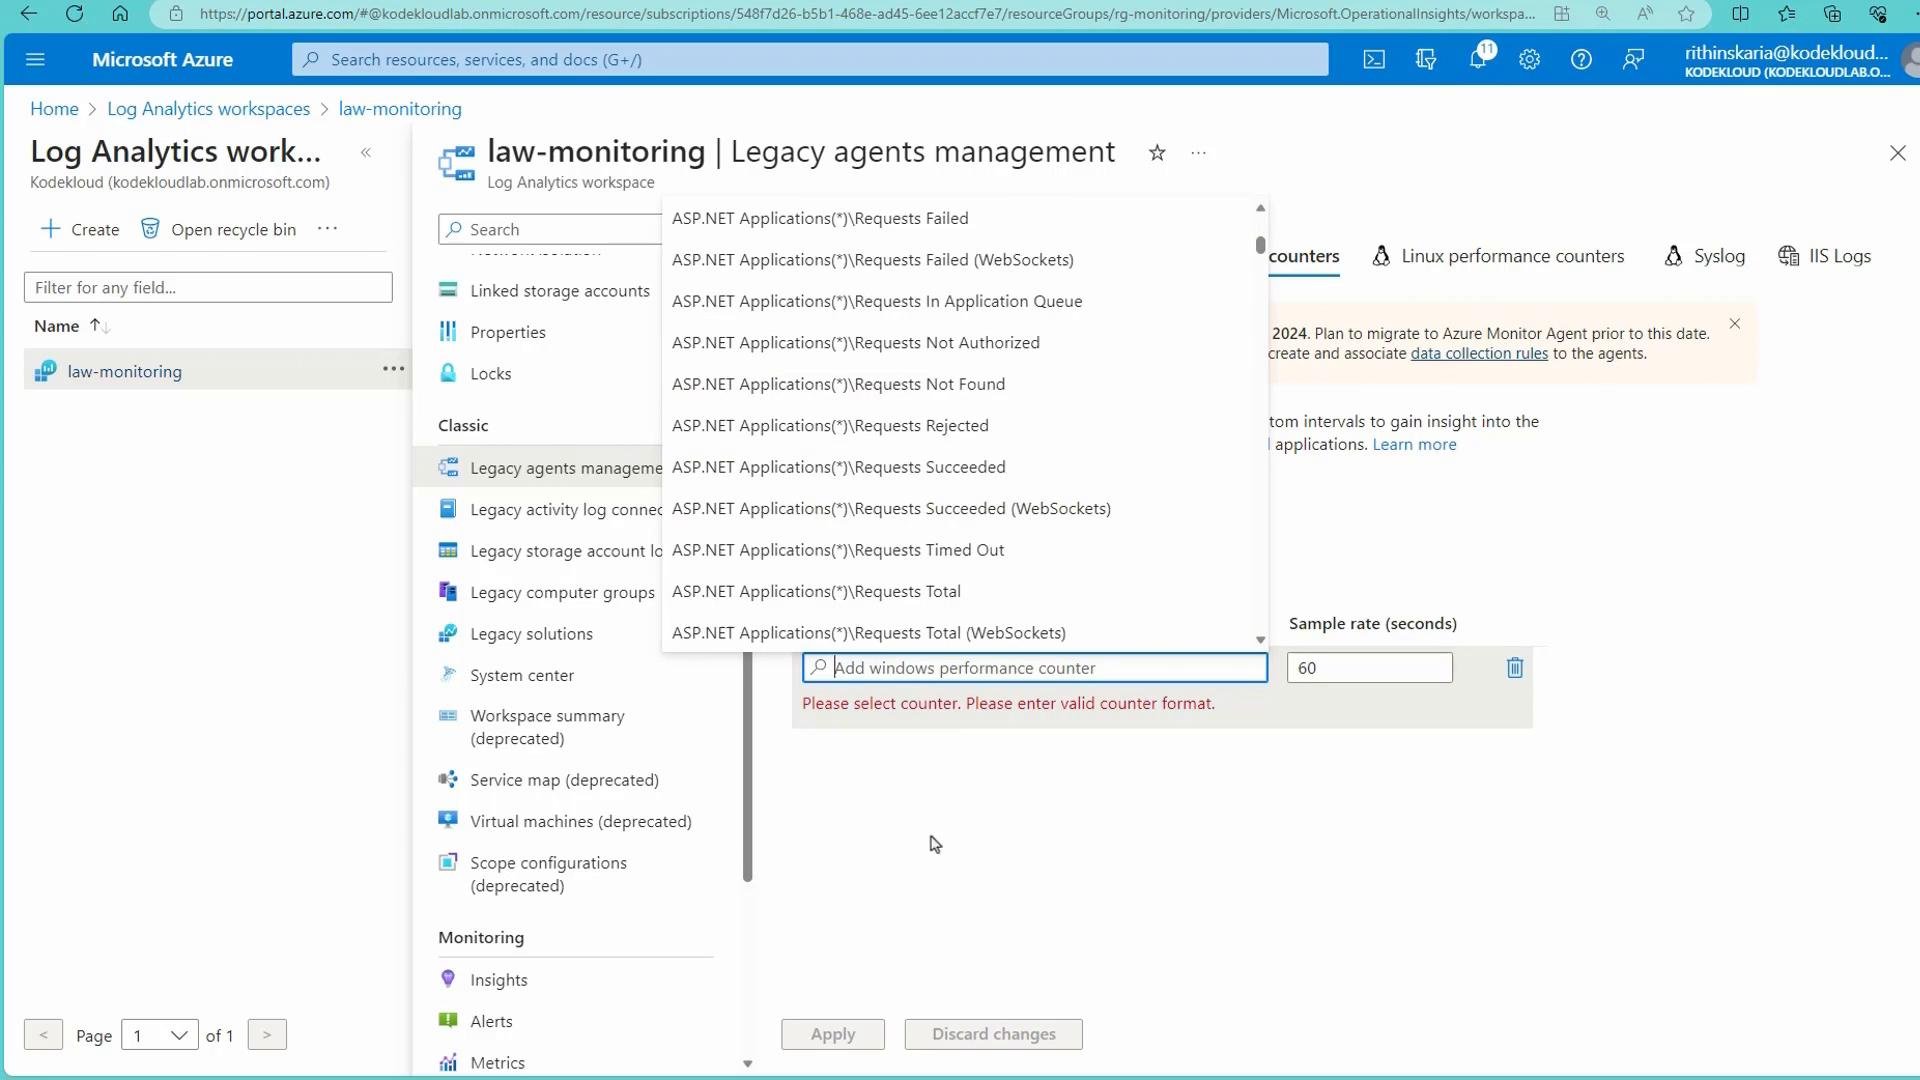
You can inspect legacy agent configuration such as additional performance counters or message logs to collect from the Legacy Agents management pane.
Screenshot of the Microsoft Azure portal showing a Log Analytics workspace called "law-monitoring" with the Legacy agents management pane open. A dropdown list of ASP.NET performance counters is displayed and a sample rate field with a validation message is visible.
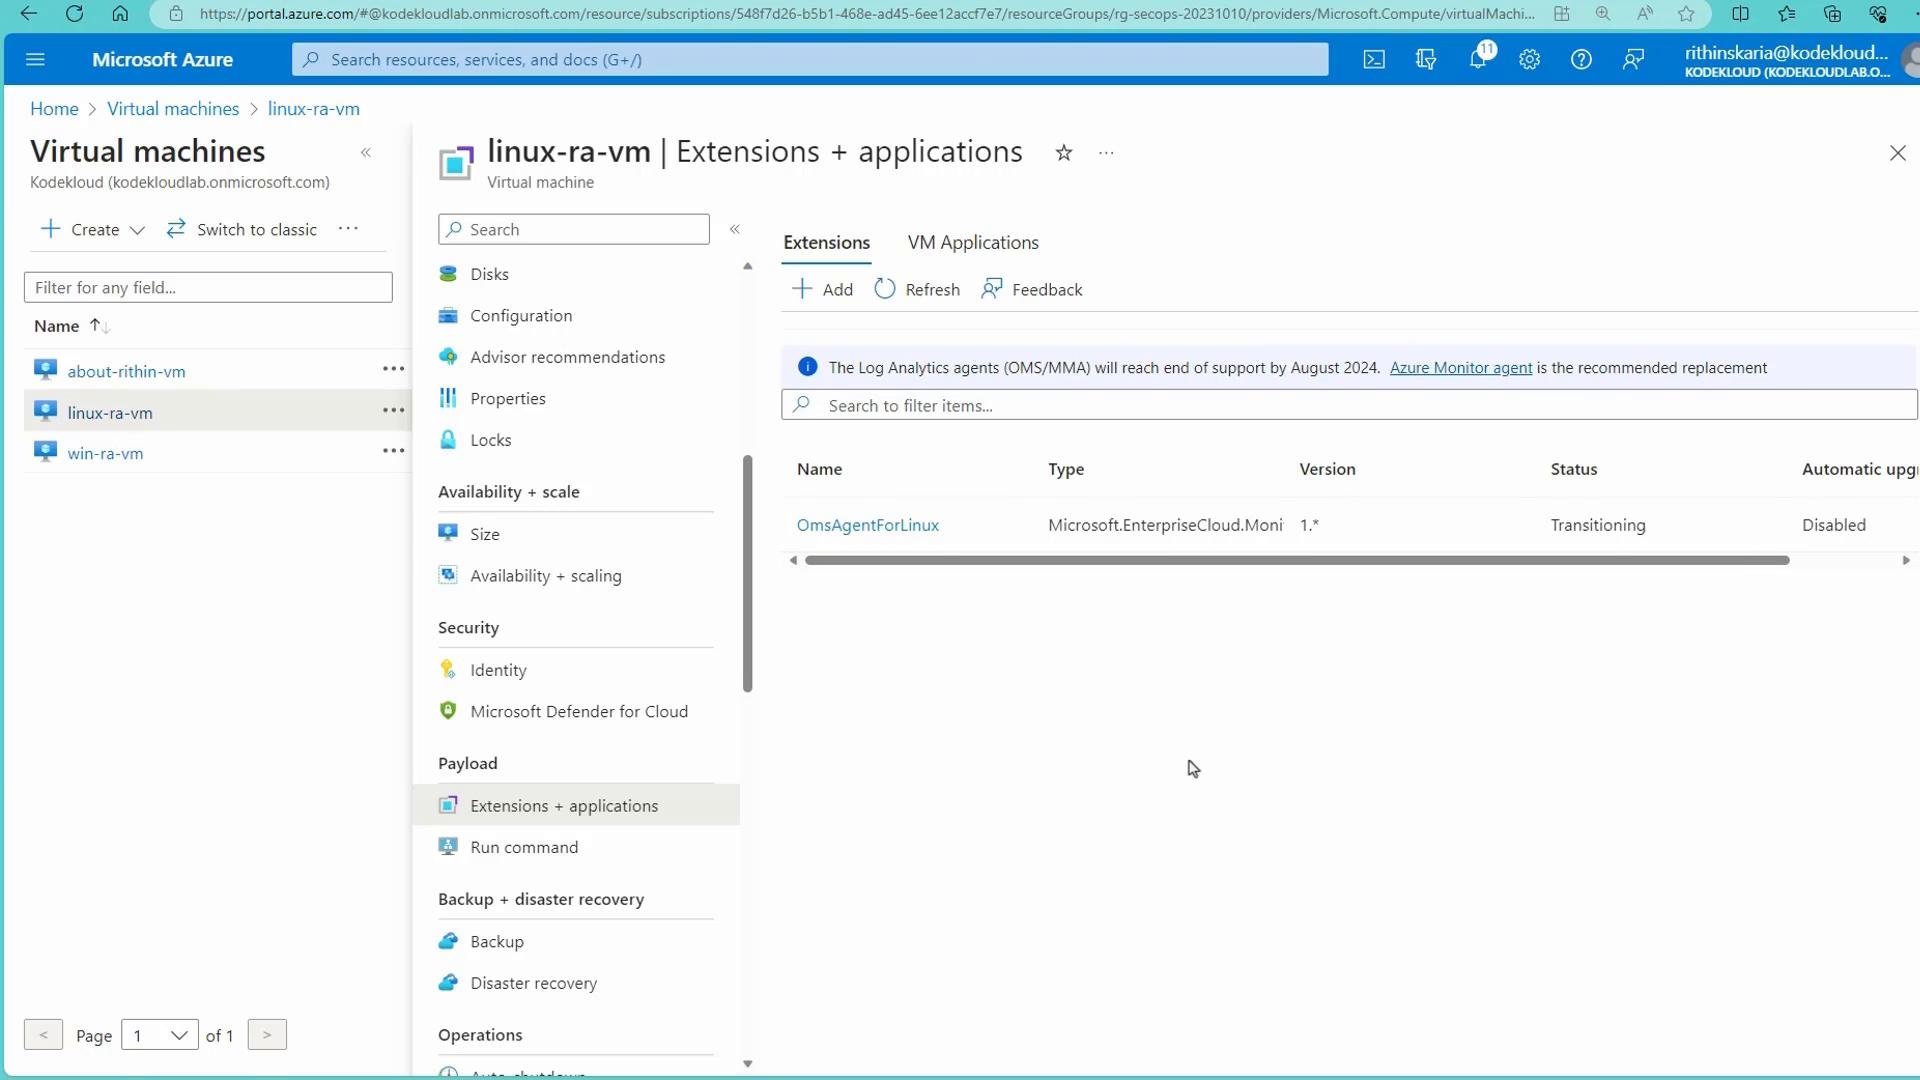
If an OS is unsupported (for example, Ubuntu 22.04), the OMS agent/extension installation will fail. Example extension error:
This limitation is one reason to migrate to AMA — it supports newer distributions and uses Data Collection Rules for flexible onboarding.
Screenshot of the Microsoft Azure portal showing the Virtual machines pane and the "linux-ra-vm" Extensions + applications blade, listing the OmsAgentForLinux extension with status "Transitioning."
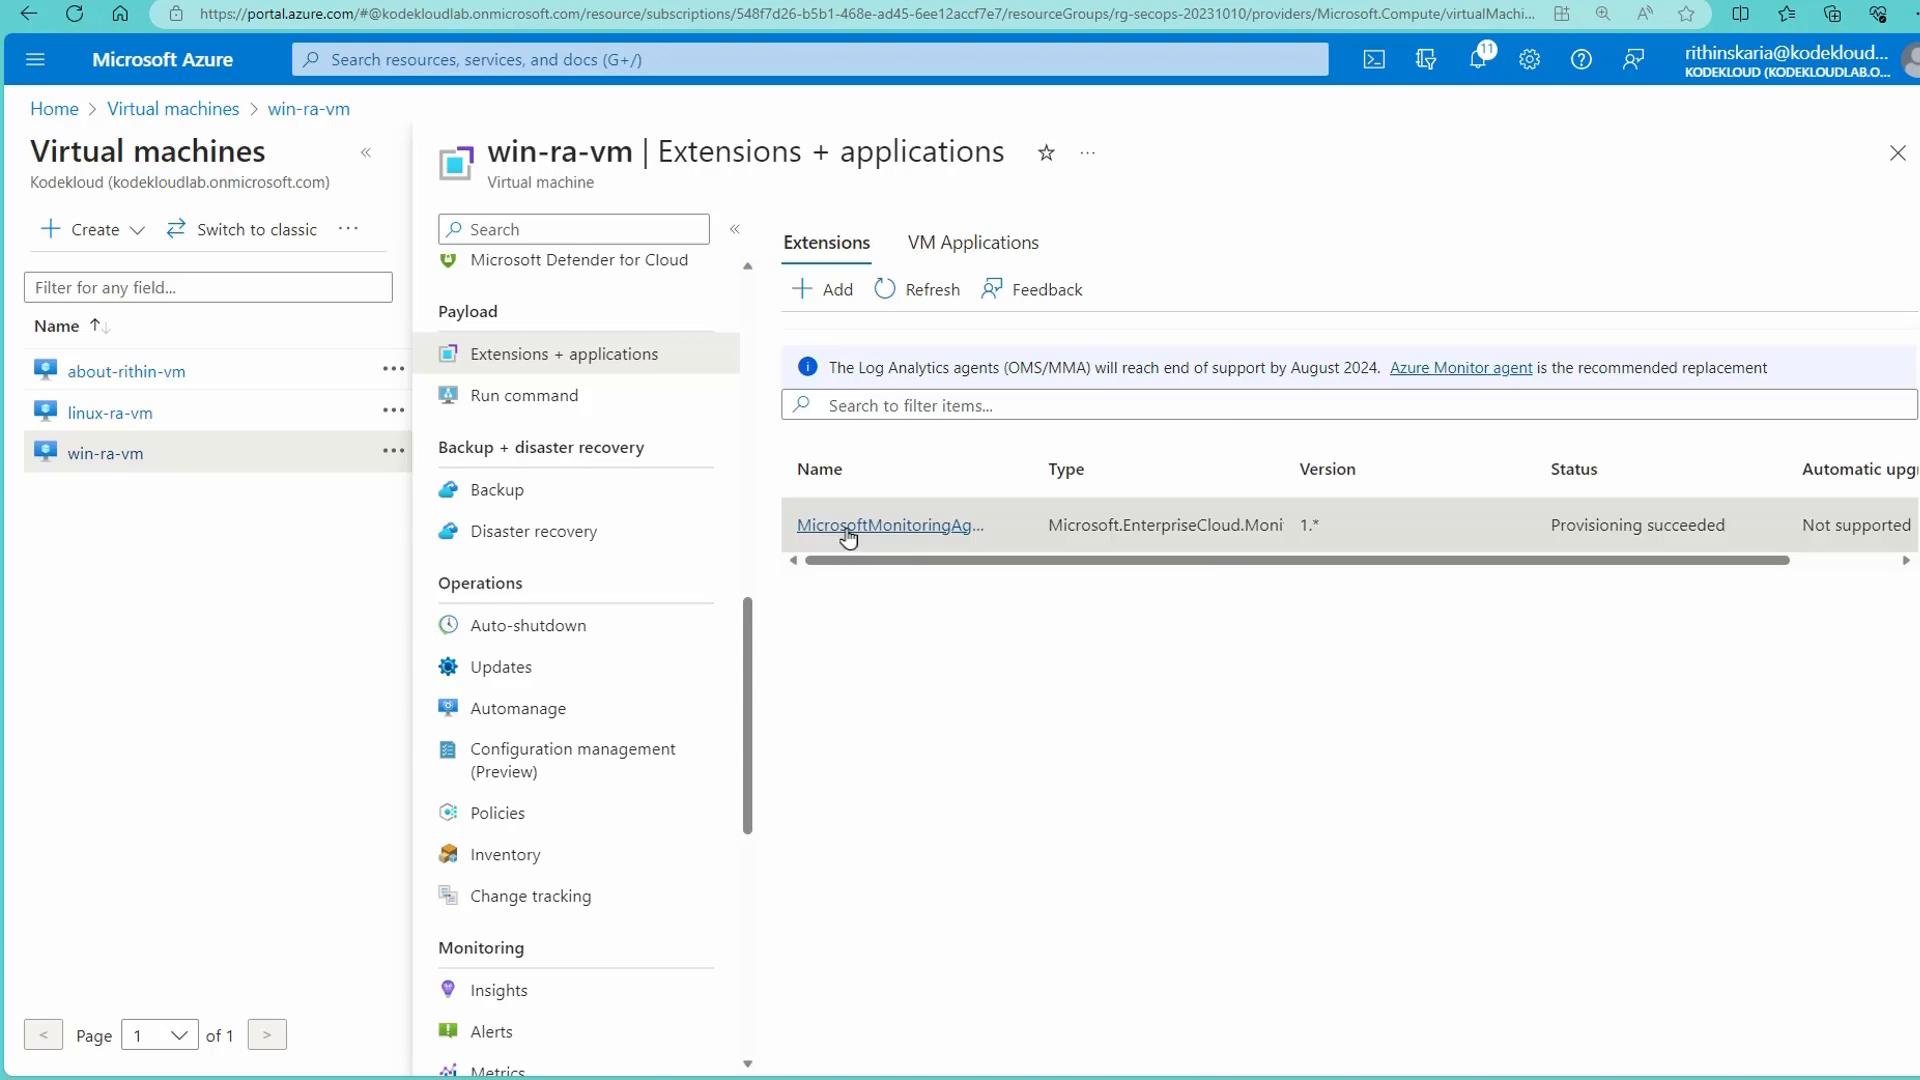
The Windows VM in the demo successfully provisions the Microsoft Monitoring Agent (MMA) extension:
A screenshot of the Microsoft Azure portal on the "Virtual machines" blade for a VM named "win-ra-vm," open to the Extensions + applications tab showing the Microsoft Monitoring Agent with status "Provisioning succeeded." The left pane lists other VMs and operations like Backup, Auto-shutdown and Monitoring.
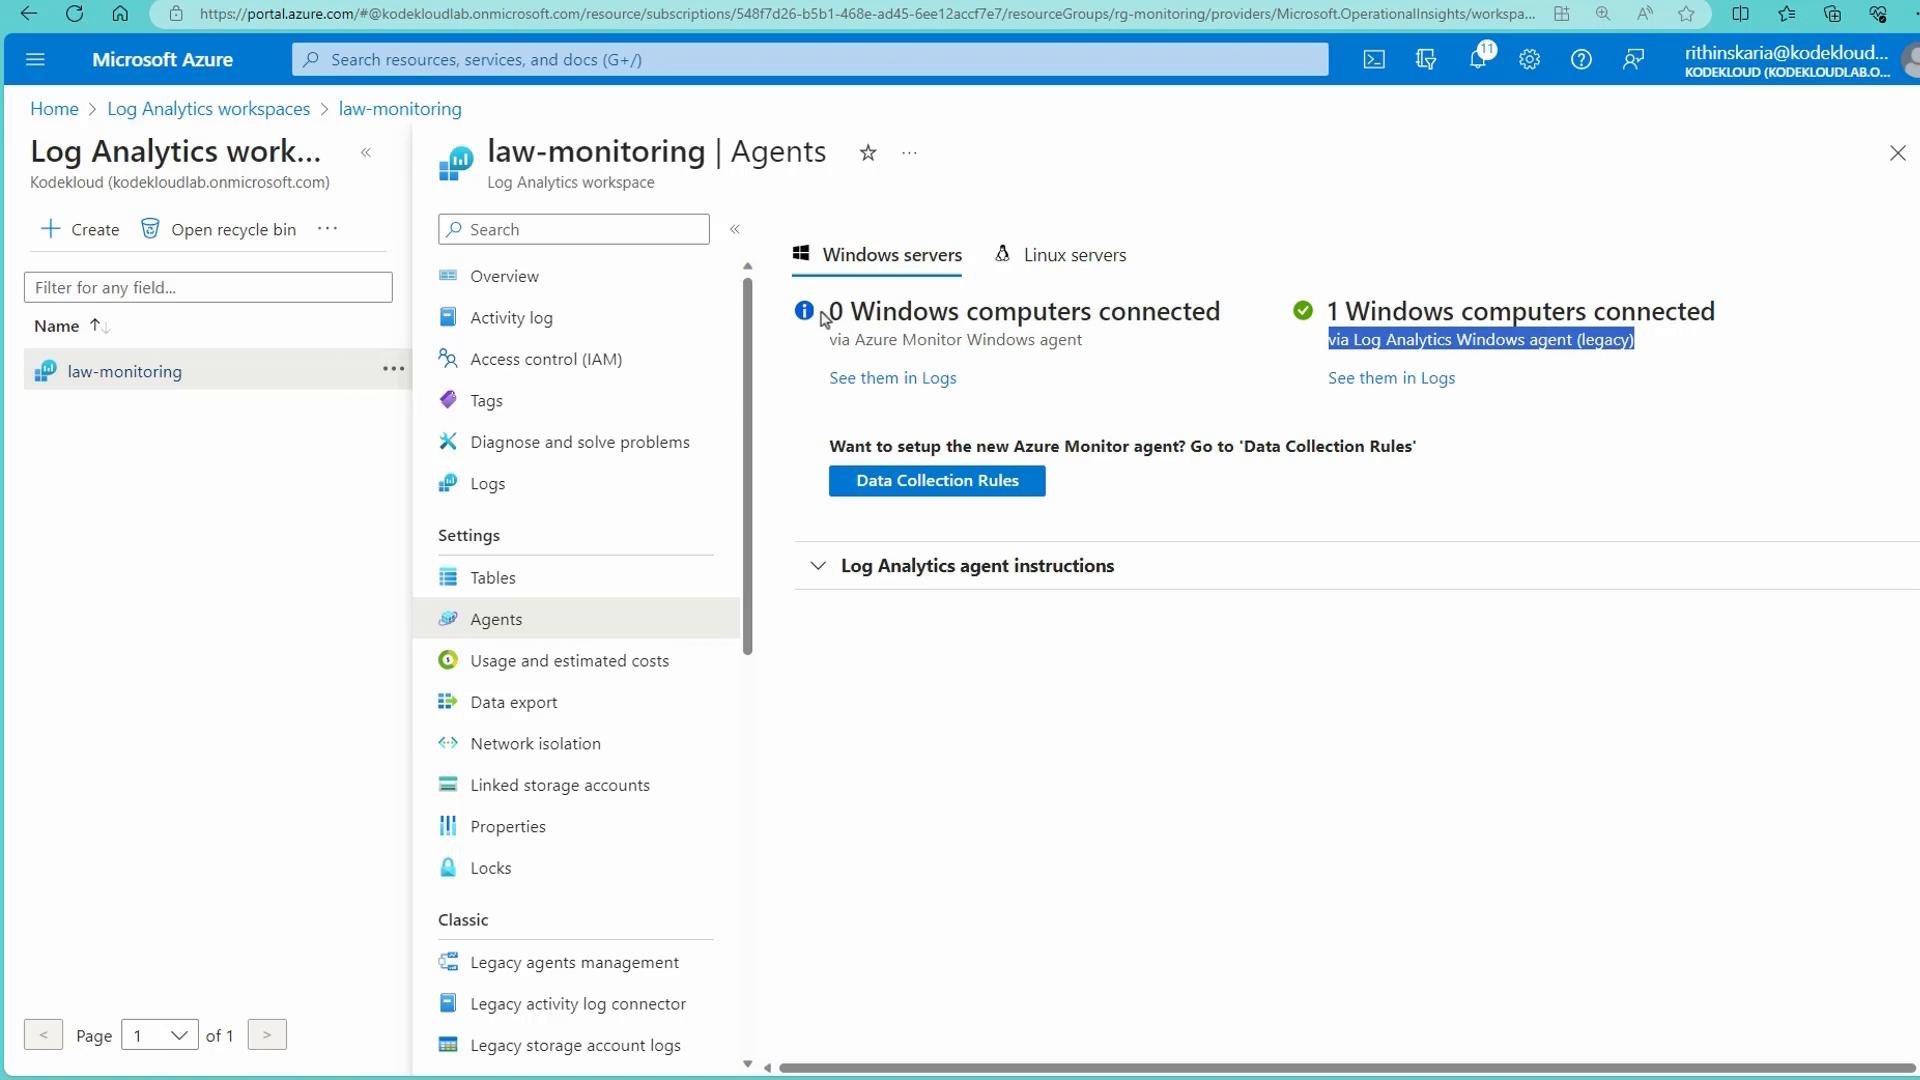
Back in the Log Analytics workspace > Agents page you can see machine counts reporting via legacy vs AMA once both are installed and reporting.
Screenshot of the Microsoft Azure portal showing the Log Analytics workspace "law-monitoring" Agents page. The panel reports 0 Windows computers connected via the Azure Monitor agent and 1 Windows computer connected via the legacy Log Analytics Windows agent.
Run a simple Heartbeat query in Logs to verify agent heartbeats once agents are connected:

Using AMA (Azure Monitor Agent) and Data Collection Rules (DCR)

AMA uses Data Collection Rules (DCRs) to define what to collect and where to send it. A DCR contains:
  • Data sources (Windows Event Logs, Performance Counters, Syslog, custom logs, etc.)
  • Destinations (Log Analytics workspace, Azure Monitor metrics, etc.)
  • Scope (which resources the DCR applies to)
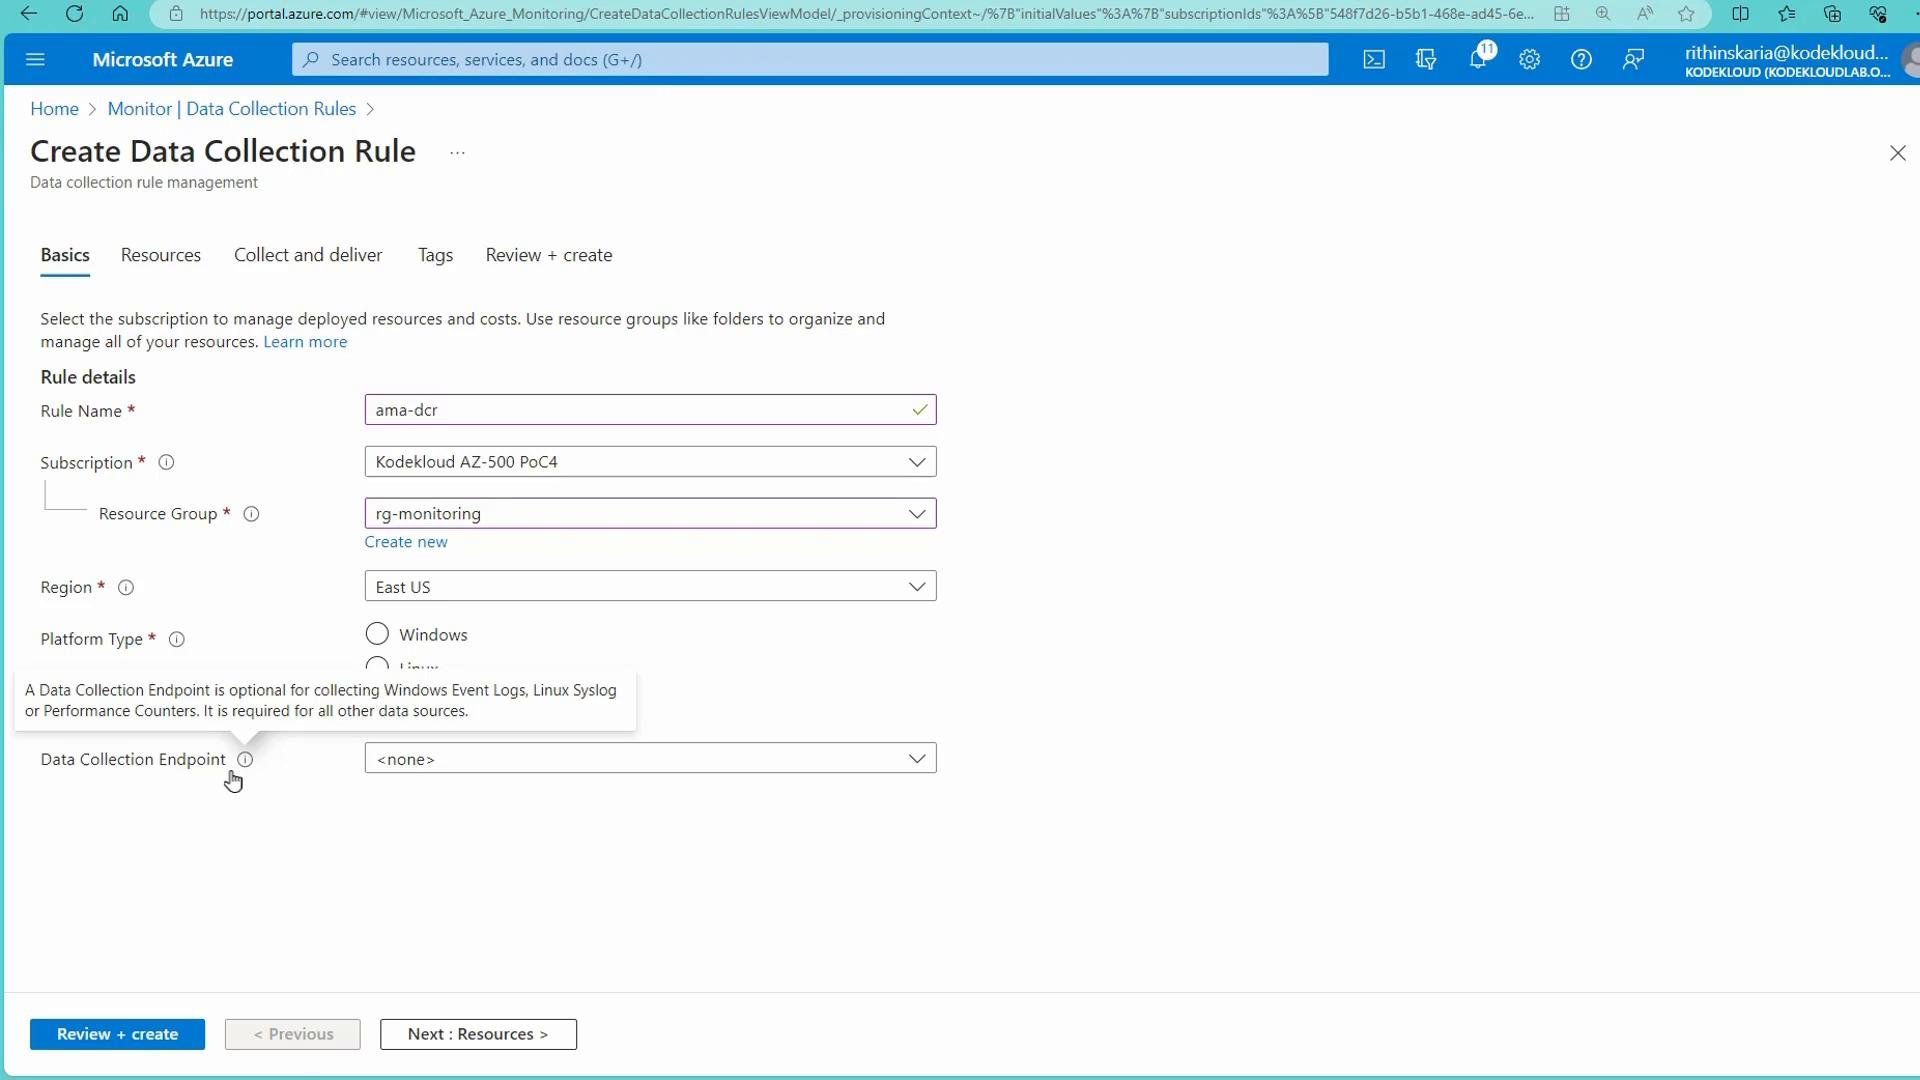
Create a DCR in the portal: Monitor > Data Collection Rules > Create.
A screenshot of the Microsoft Azure portal showing the "Create Data Collection Rule" form in Azure Monitor, with fields for rule name, subscription, resource group, region, platform type, and data collection endpoint. The page is on the "Basics" tab and displays a "Review + create" button.
When defining the DCR:
  • Choose the platform type (Windows, Linux, or All).
  • Add Windows Event Log channels and severity levels (Critical, Error, Warning, etc.).
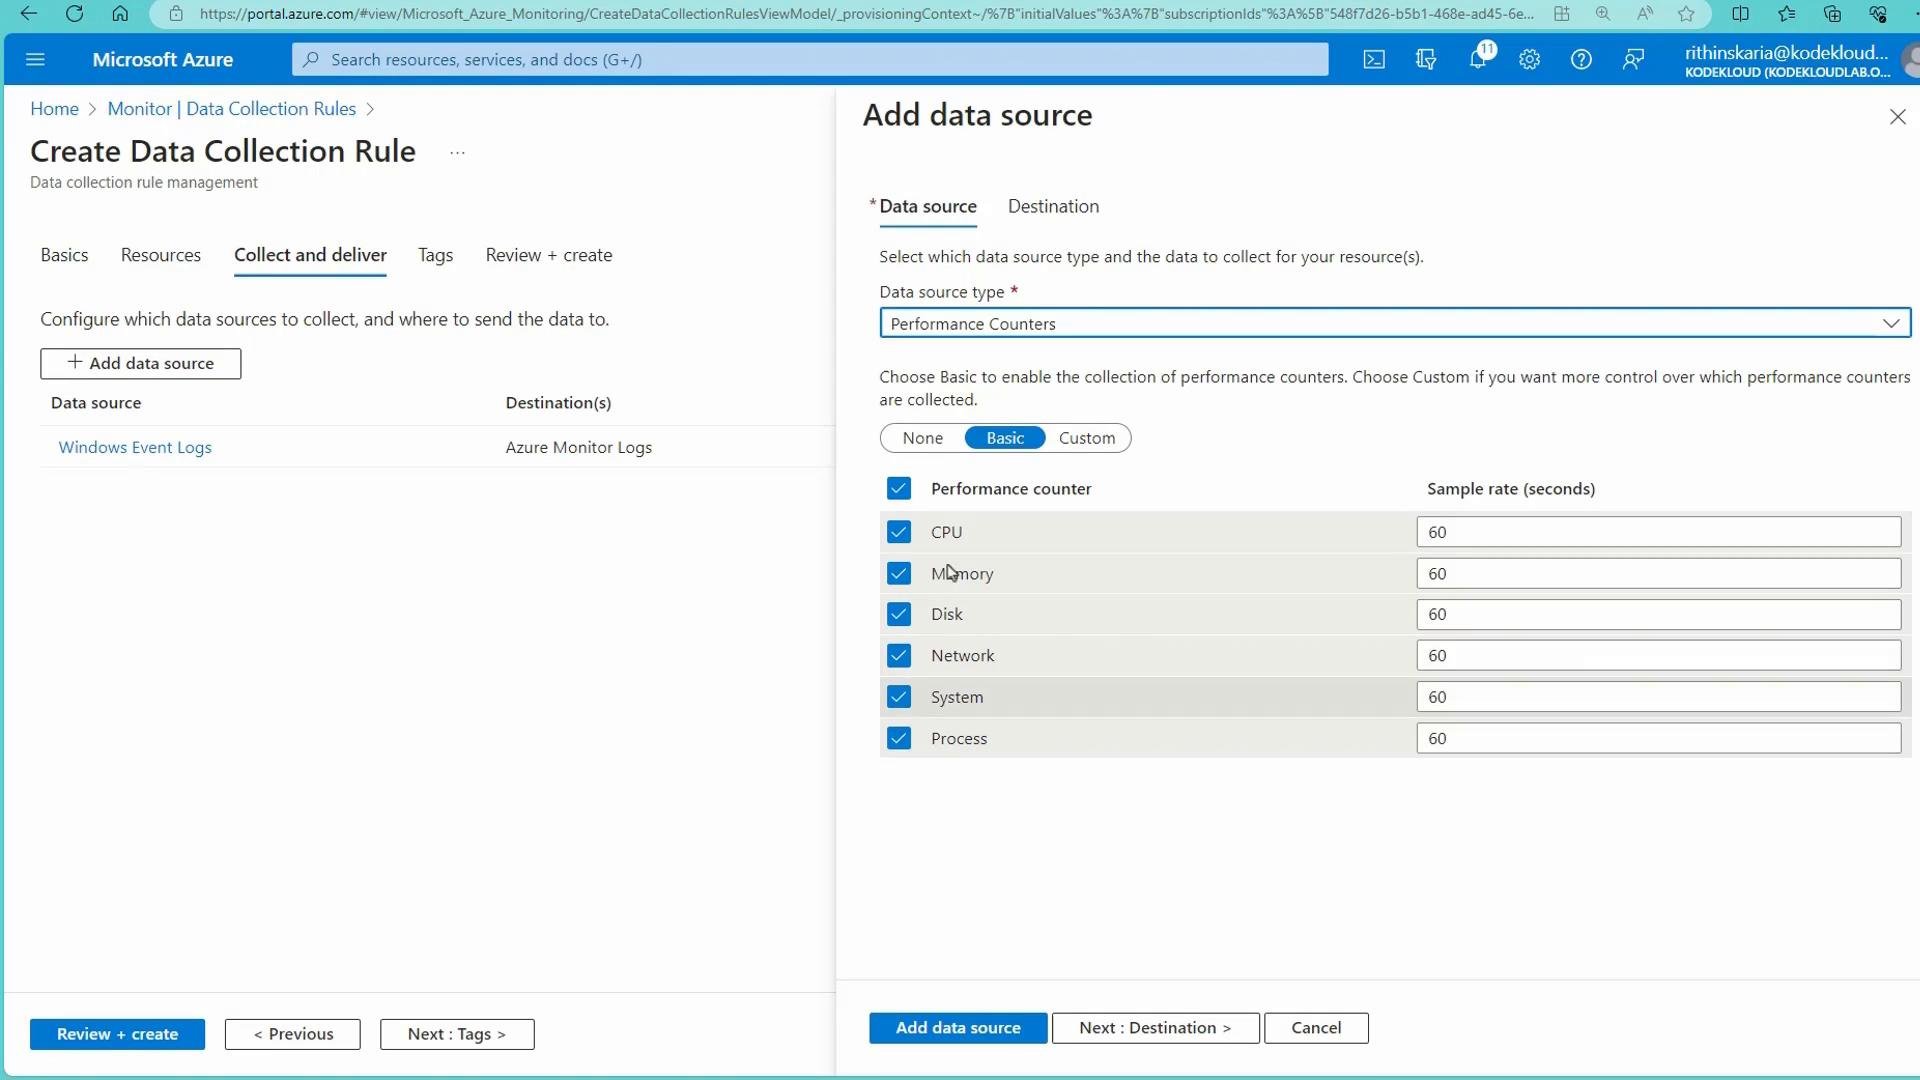
  • Select Performance Counters and sampling rate (e.g., CPU, Memory, Disk).
  • For Linux, add Syslog facilities and minimum log levels.
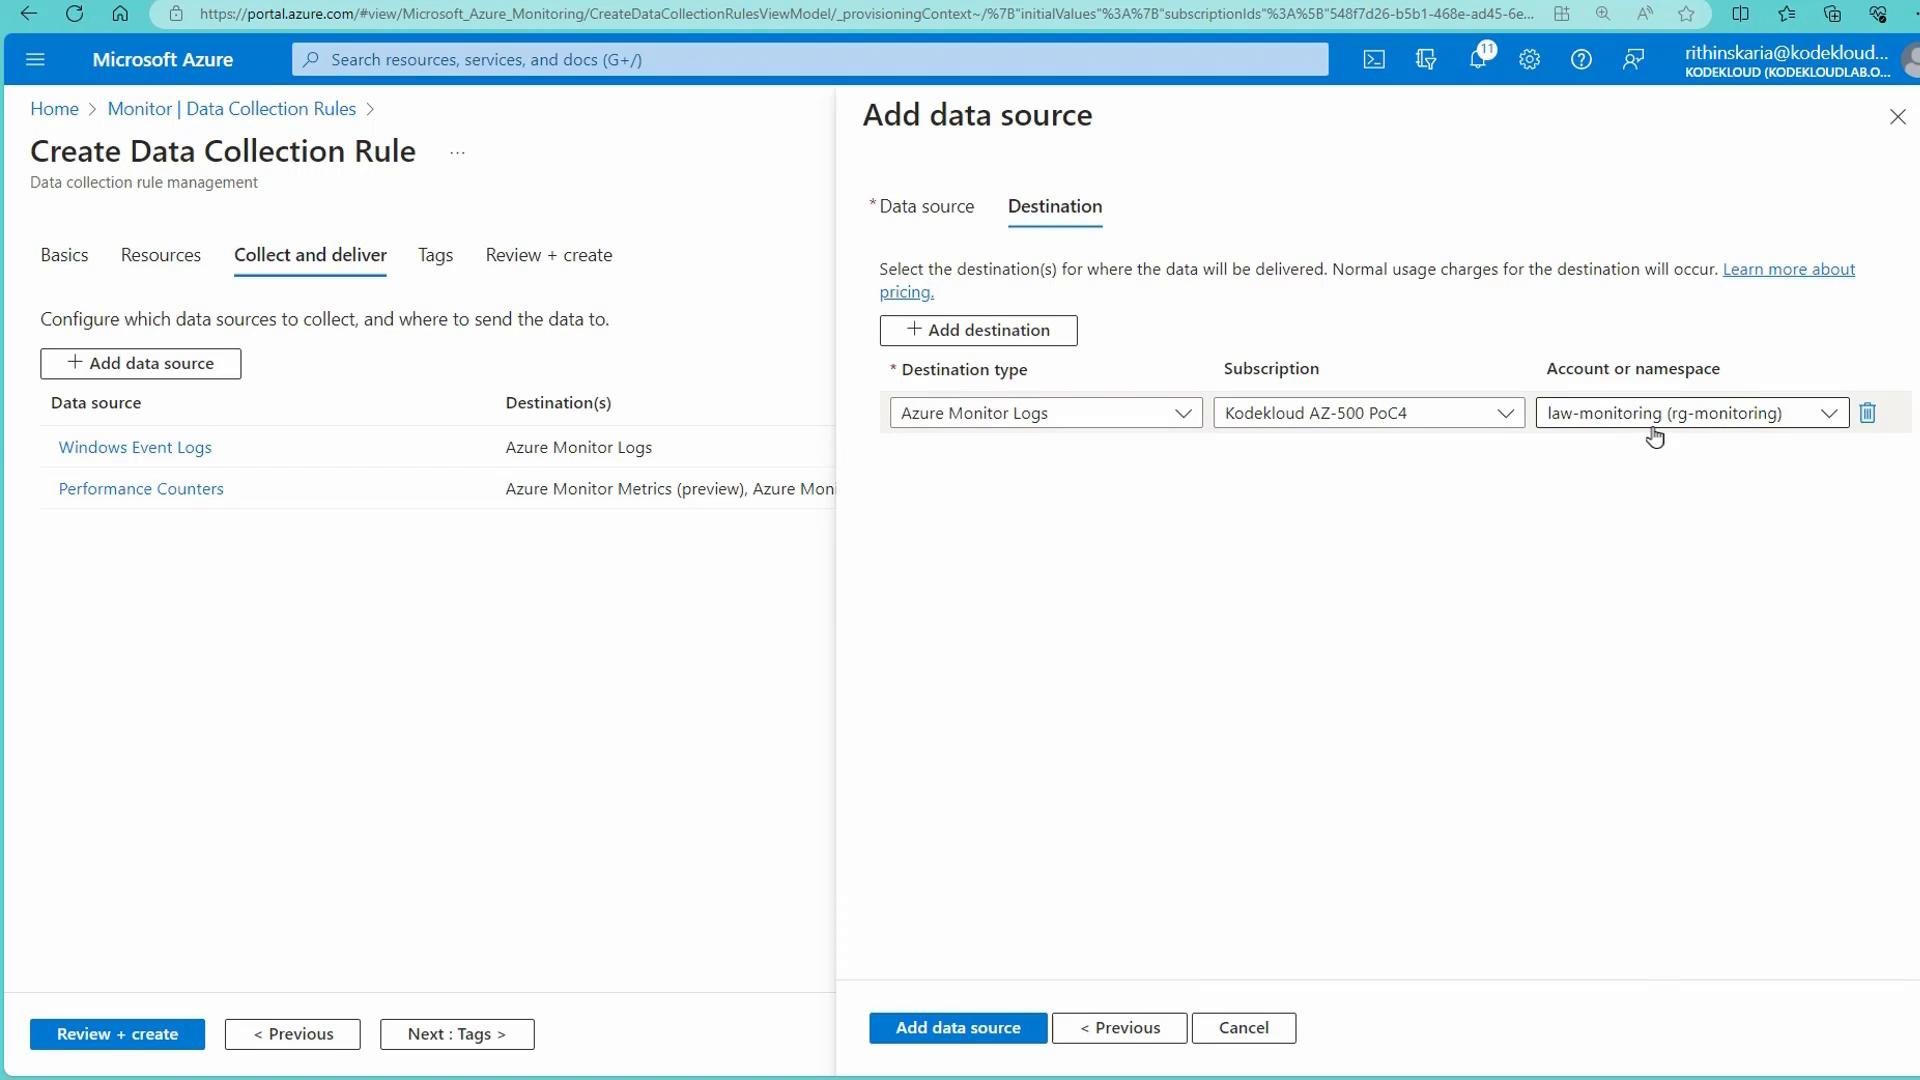
  • Add a destination — usually your Log Analytics workspace.
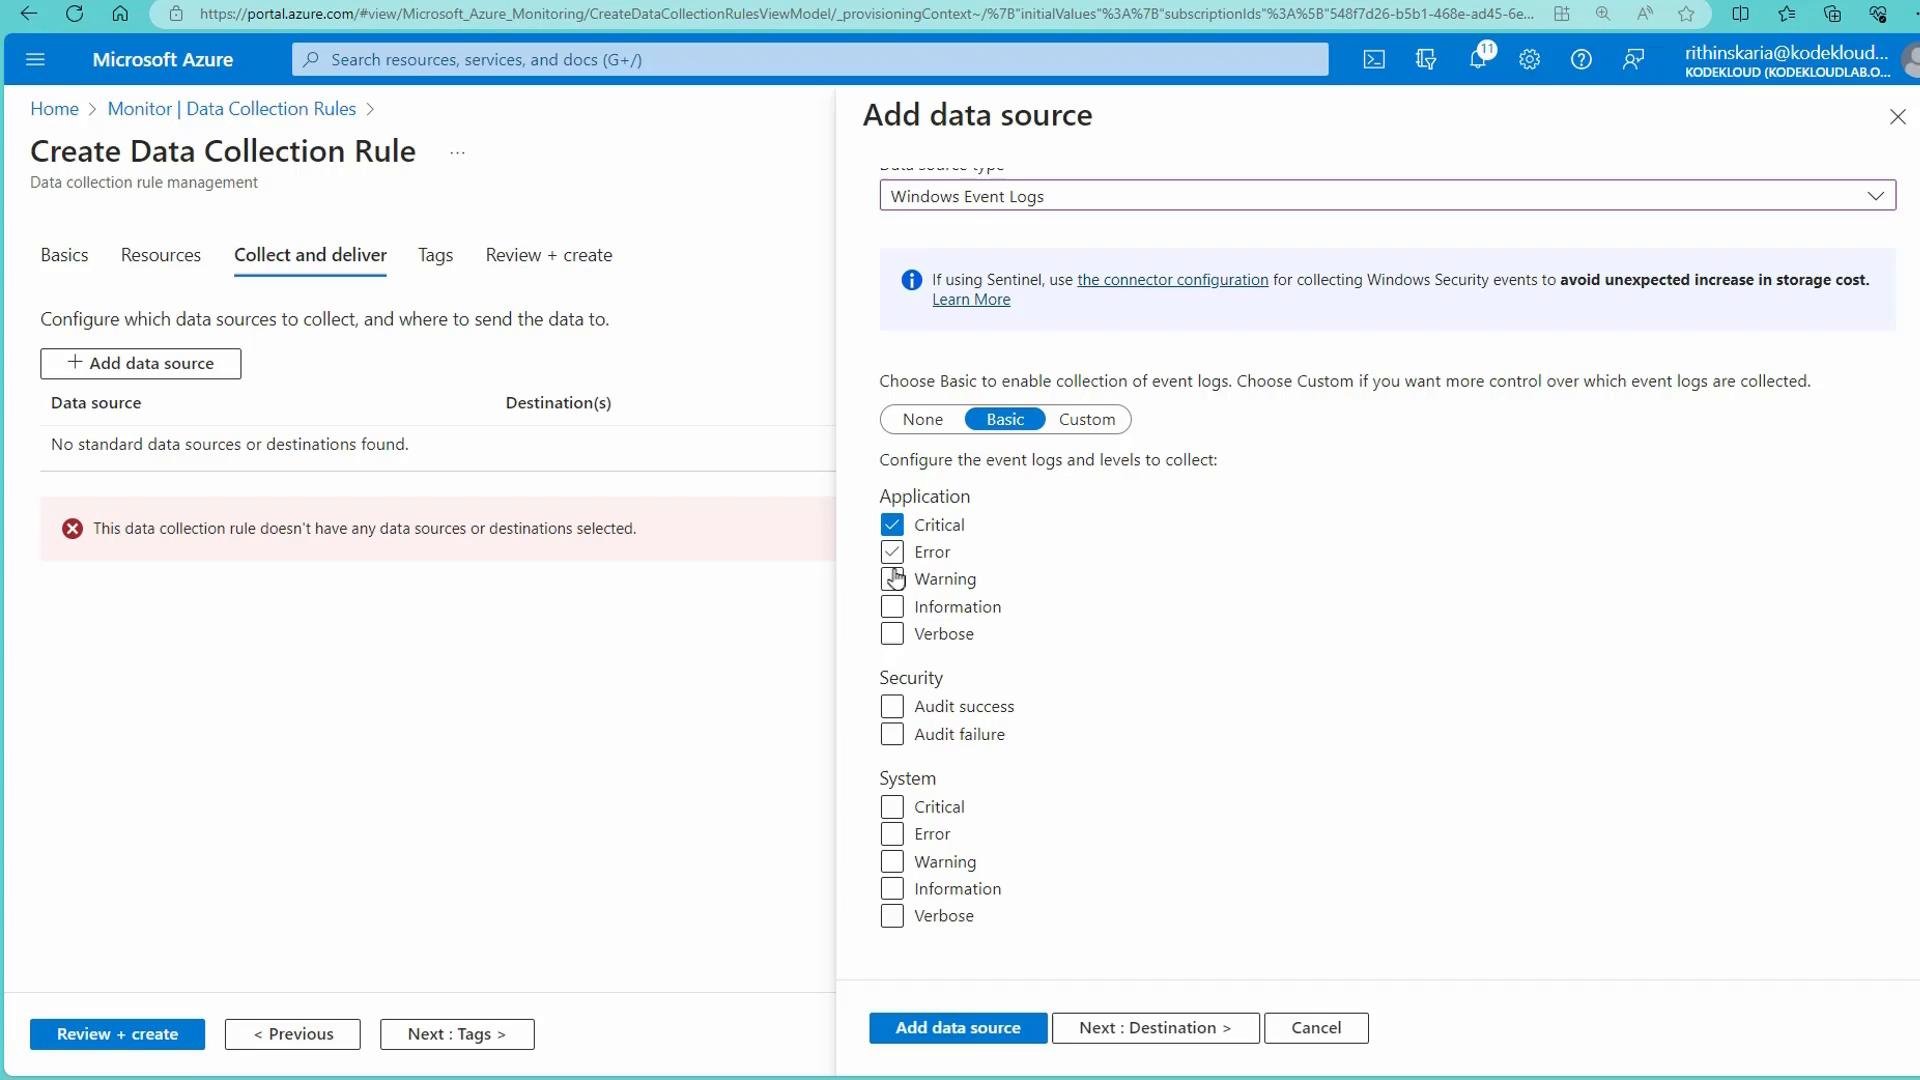
Add resources (scope) so AMA will be installed automatically on those VMs. Azure creates a managed identity to perform extension installation and configuration. Here are screenshots of adding Windows Event Logs and Performance Counters to a DCR:
A Microsoft Azure portal screenshot showing the "Create Data Collection Rule" page (Collect and deliver tab). The right pane is the "Add data source" dialog for Windows Event Logs with log-level checkboxes and a warning that no data sources or destinations are selected.
A screenshot of the Microsoft Azure portal showing the "Create Data Collection Rule" workflow with the "Add data source" pane open, selecting "Performance Counters" (CPU, Memory, Disk, Network, System, Process) with a 60-second sample rate. The left pane shows the "Collect and deliver" tab and an existing "Windows Event Logs" data source targeted to Azure Monitor Logs.
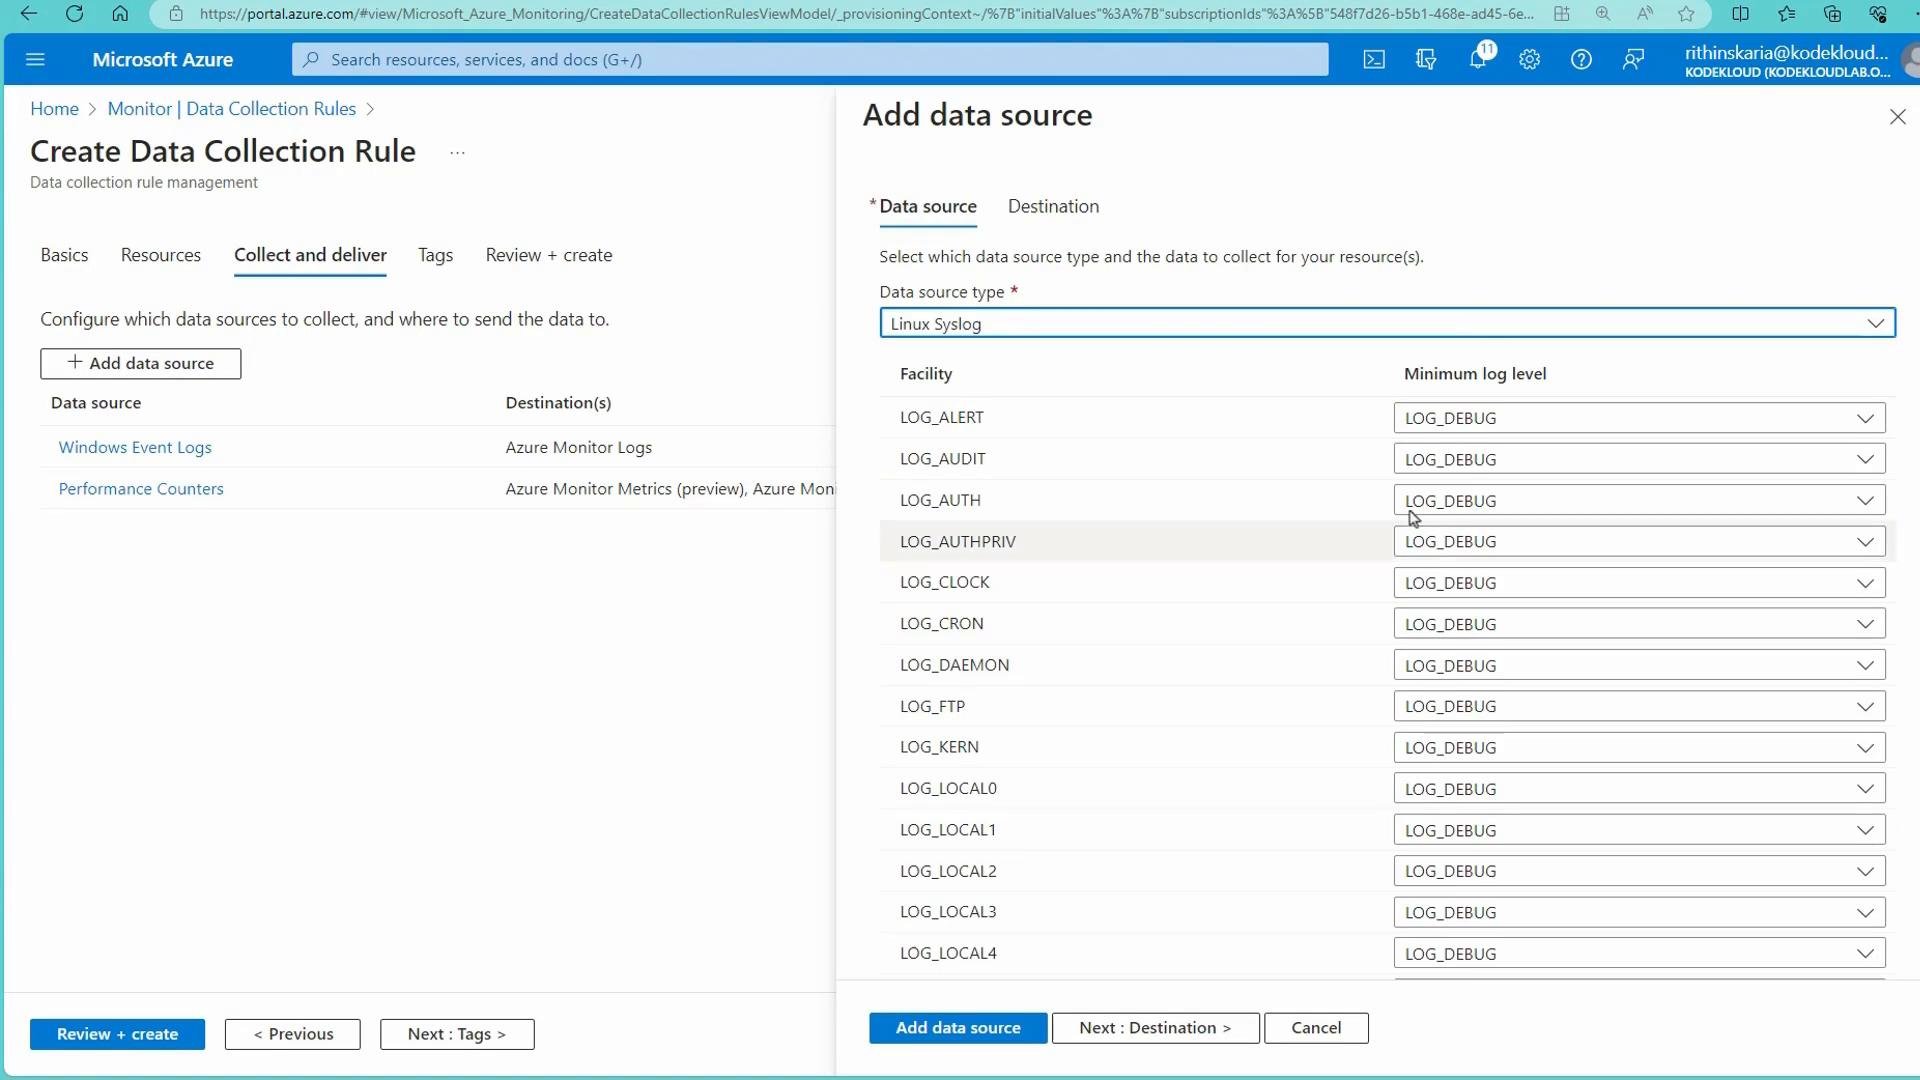
And the Syslog data source selection for Linux machines:
A Microsoft Azure portal screenshot of the "Create Data Collection Rule" workflow with the "Collect and deliver" tab open and an "Add data source" pane selecting "Linux Syslog." The pane lists syslog facilities and their "Minimum log level" dropdowns (all set to LOG_DEBUG), with buttons like "Add data source" and "Next: Destination" at the bottom.
A screenshot of the Microsoft Azure portal showing the "Create Data Collection Rule" workflow with the "Collect and deliver" tab open and an "Add data source" pane. The dialog lists data sources like Windows Event Logs and Performance Counters and destination settings (Azure Monitor Logs, subscription, and namespace).
After creating the DCR and applying it to VMs, AMA will be installed automatically. You can confirm installed extensions in each VM’s Extensions + applications blade. In the demo, the Linux VM lists AzureMonitorLinuxAgent alongside any legacy OMS extensions.
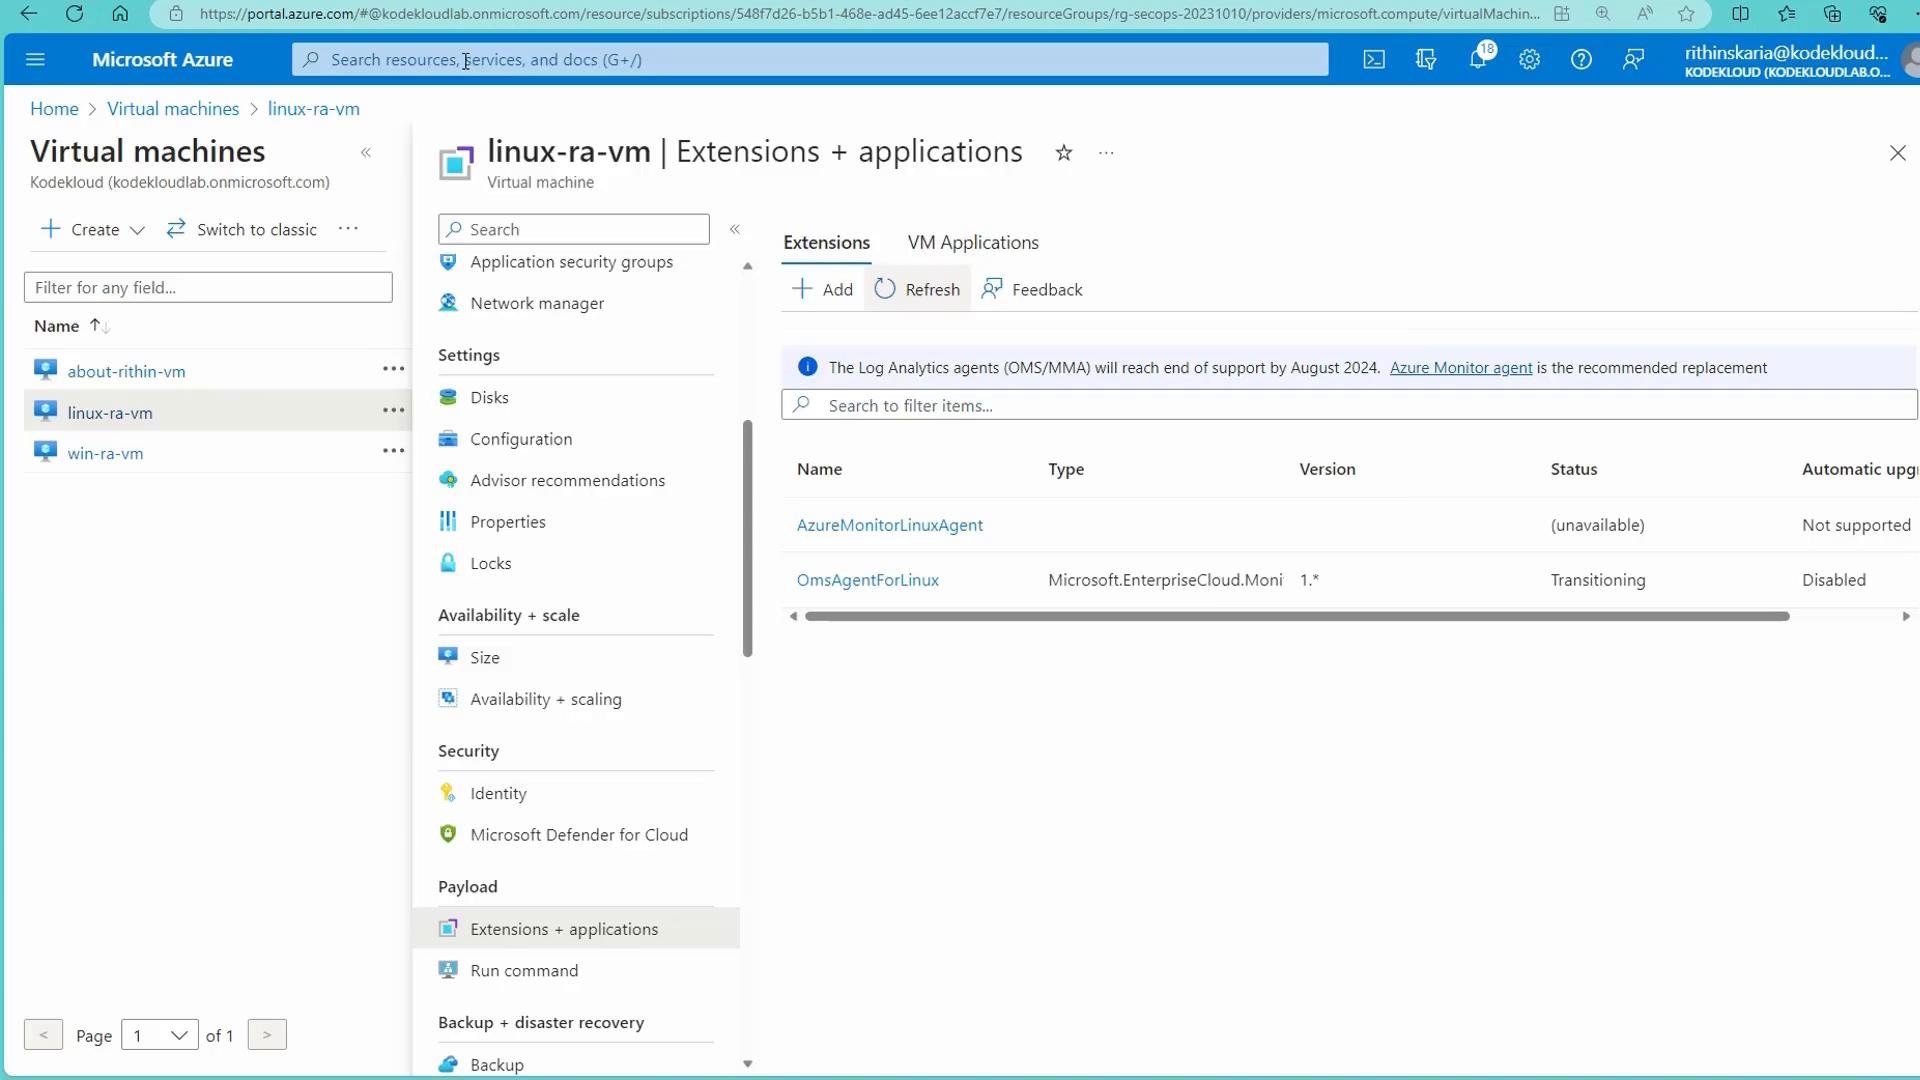
A Microsoft Azure portal screenshot showing the Virtual machines blade and the "linux-ra-vm" Extensions + applications page. It lists VM extensions like AzureMonitorLinuxAgent and OmsAgentForLinux and displays VM settings in the left menu.
Once the first AMA heartbeat arrives, the Agents page will show the machine reporting via the Azure Monitor Agent. After a short wait, both the Windows and Linux demo machines reported in with AMA.

Check which agent type is reporting

Use Heartbeat to see agent categories:
Example results for the demo:
  • win-ra-vm — Direct Agent (legacy/MMA)
  • win-ra-vm — Azure Monitor Agent (AMA)
  • linux-ra-vm — Azure Monitor Agent (AMA)
If both MMA and AMA are installed on the same machine, you will see heartbeats from both agents and both can send telemetry. This may double ingestion volume and increase costs. Uninstall or disable the legacy agent when you migrate to AMA.

Syslog and other tables

After enabling Syslog collection in a DCR, messages appear in the Syslog table. Example query showing recent syslog messages:

App Services and diagnostic settings (agent not required)

For Platform as a Service (PaaS) resources such as App Service (Web Apps), you cannot install an agent. Instead, configure Diagnostic settings to send logs and metrics to a Log Analytics workspace. For an App Service:
  • Open the App Service in the portal.
  • Go to Diagnostic settings and create a diagnostic setting.
  • Select categories and metrics (HTTP logs, application logs, metrics).
  • Send logs to your Log Analytics workspace.
In the demo, App Service HTTP logs landed in a dedicated table named AppServiceHTTPLogs. Visiting the web app (an HTTP GET) produced an entry in that table. Query example for App Service HTTP logs:
If a diagnostic category has no dedicated table it will be sent to AzureDiagnostics. Filter results by ResourceId when querying AzureDiagnostics.

Final recommendations

  • Use AMA and Data Collection Rules for all new environments. They support modern OS versions and flexible collection scopes.
  • Use Azure Arc to manage and onboard on-premises or multi-cloud servers to AMA.
  • Avoid new deployments with MMA; it is deprecated and will reach end of support.
  • Monitor ingestion and costs: if you see duplicate telemetry, verify both MMA and AMA are not installed simultaneously.
  • Use the Heartbeat, Perf, Event, Syslog, and resource-specific tables (e.g., AppServiceHTTPLogs) to build targeted queries for monitoring and troubleshooting.
That covers how data is ingested into a Log Analytics workspace, how tables are mapped to telemetry types, onboarding options (MMA vs AMA + DCRs), and basic KQL queries to explore the telemetry.

Watch Video