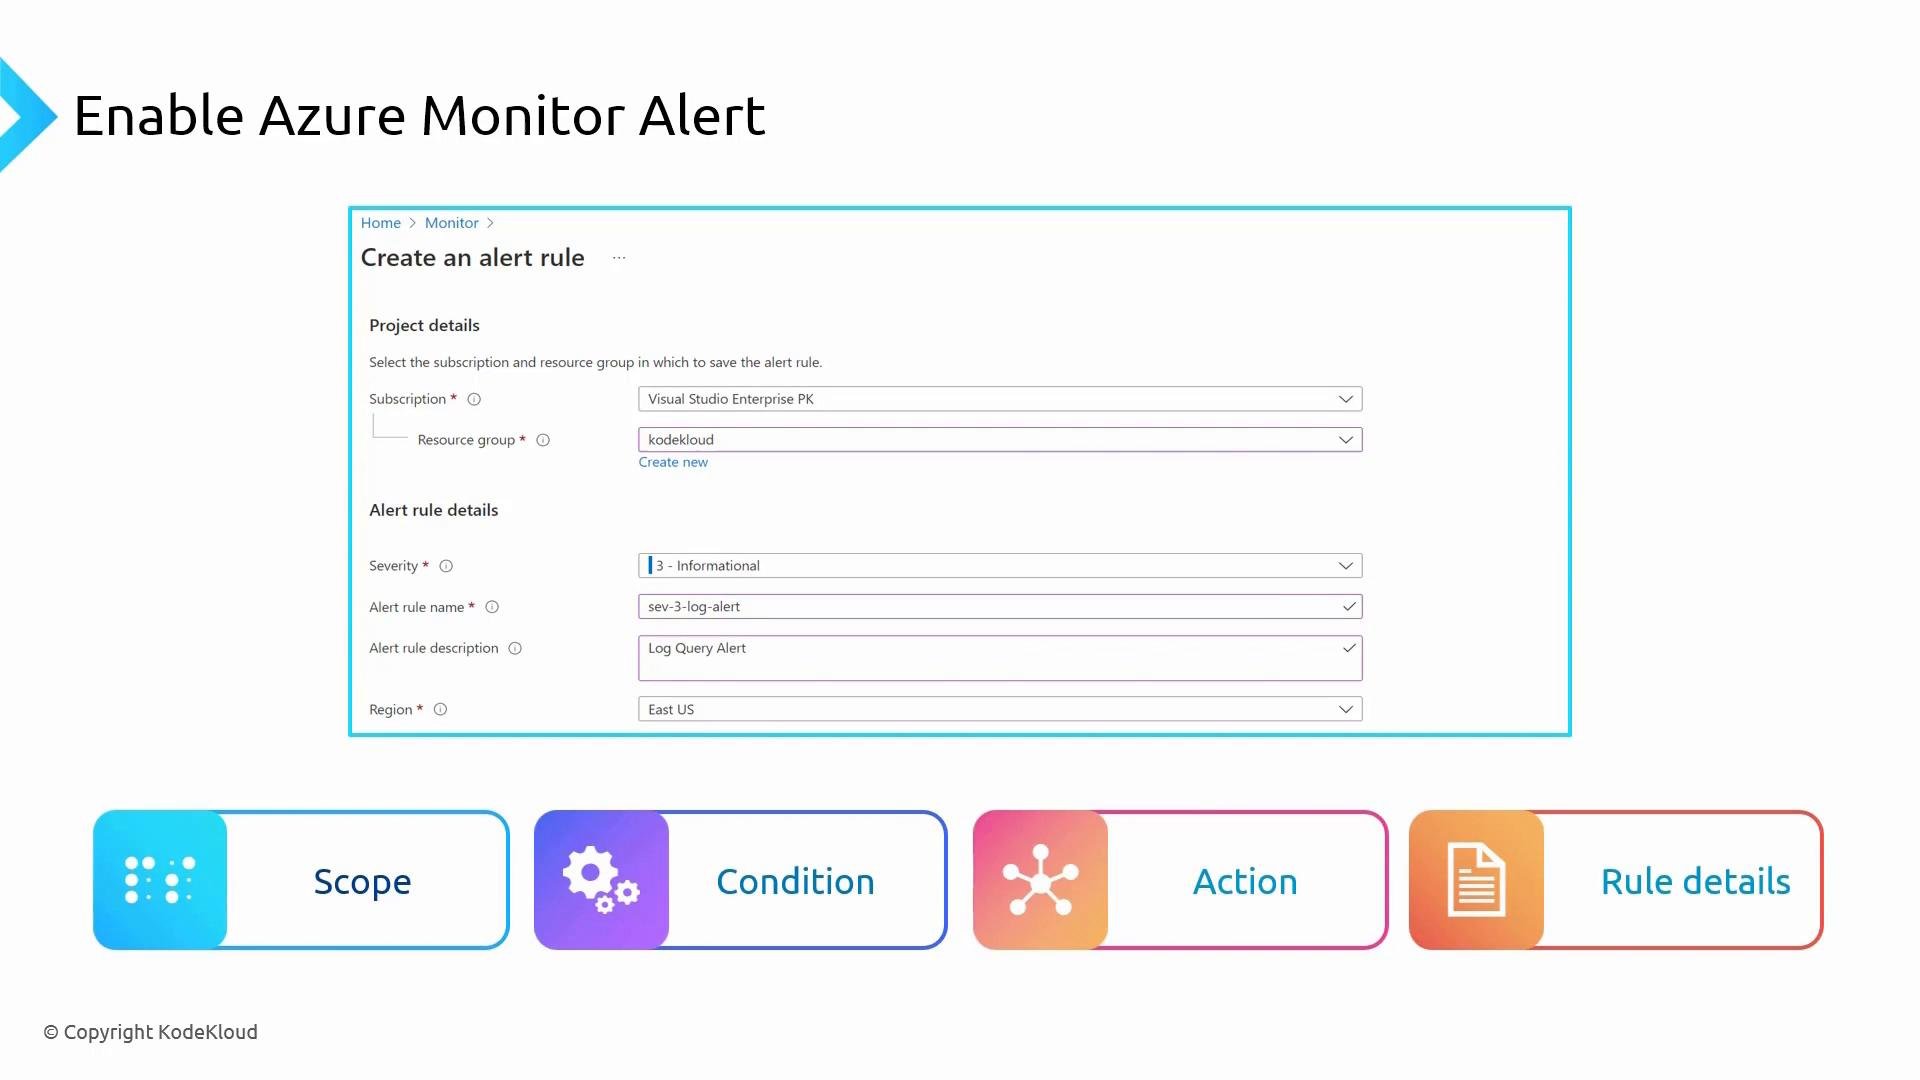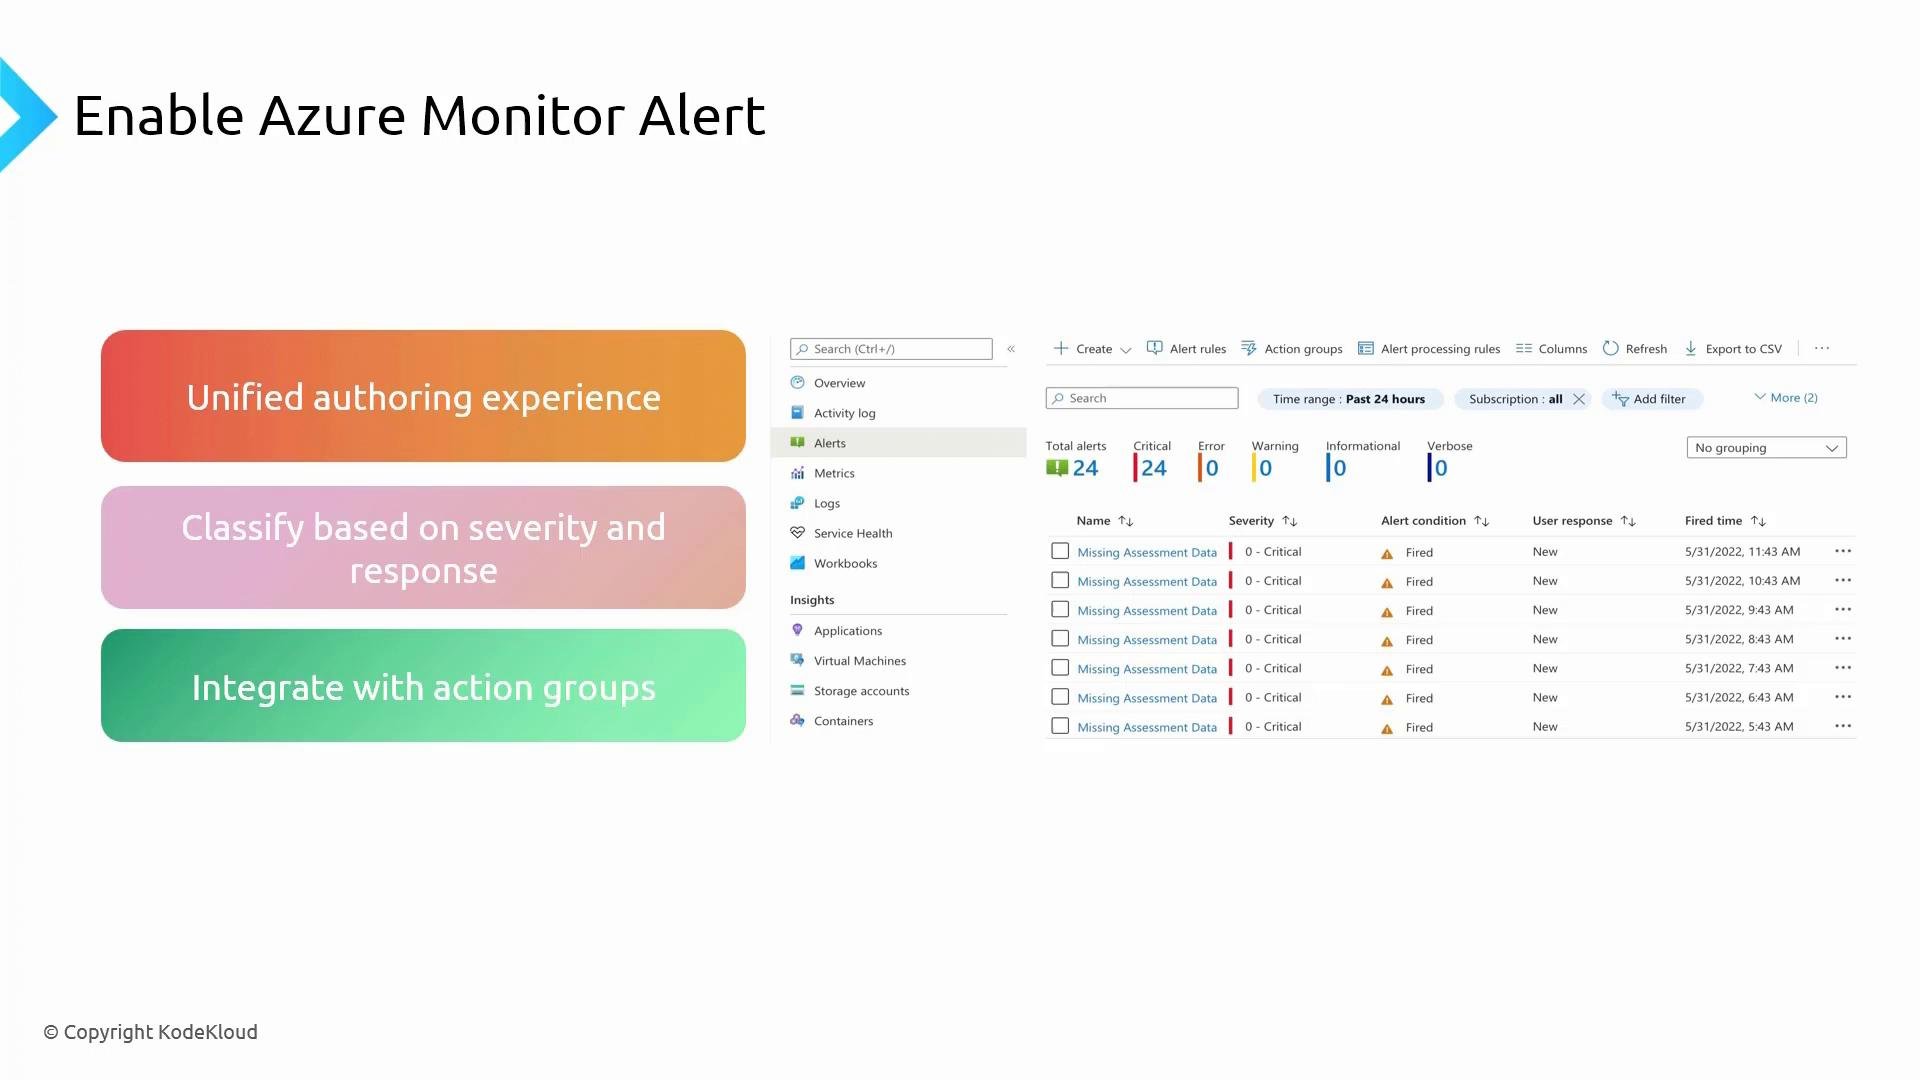
Alert rule authoring: 4 main stages
When authoring an alert rule there are four main stages to follow. These apply whether you create rules for metrics, logs, or activity log events: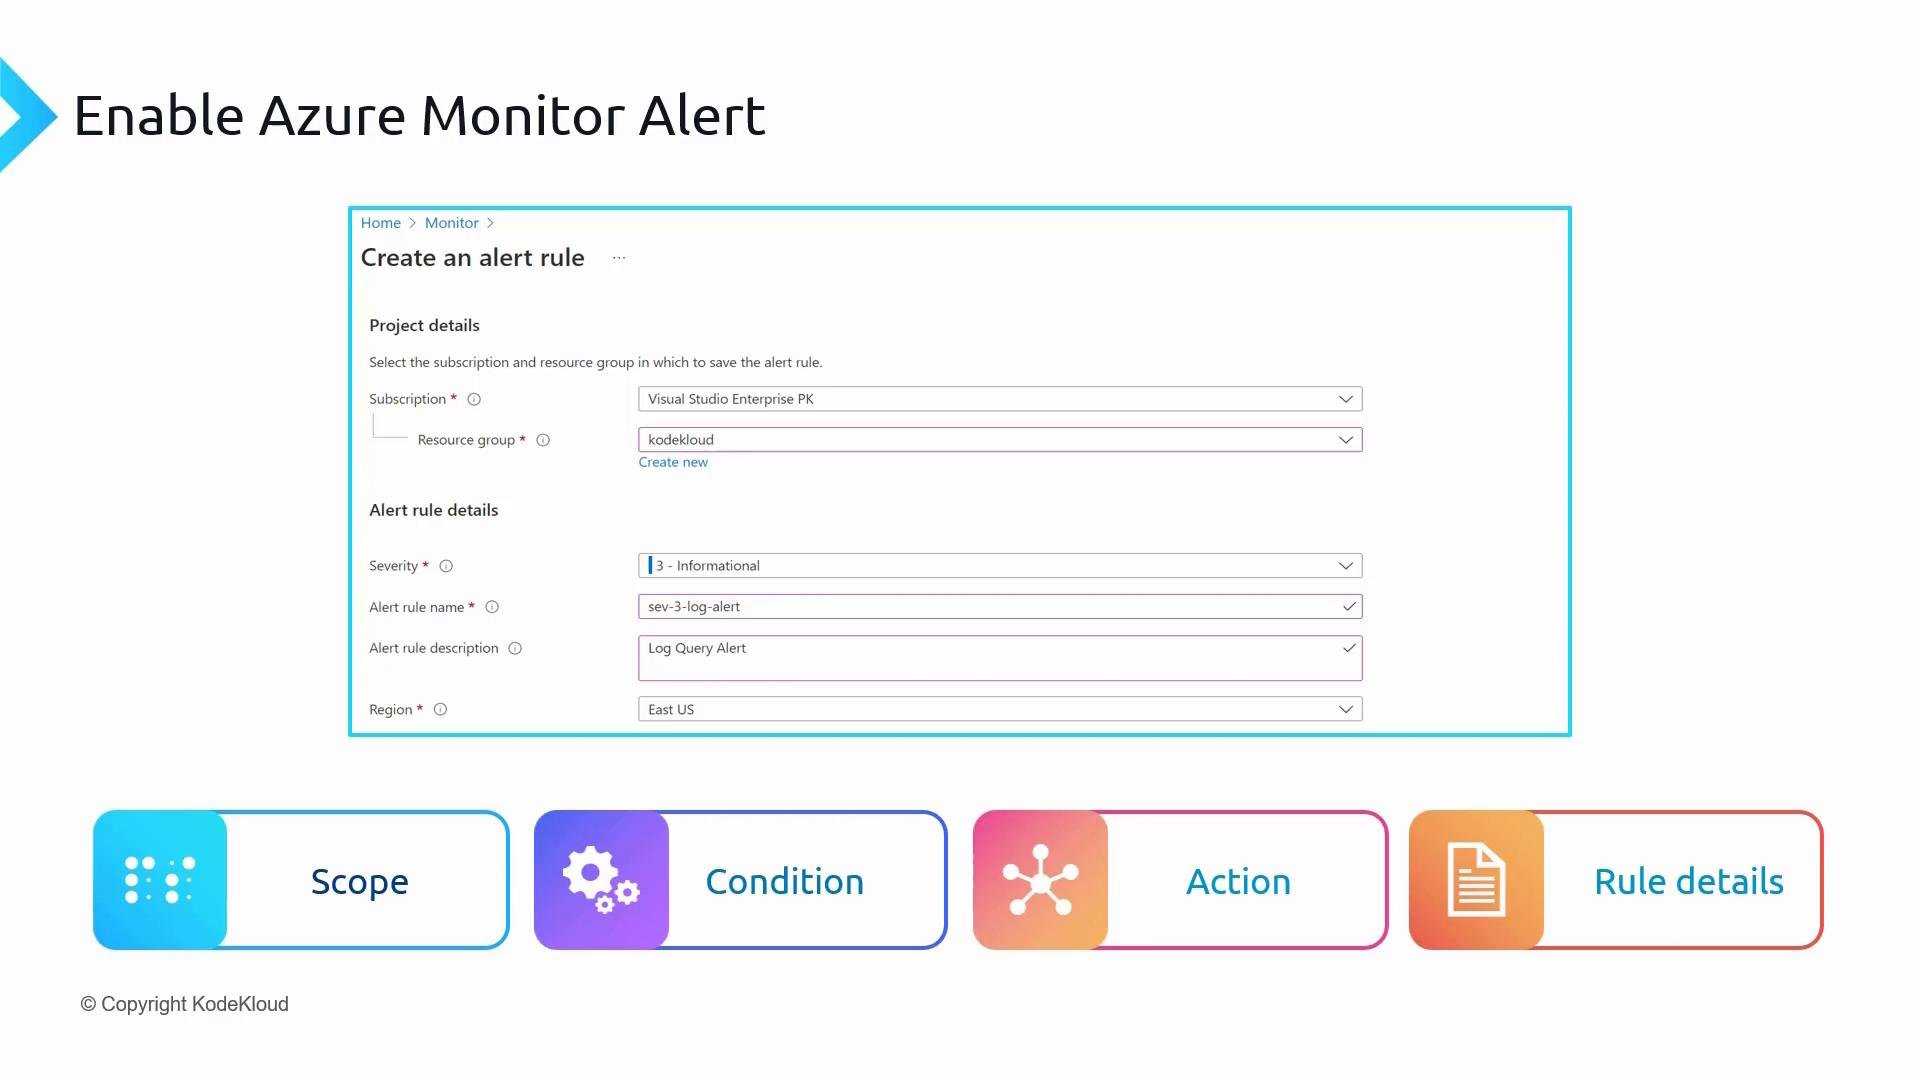
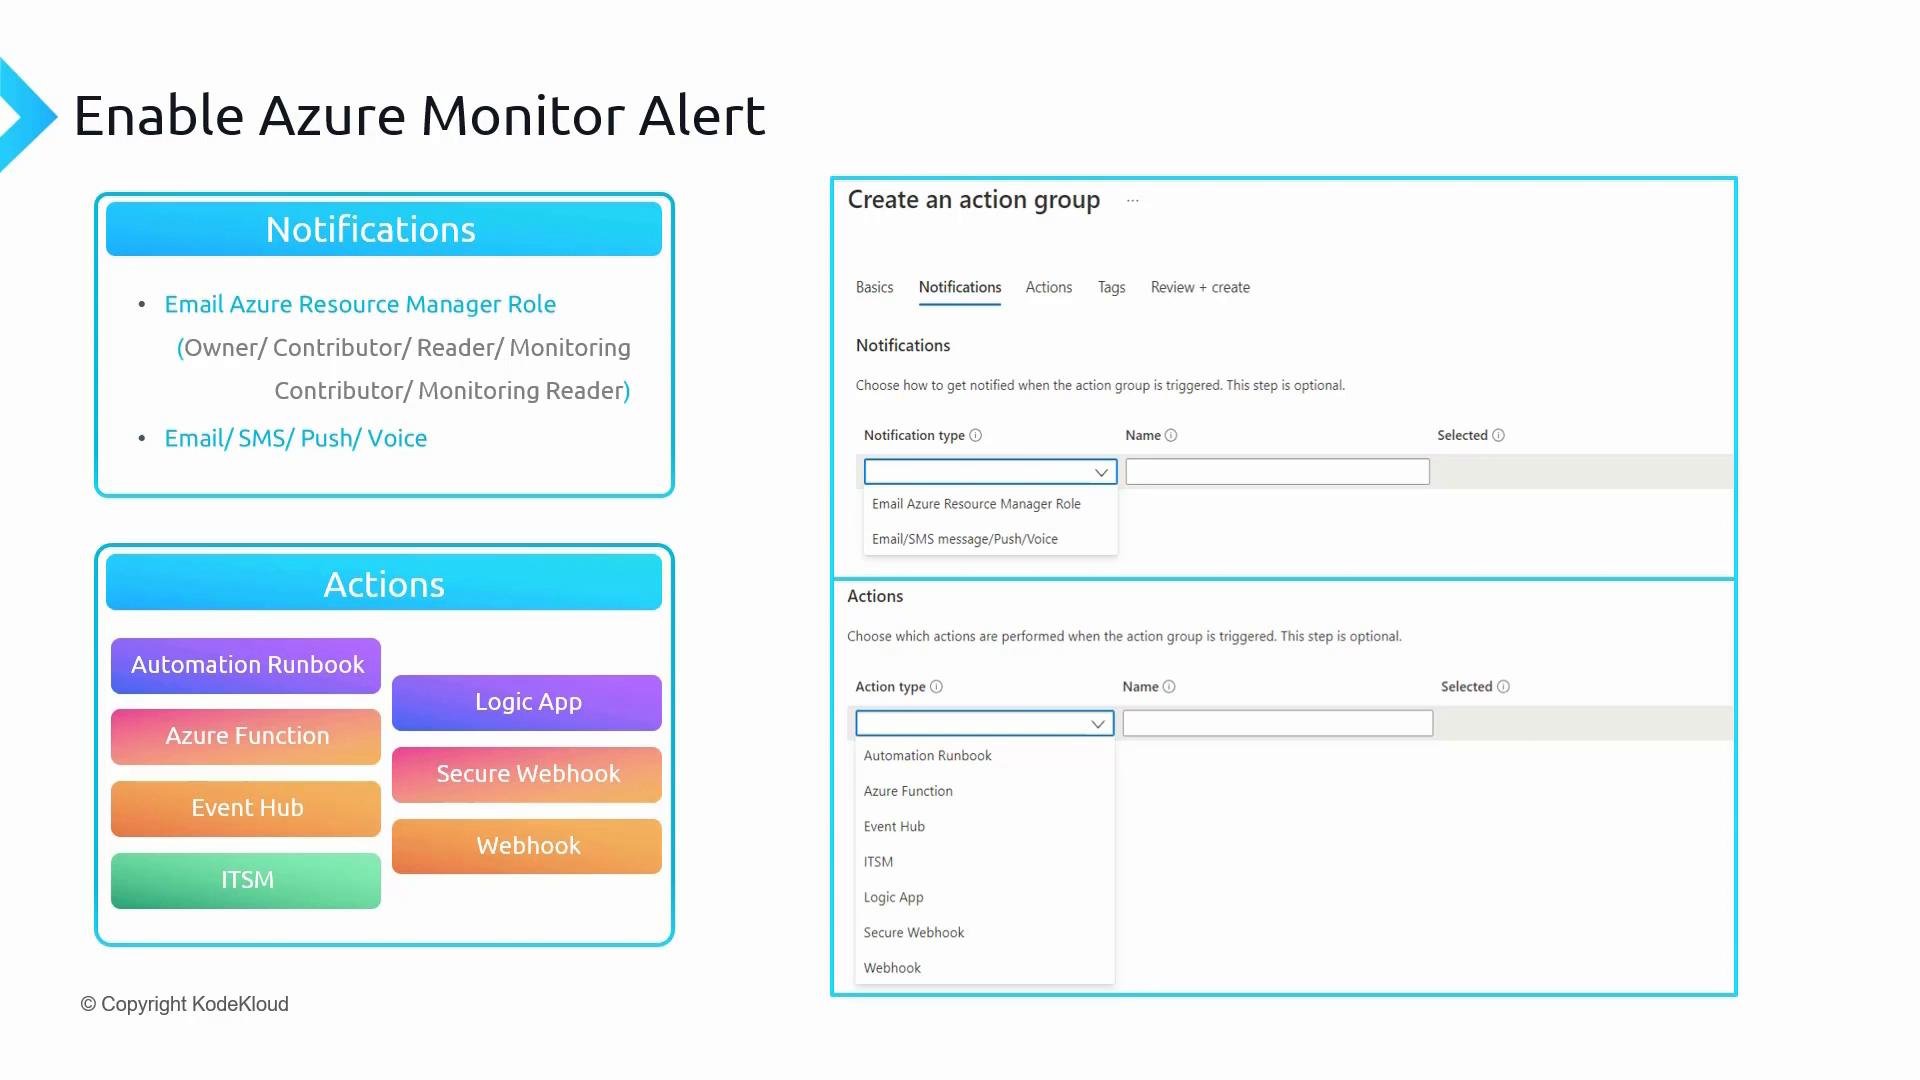
Action Groups: notifications and automation
Action Groups let you configure two types of actions:- Notification preferences — email, SMS, push notification, voice calls, or integrations (ITSM, webhooks, connectors).
- Automation preferences — Automation Runbook, Azure Function, Event Hub, ITSM, Logic App, secure webhook, or standard webhook.
Demo: Create an alert rule from Log Analytics
You can create alert rules directly from a Log Analytics query. Example: count App Service HTTP logs in the last 25 minutes.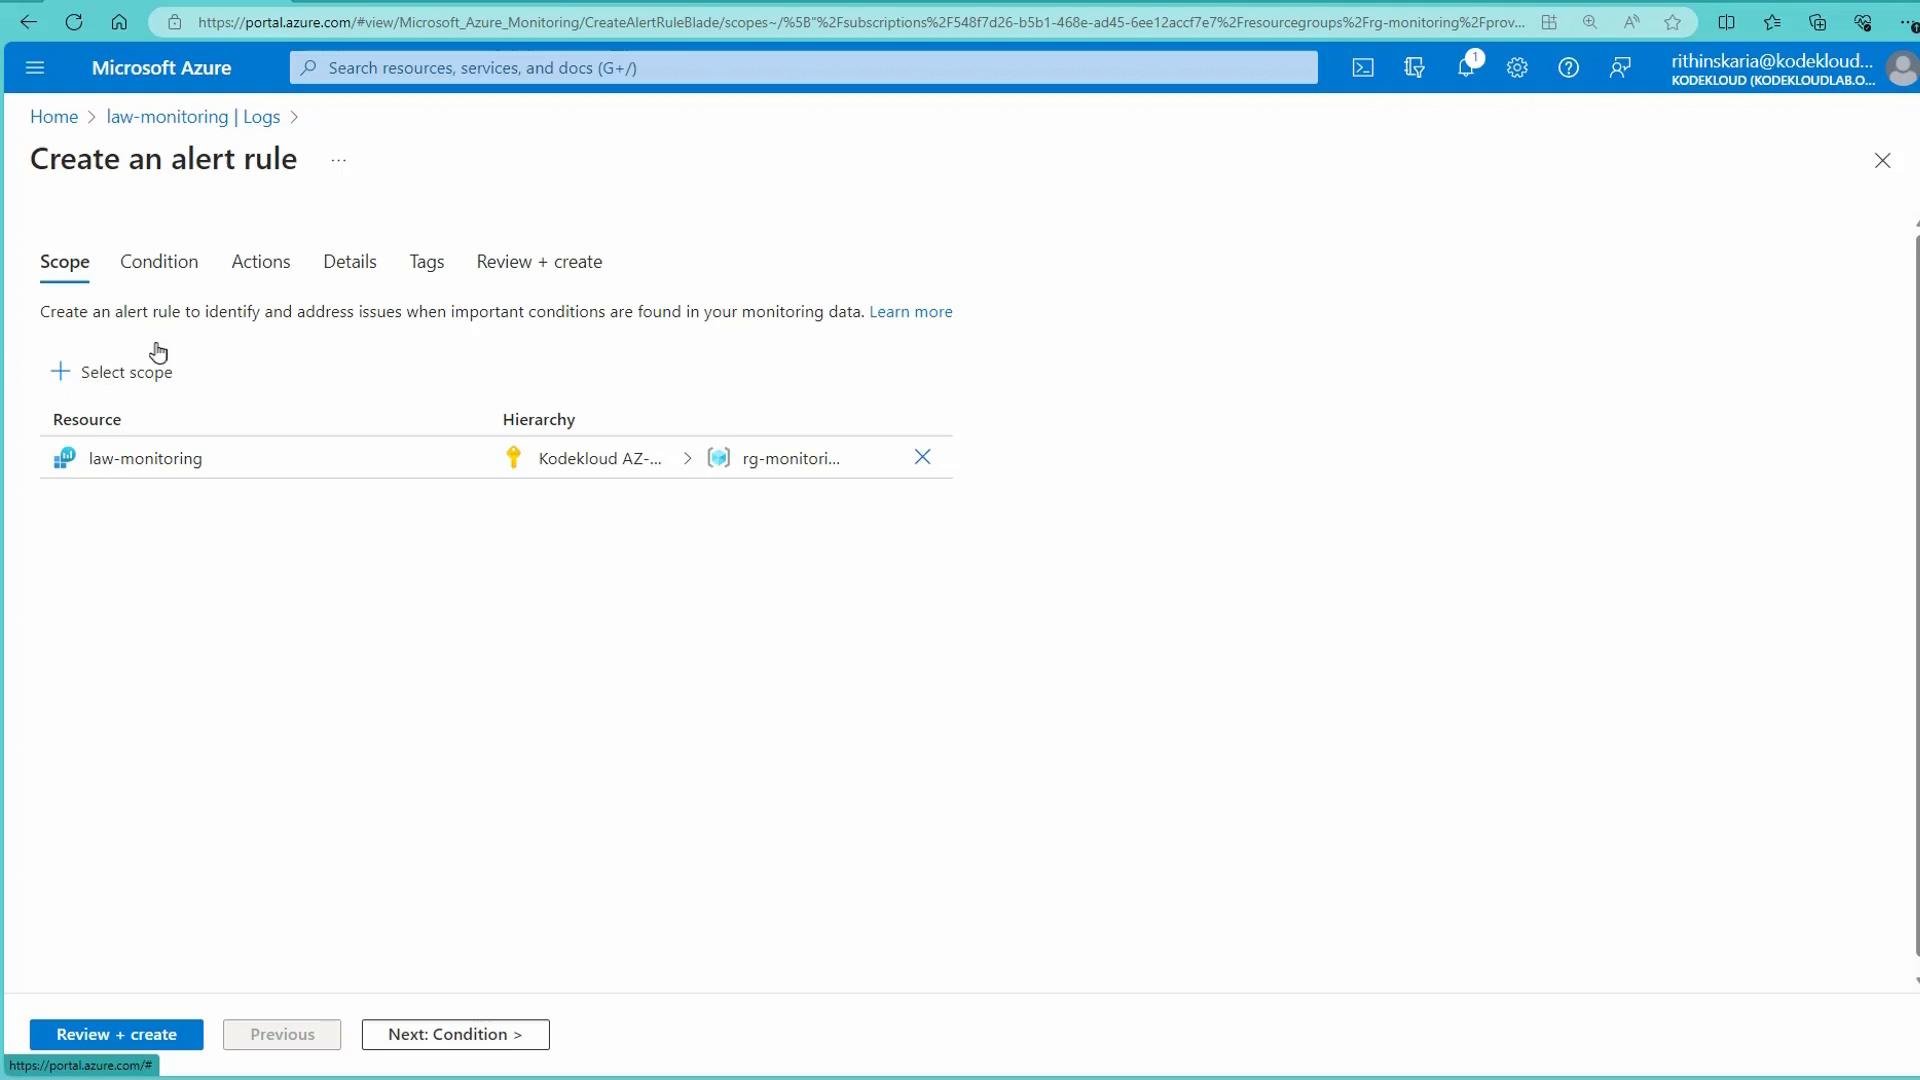
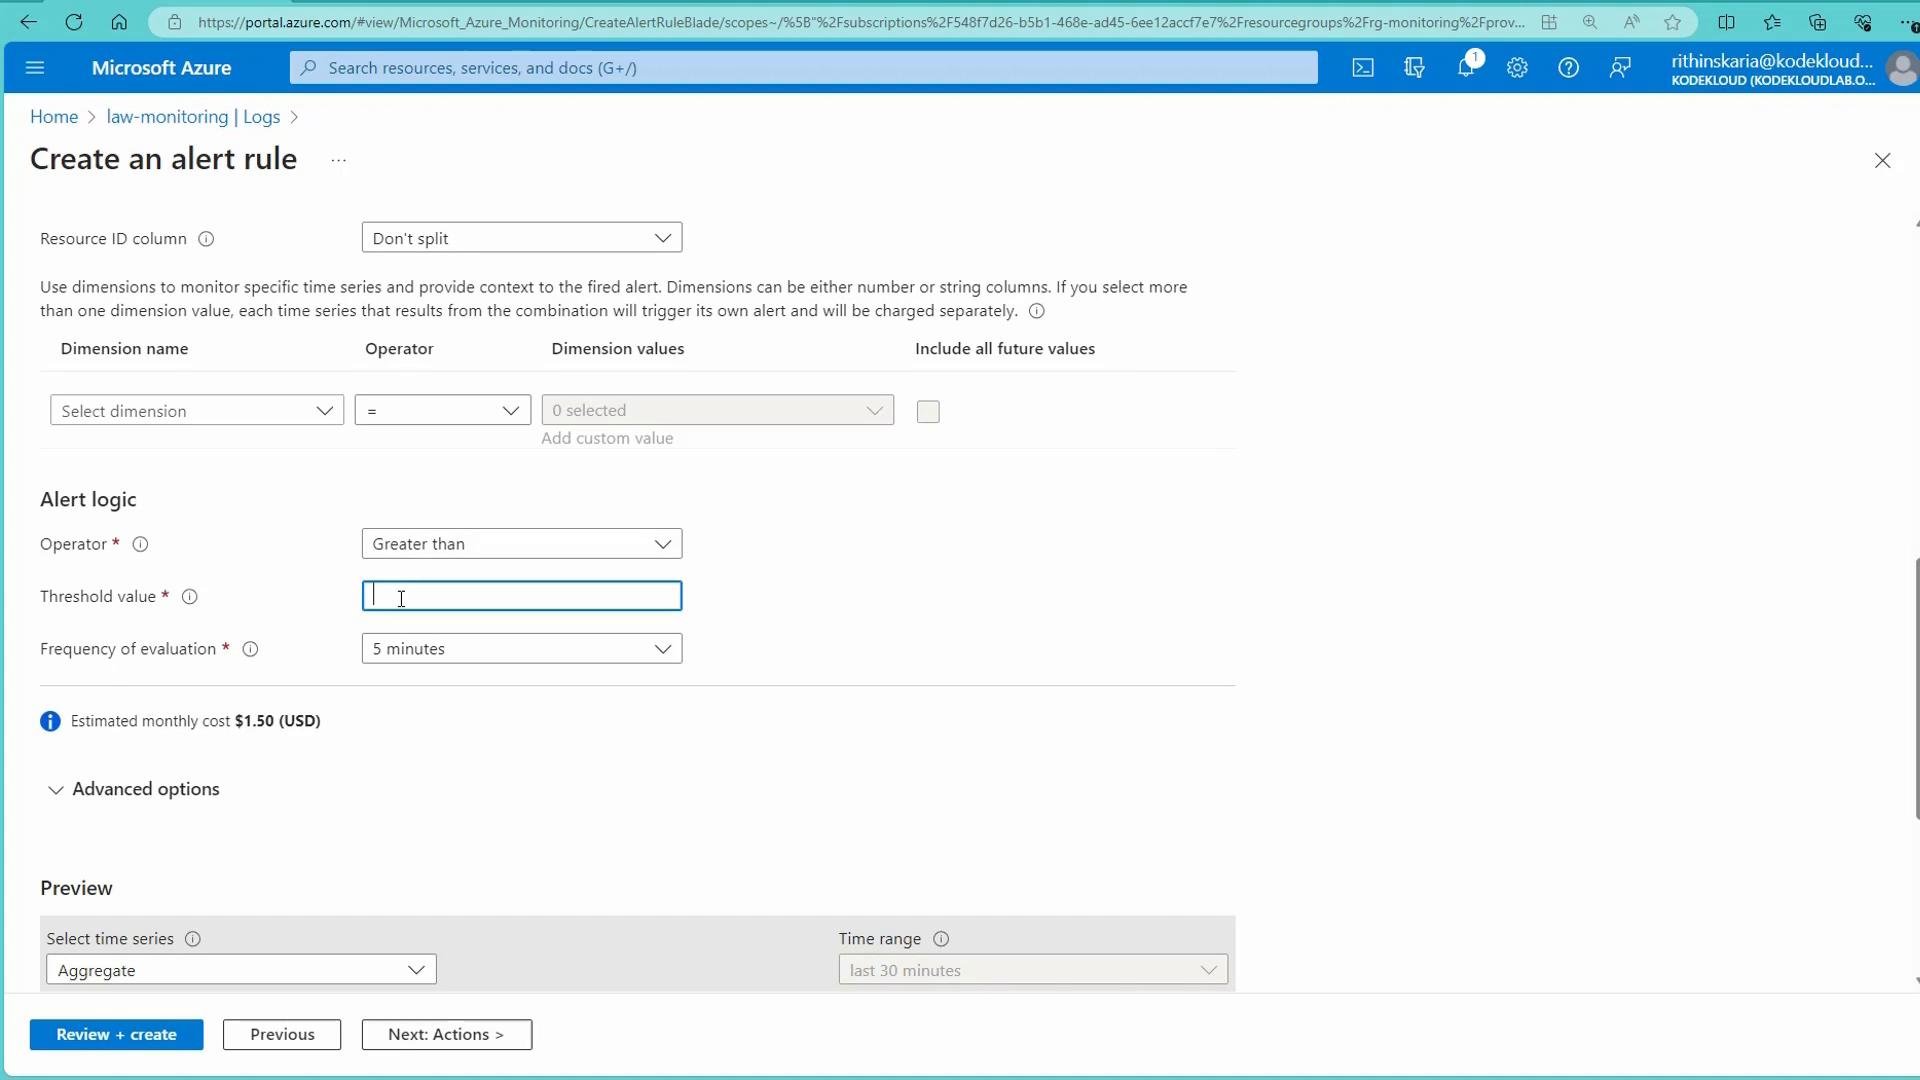
- Operator, threshold, and evaluation frequency (how often Azure evaluates the rule).
- Aggregation type (Average, Min, Max, Total, Count).
- Lookback window (how much historical data is evaluated).
Activity Log alerts
You can also create alerts for Activity Log events. These are useful for tracking control-plane operations such as creating or deleting resources. For example, author an alert to trigger when a specific operation like “Create Web App” or “Delete database” occurs.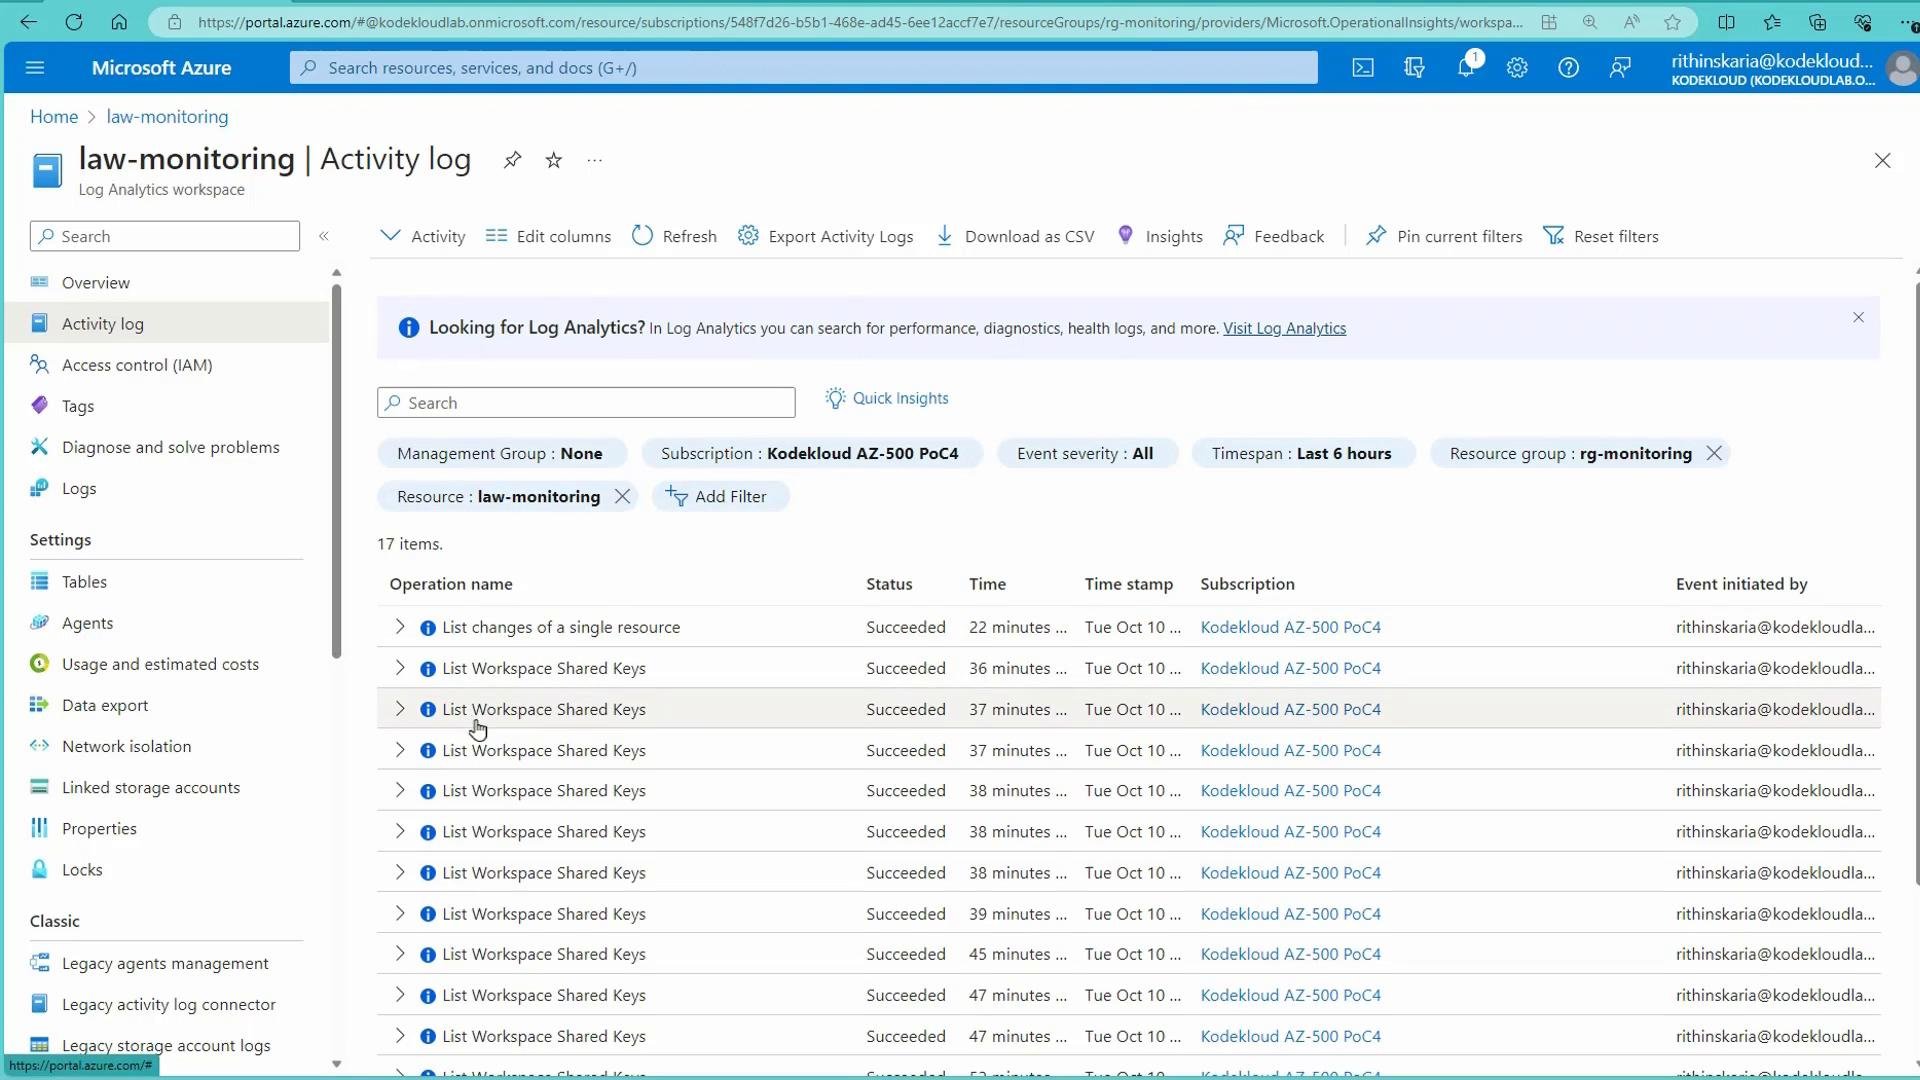
Demo: Create a VM CPU alert (recommended for production servers)
Follow these steps to create a CPU alert for a Virtual Machine:- In the Azure portal, open the Virtual Machine and navigate to the Alerts blade. Choose “Create a custom alert rule”.
- Scope: select one or more VMs to monitor.
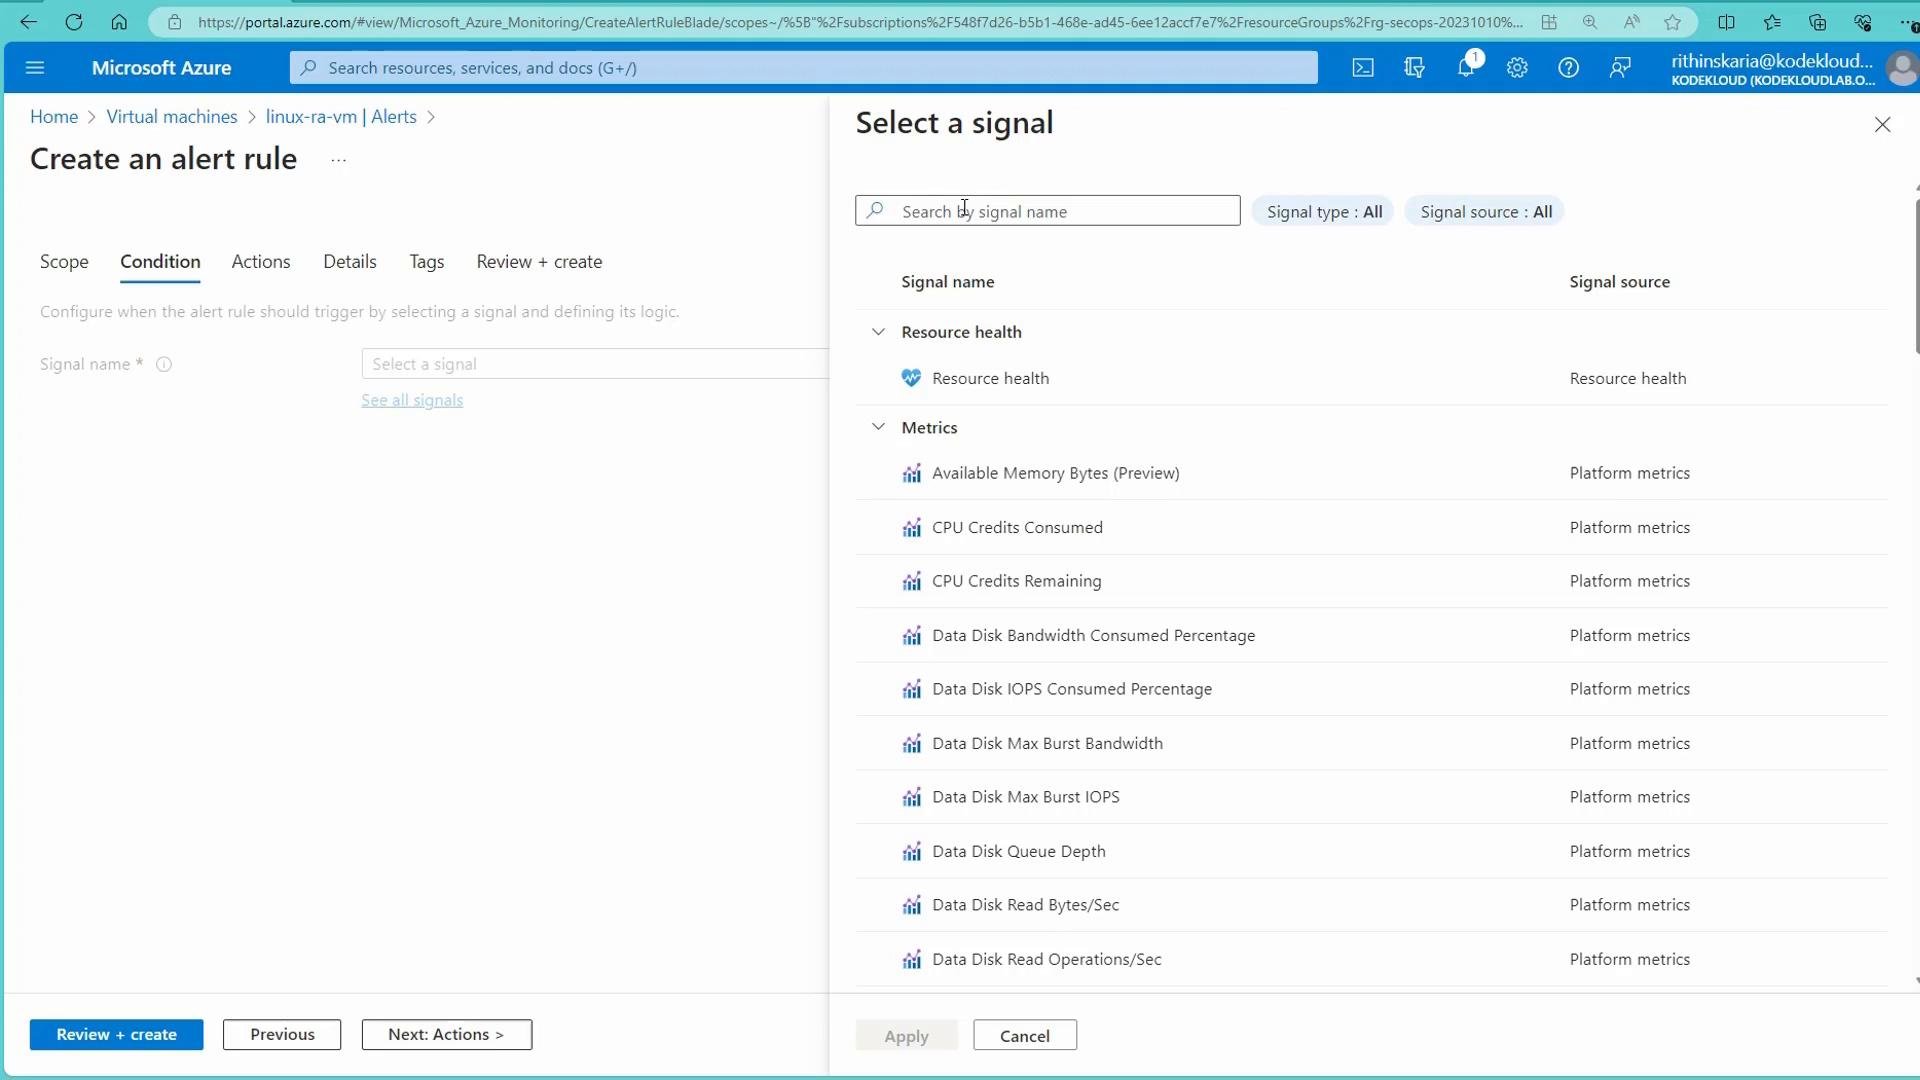
- Condition: choose a signal — for VM monitoring select a platform metric such as
Percentage CPU.
- Threshold type: choose Static or Dynamic.
- Static evaluates the metric against a fixed threshold (e.g., Average CPU > 80%).
- Dynamic learns historical behavior and alerts on anomalies to reduce noise from expected spikes.
Use dynamic thresholds to reduce noisy alerts for workloads with variable usage patterns. Use static thresholds when you have a clear SLA or capacity limit to enforce.
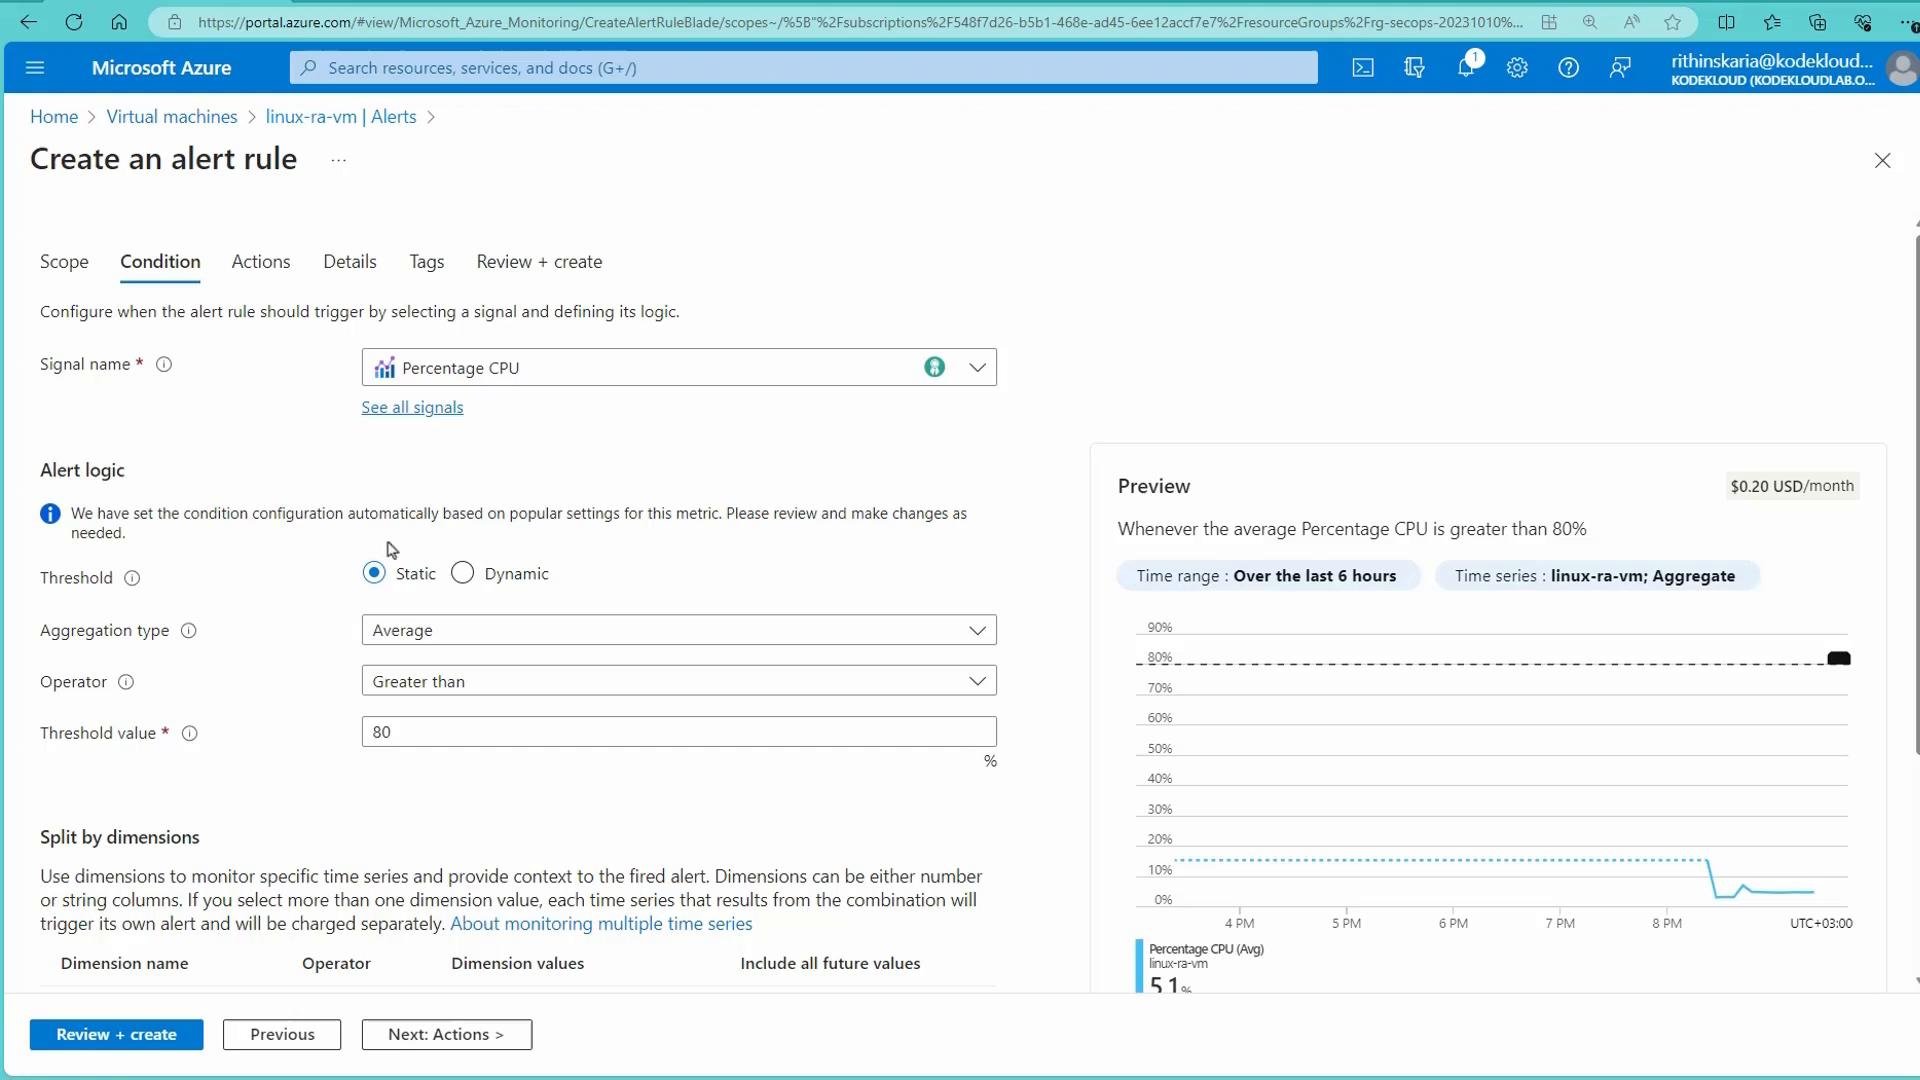
- Actions: create or select an Action Group. Provide a name (for example, “VM notification”) and add at least one notification type (email, SMS, push, voice) or automation action (Runbook, Function, Logic App, webhook, ITSM).
- Details: set the alert rule name (e.g., “CPU alert for Windows and Linux”), severity (Critical), and whether the rule is enabled on creation.
SSH to the Linux VM and generate load
Connect to the VM via SSH:htop or top to observe near-100% CPU on vCPUs while stress runs. Example htop output shows the stress processes consuming CPU:
Monitor the VM metrics in the Azure portal
In the portal go to Monitoring > Metrics and select CPU (Average). The spike created by the stress process will be visible; Azure evaluates the configured lookback (5 minutes in this example) and aggregation (Average) to determine whether the rule condition is met.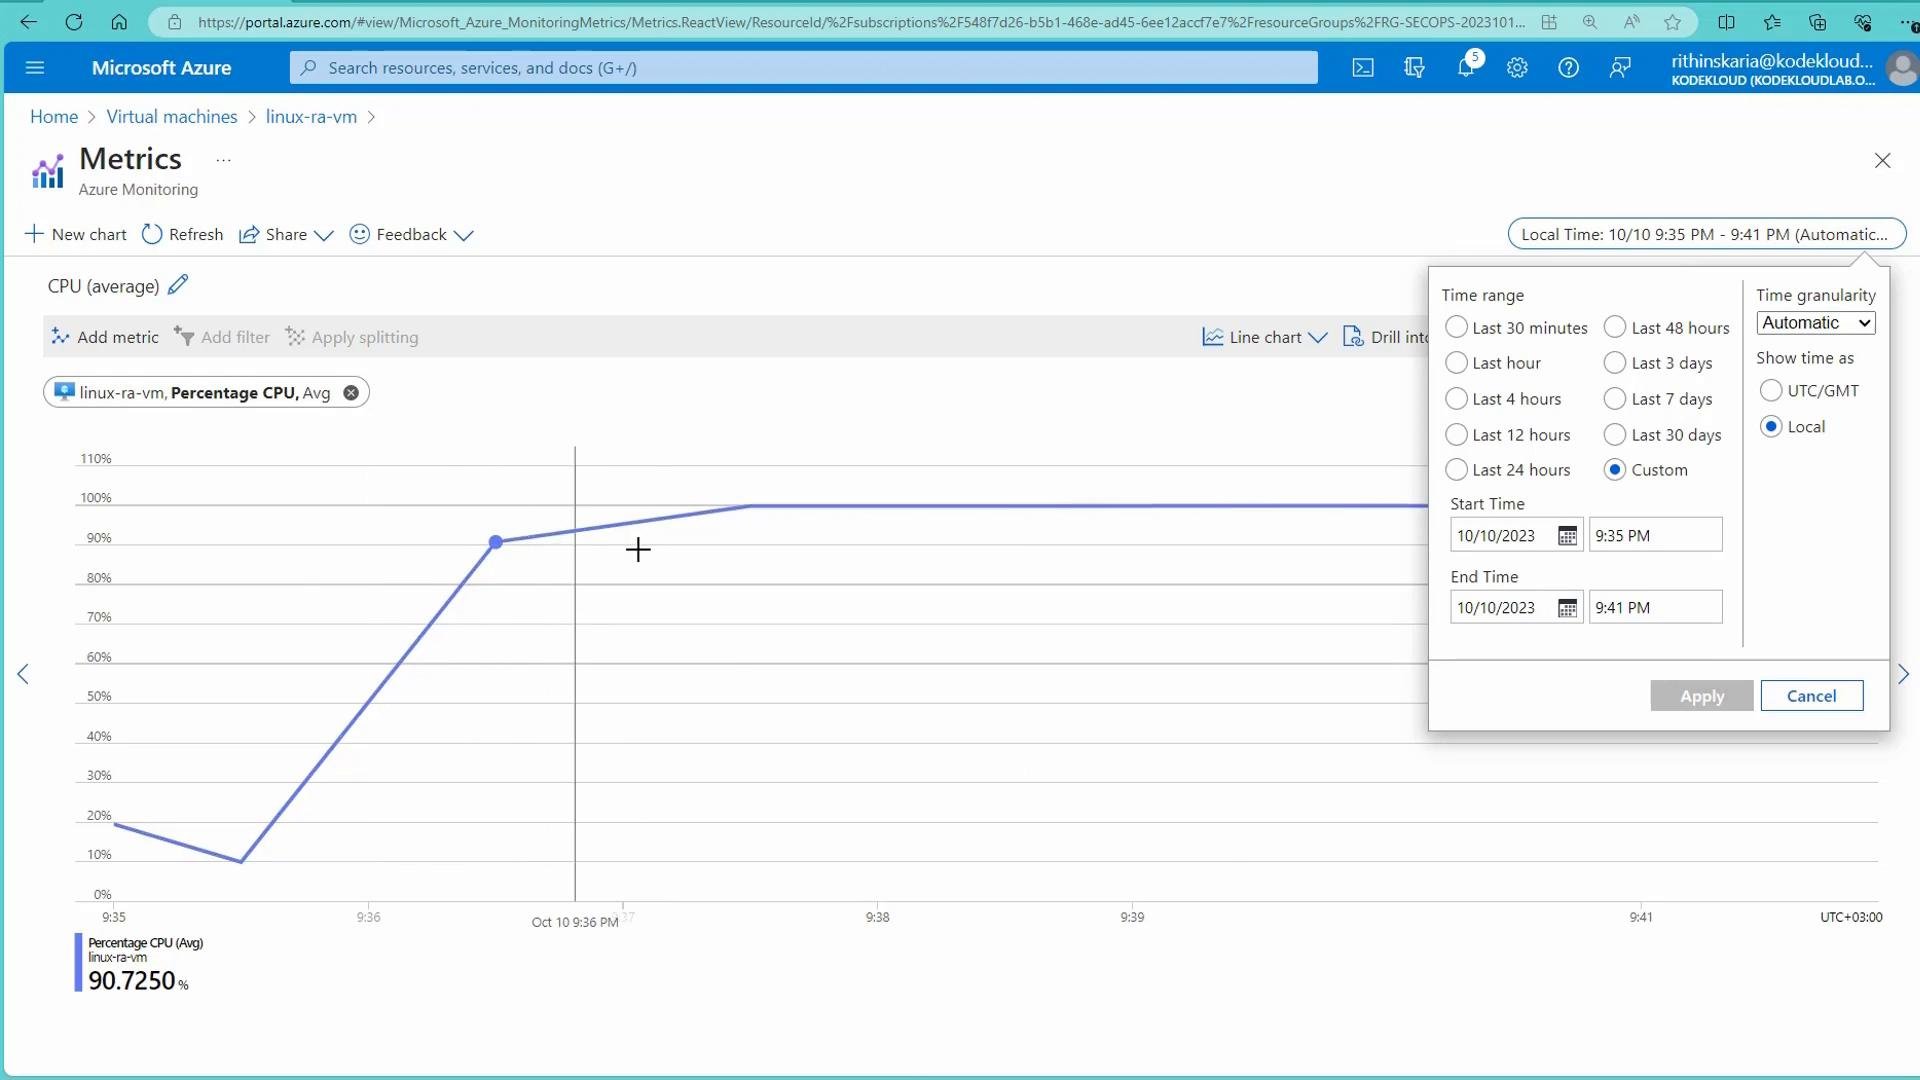
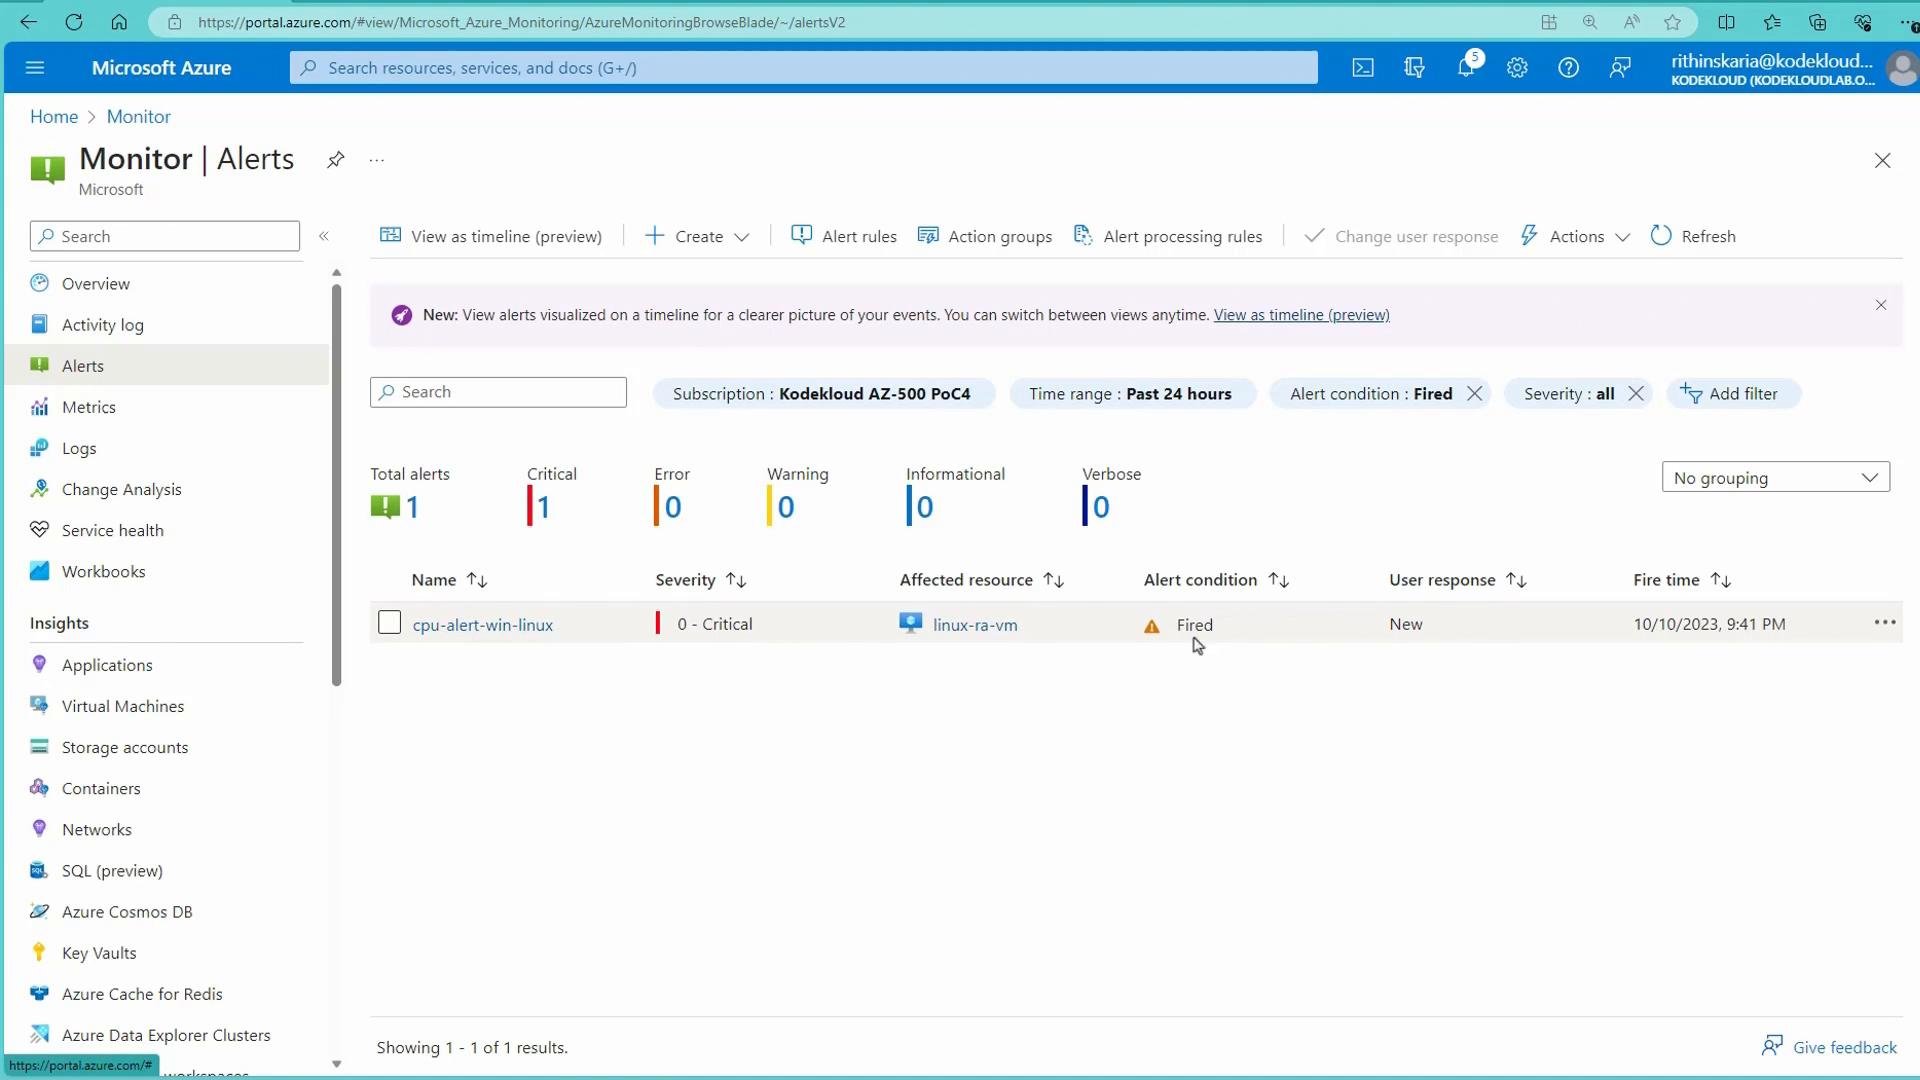
Acknowledge and close alerts
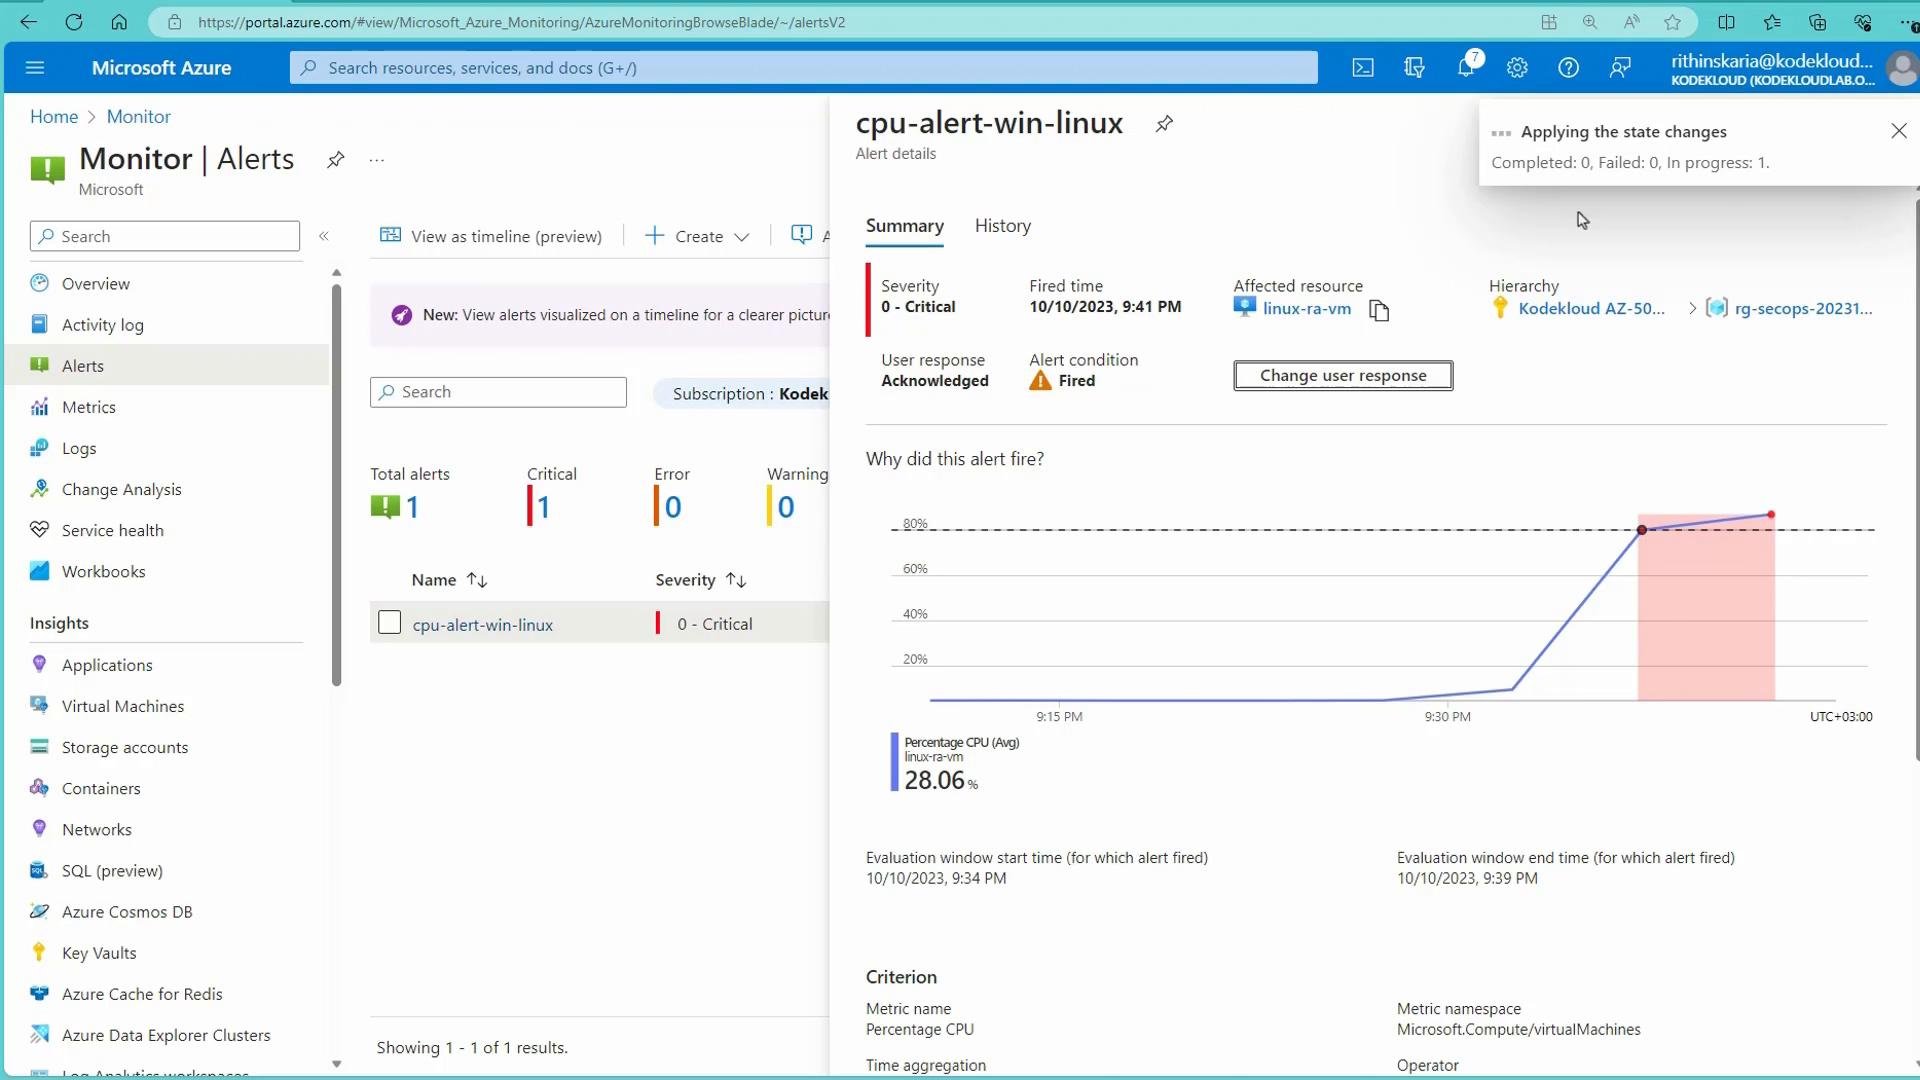
On the Alerts page you can set the user response to communicate the incident lifecycle to your team. Typical states:- New — newly fired alert awaiting triage.
- Acknowledged — someone is investigating or working on remediation.
- Closed — issue resolved and alert closed.
Summary
Use Azure Monitor Alerts to:- Author alert rules consistently across metrics, logs, and activity logs.
- Classify alerts by severity and track user response (New, Acknowledged, Closed).
- Route notifications and automate responses via Action Groups (email, SMS, push, voice, Runbooks, Functions, Logic Apps, ITSM, webhooks).
- Choose static or dynamic thresholds depending on workload characteristics and noise tolerance.