

-
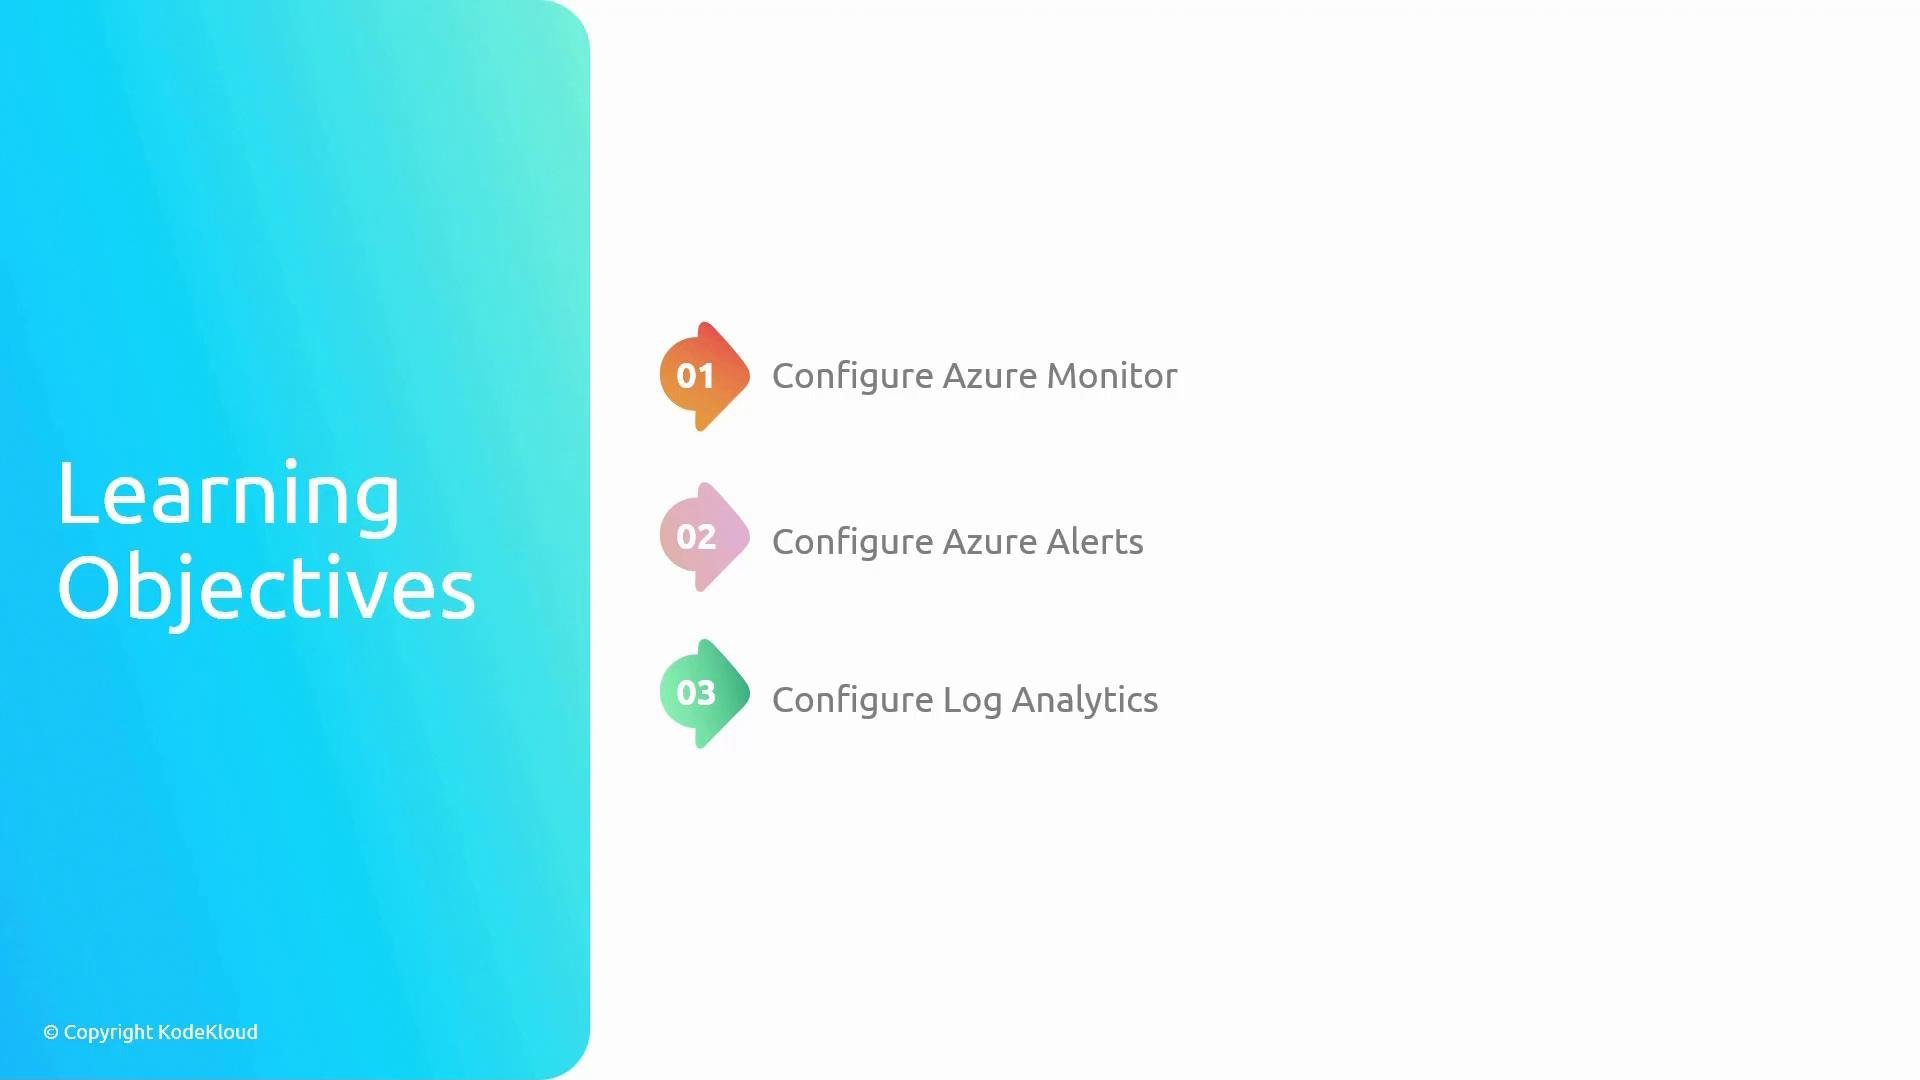
Configure Azure Monitor
Set up Azure Monitor to collect, correlate, and analyze telemetry — metrics, logs, and traces — from Azure resources as well as on-premises or multi-cloud environments. Use agents and diagnostic settings to capture relevant data. Azure Monitor delivers insights into application and infrastructure performance, availability, and health, and integrates with services such as Application Insights and Autoscale. -
Configure Azure alerts
Create and manage alerts based on metric and log signals from Azure Monitor. Alerts notify stakeholders of critical conditions and can trigger automated actions through Action Groups (email, SMS, ITSM, webhooks) or call remediation workflows such as runbooks, Logic Apps, or Azure Functions. -
Configure Log Analytics
Provision and manage Log Analytics workspaces to store and query telemetry collected by Azure Monitor. Use the Kusto Query Language (KQL) to build queries that aggregate, filter, and correlate log data for troubleshooting, visualization, and alerting.
Tip: Start by defining the signals you need (metrics, logs, traces), then map them to the appropriate Log Analytics workspace and alerting strategy. Using Application Insights for application telemetry and Log Analytics for infrastructure logs is a common pattern.
Warning: Be mindful of data ingestion and retention settings in Log Analytics — they affect cost and query performance. Review retention policies and sampling options to balance visibility and budget.
At-a-glance: What each objective delivers
Links and references
- Azure Monitor overview
- Diagnostic settings for Azure resources
- Application Insights
- Azure Monitor alerts and action groups
- Log Analytics workspace overview
- Kusto Query Language (KQL)