

Identifying Containers in Pods
Understanding the container composition within each pod is a critical first step.Red Pod
Begin by inspecting the red pod to determine the total number of containers. In the cluster, observe that the “READY” column displays the number of containers versus those that are ready. In this example, there are three containers. You can verify this by running the command:Blue Pod
For the blue pod, inspect the container details similarly. This pod includes two containers, “teal” and “navy”. The command below confirms their configuration:Creating a Multi-Container Pod
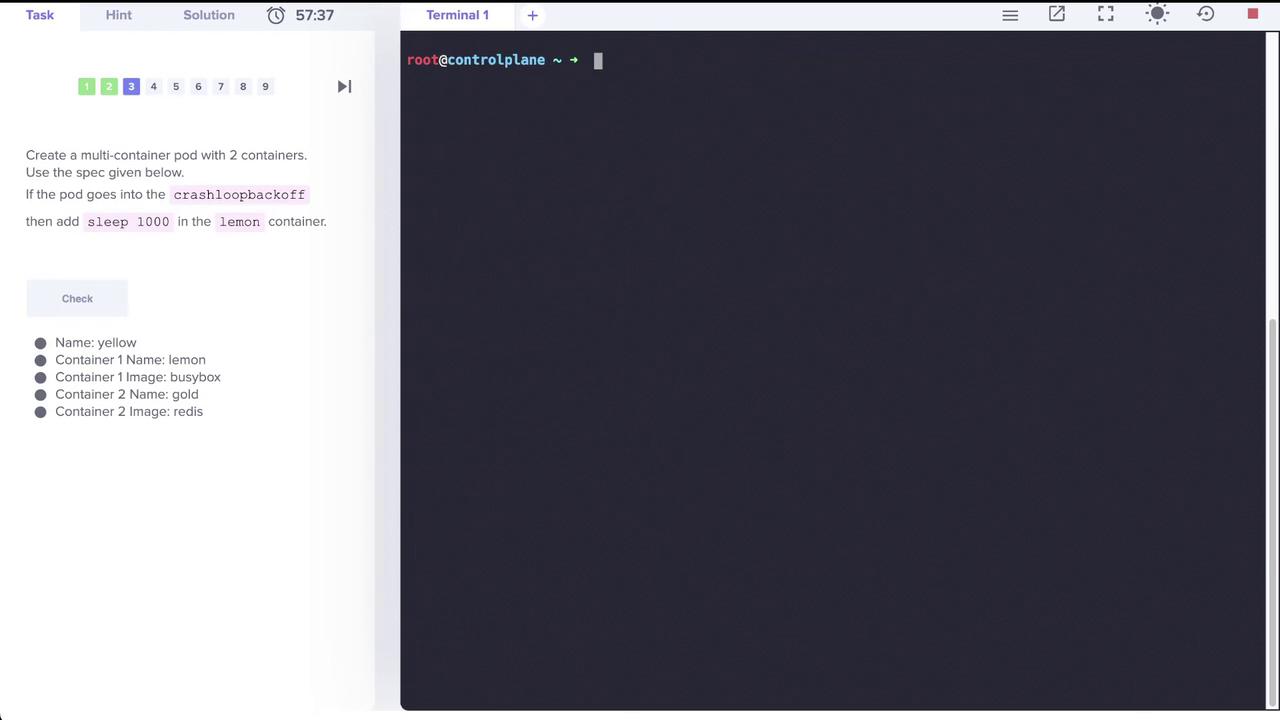
The next task involves creating a multi-container pod with two containers that conform to the following specifications:- Pod Name: yellow
- Container 1:
- Uses the BusyBox image
- Renamed to lemon (instead of inheriting the pod name)
- Optionally runs the command
sleep 1000
- Container 2:
- Uses the Redis image
- Named gold
Generating the Pod Manifest
First, generate a YAML manifest for a pod with a single container using a dry-run command:Editing the Manifest
Modify the YAML file to change the first container’s name from yellow to lemon, add the sleep command, and include a second container named gold with the Redis image:After deploying the pod, use
kubectl get pods and kubectl describe pod yellow to ensure that both containers are correctly configured and running.Setting Up a Simple Logging Application
Next, we will set up a logging application within the elastic-stack namespace. This setup is composed of the following components:- Application Pod (app): Simulates events and outputs logs.
- Elasticsearch Pod: Stores logs.
- Kibana Pod: Visualizes the logs.
elastic-stack namespace:
Inspecting the Application Pod
Review the details of the application pod to determine where logs are stored. The pod uses thekodekloud/event-simulator image, and its logs are written to a file (for example, /log/app.log). To inspect the pod, run:
Adding a Sidecar Container for Log Shipping
To enable log shipping to Elasticsearch, update theapp pod to include a sidecar container. This sidecar, named sidecar, uses a custom Filebeat image (kodekloud/filebeat-configured) and shares the same log volume as the application container.
An image illustrating the pod configuration with the Filebeat sidecar is shown below:

Editing the Pod for a Sidecar
Edit the pod manifest in theelastic-stack namespace:
Pod updates do not allow adding or removing containers directly. If you encounter an error during the update (e.g., “pods ‘app’ is invalid”), save your changes and force a replacement with:This command will delete and recreate the pod using the updated manifest.
- Application Container: Writes logs to
/log. - Filebeat Sidecar: Reads the logs and ships them to Elasticsearch.
Verifying Logs in Kibana
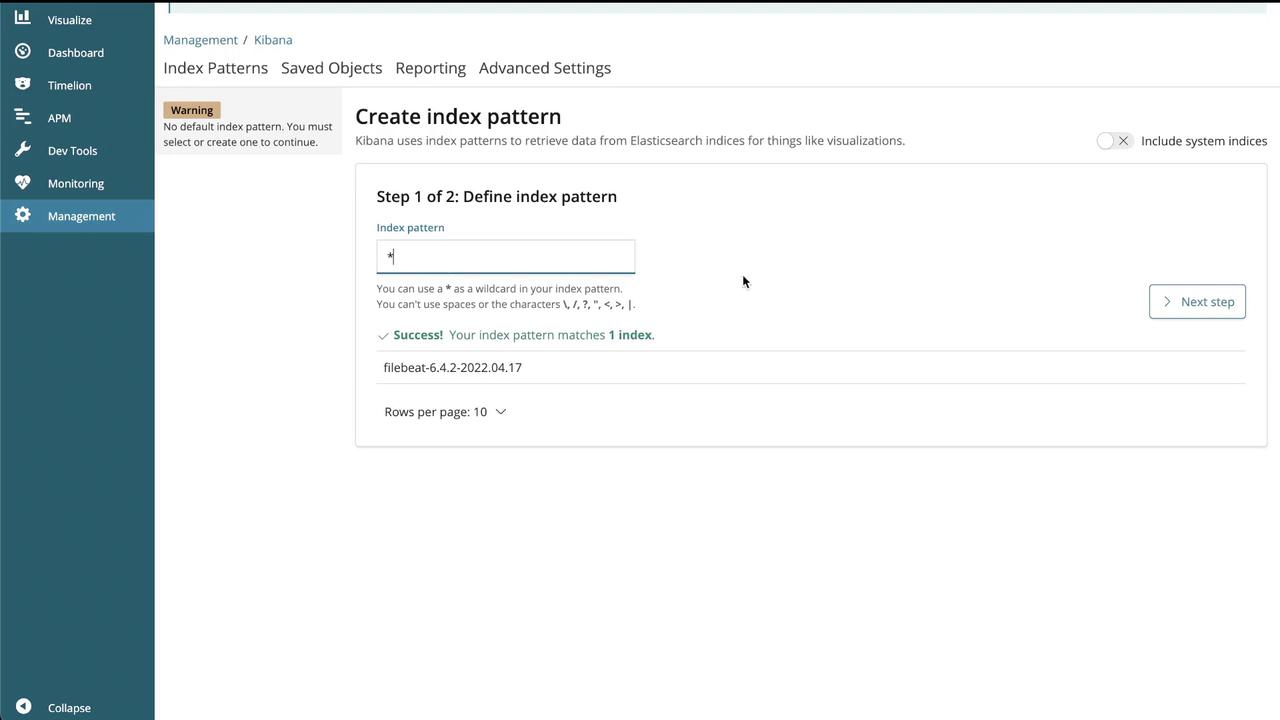
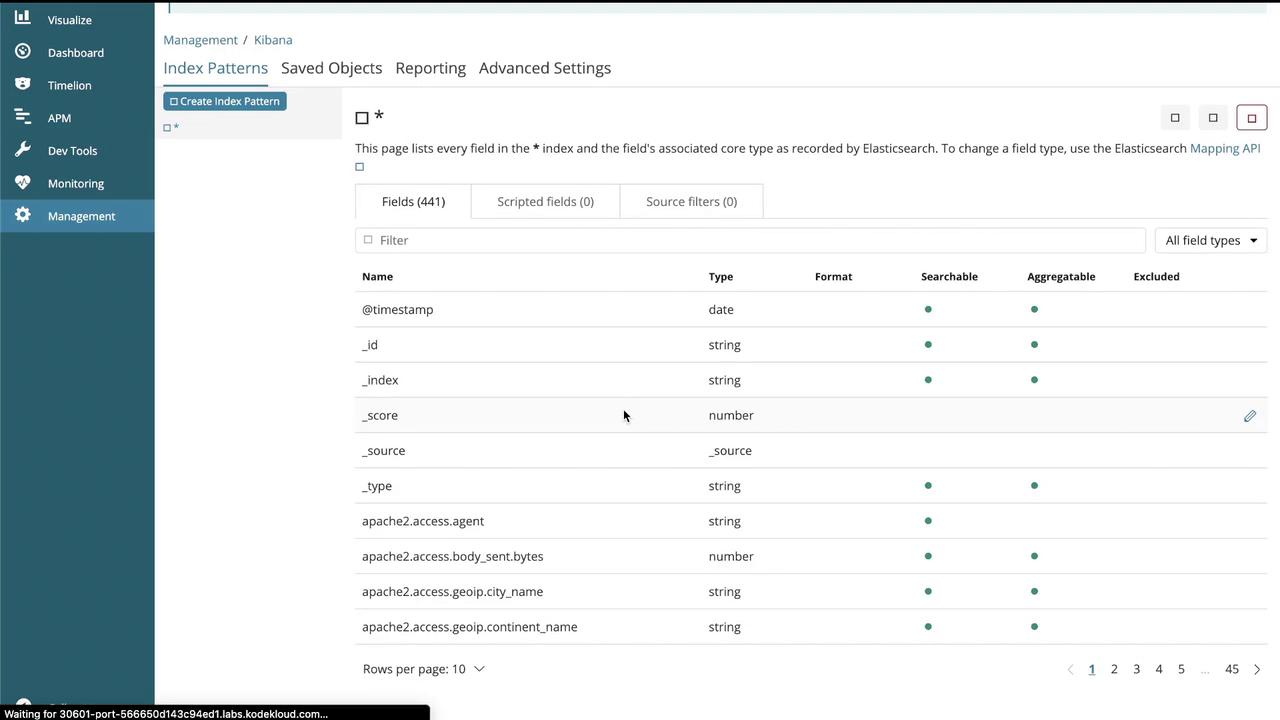
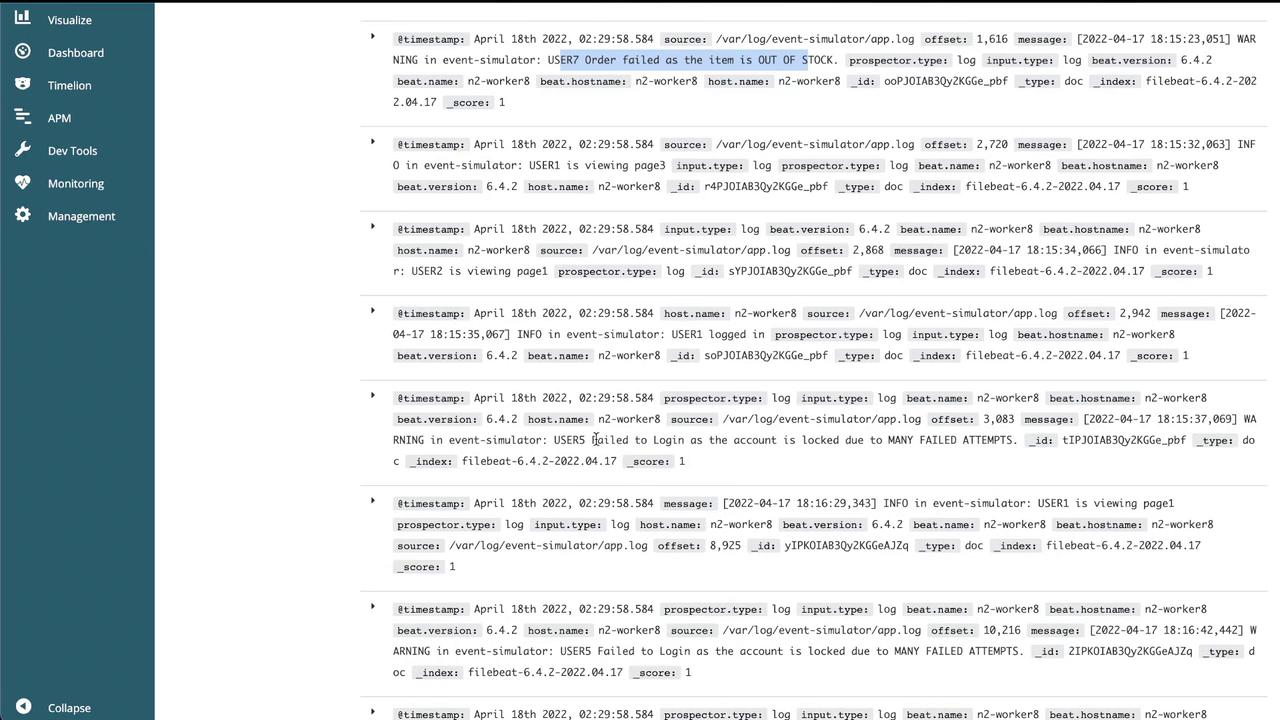
After applying the changes, verify that logs are being shipped to and visualized in Kibana. Follow these steps:- Open the Kibana UI.
- When prompted, create an index pattern (e.g.,
filebeat-*or as instructed in your lab). - Set the time filter field name if required.
- Click “Start” or “Create” to finalize the index pattern.
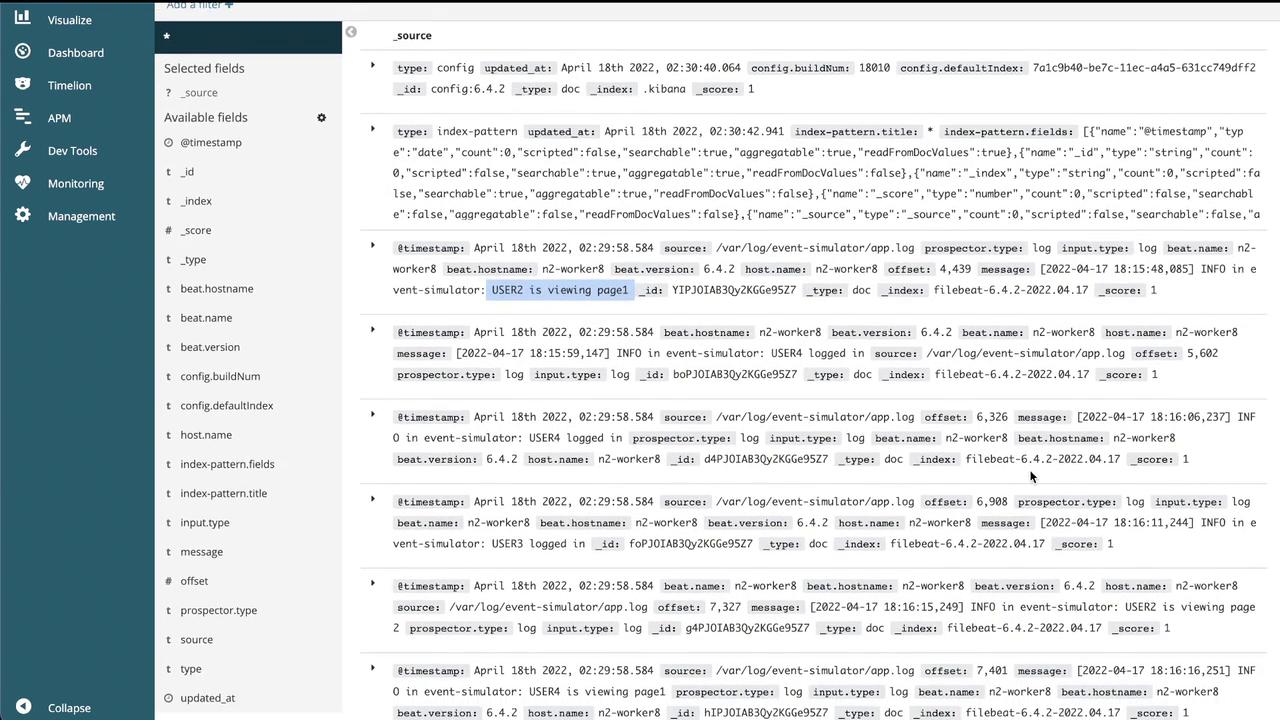
- Log entries with timestamps and corresponding messages.
- Detailed event information, including user actions, warnings, and order failures.
That concludes our guide on multi-container pods and log shipping in Kubernetes. Happy learning! For further information, consider visiting the following resources: