

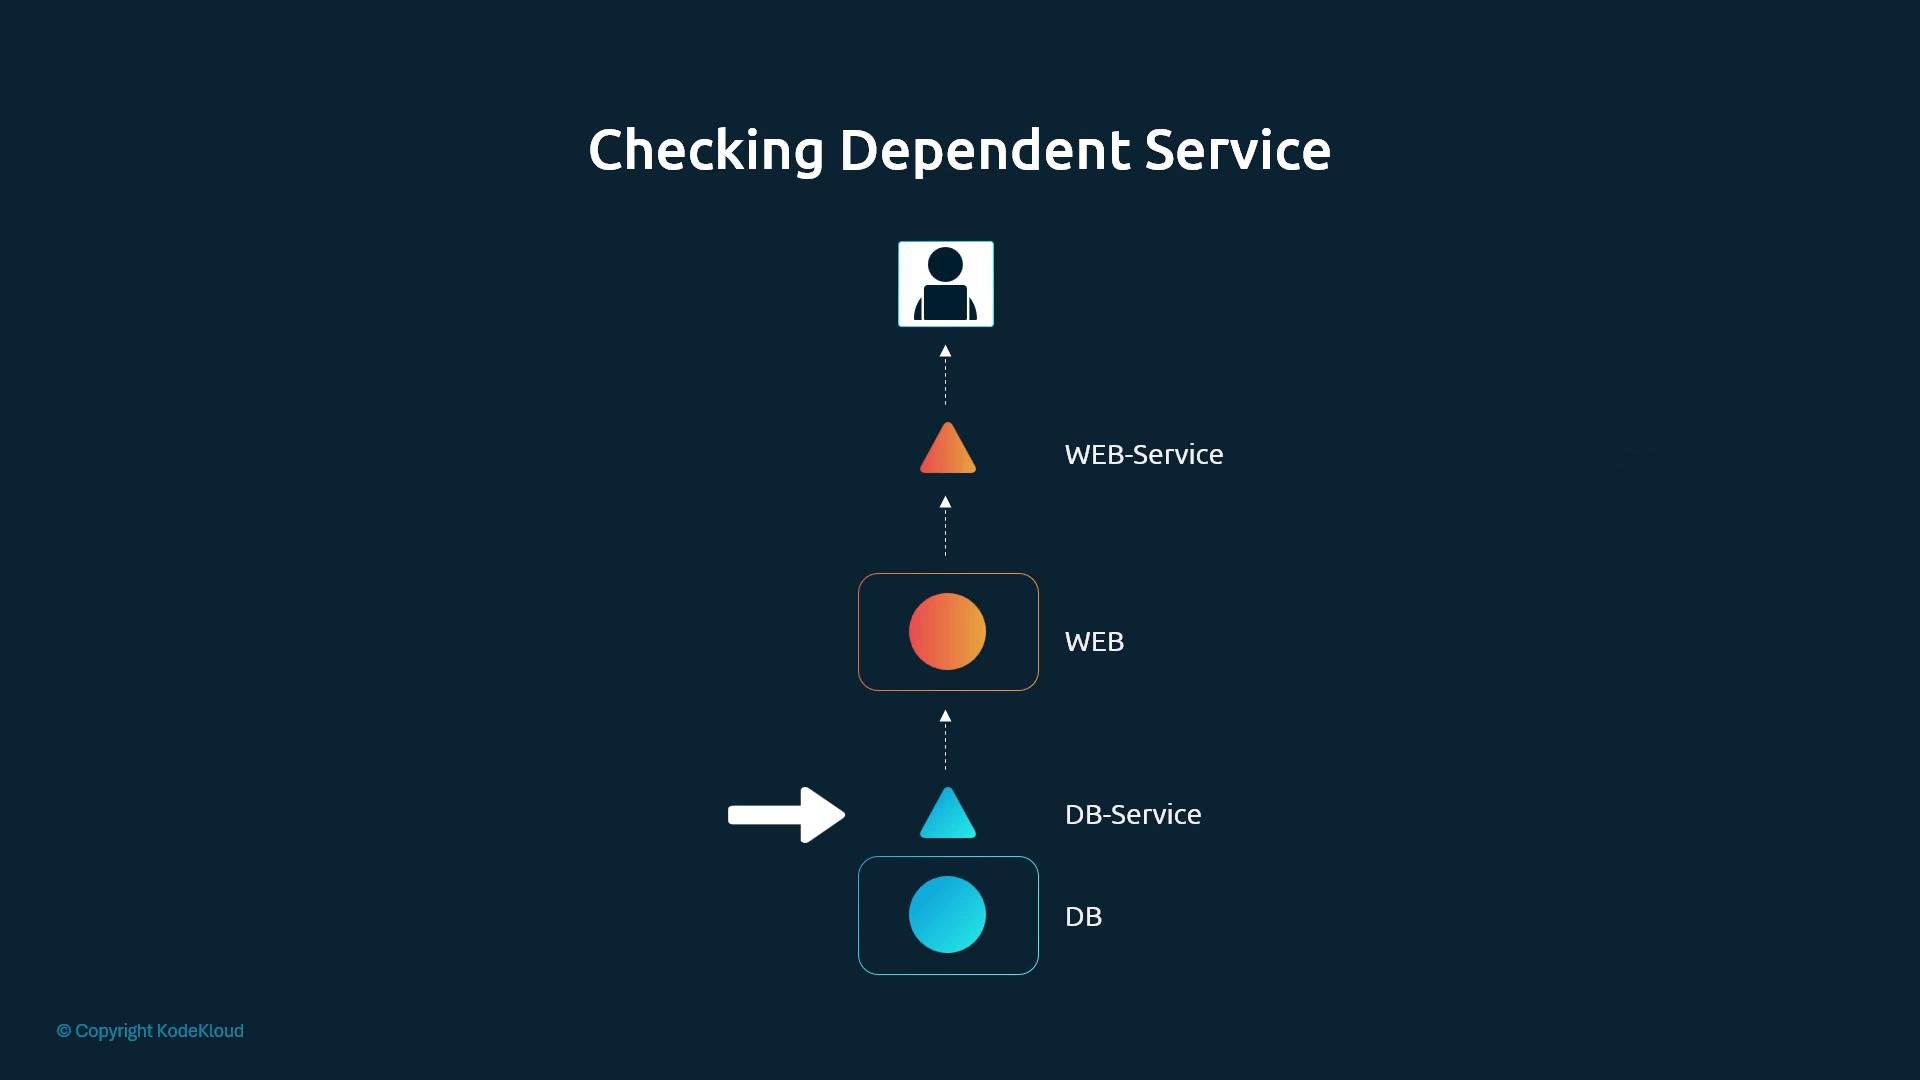
Before you run commands, draw a small topology diagram showing how components connect (user → web Service → web Pod → DB Service → DB Pod). This reduces guesswork and helps decide whether to begin at the frontend or backend based on symptoms.
Troubleshooting checklist (ordered)
Work through these steps until you find the root cause. Start at the user-facing end if users report the application is inaccessible.1) Test the user-facing endpoint
- From outside the cluster test Node IP + NodePort (NodePort Service) or an external load balancer URL:
- From inside the cluster, curl the Service ClusterIP or Service DNS name:
2) Inspect the Service
- Confirm the Service has endpoints (that it discovered pods matching its selector):
- If
Endpoints:is empty, verify the Service selector exactly matches the Pod labels. A label-selector mismatch is a common cause of missing endpoints.
3) Check the backing Pod(s)
- Ensure the pod is Running and not repeatedly restarting. Use:
- Look for
CrashLoopBackOff, restart counts, and recent events inkubectl describe. - Example Pod manifest for reference:
4) Read application logs
- Use
kubectl logsto examine container output:- Follow logs in real time:
- View logs from the previous crashed instance:
- For multi-container pods:
5) Move to the database layer (if web layer looks healthy)
- Repeat the Service → Pod → Logs checks for the DB Service and DB Pod.
- Look for messages indicating the DB cannot accept connections (authentication errors, missing schema migrations, out-of-memory kills, etc.).
6) Use describe for deeper diagnostics
kubectl describesurfaces pod events, image pull errors, failed probes, and other useful messages:
Quick command reference
Common pitfalls: Service selectors that don’t match pod labels, container ports misconfigured relative to Service targetPort, NetworkPolicies or firewall rules blocking traffic, and kube-proxy issues. Confirm labels, ports, and network rules before assuming application-level failures.
Additional diagnostic tips
- If Services report endpoints but traffic still fails, check:
- NetworkPolicies (restricting Pod-to-Pod traffic),
- Node firewall rules and security groups,
- kube-proxy status and mode on nodes.
- To verify connectivity from within the cluster, create a temporary debug pod (busybox, curl images) and exec into it to curl Service IPs and pod IPs.
- For troubleshooting liveness/readiness probe failures, inspect probe definitions in the Pod spec and pod events for probe failure messages.
Links and references
- Kubernetes: Troubleshooting Applications — https://kubernetes.io/docs/tasks/debug-application-cluster/debug-application/
- Kubernetes Concepts: Services — https://kubernetes.io/docs/concepts/services-networking/service/
- kubectl documentation — https://kubernetes.io/docs/reference/kubectl/