

- Node-level metrics: cluster size, node health, and performance (CPU, memory, network, disk).
- Pod-level metrics: pod counts and per-pod resource usage (CPU, memory).
- Scrapes metrics from nodes and pods,
- Stores metrics (at least temporarily),
- Provides querying/analytics for current and, optionally, historical data.
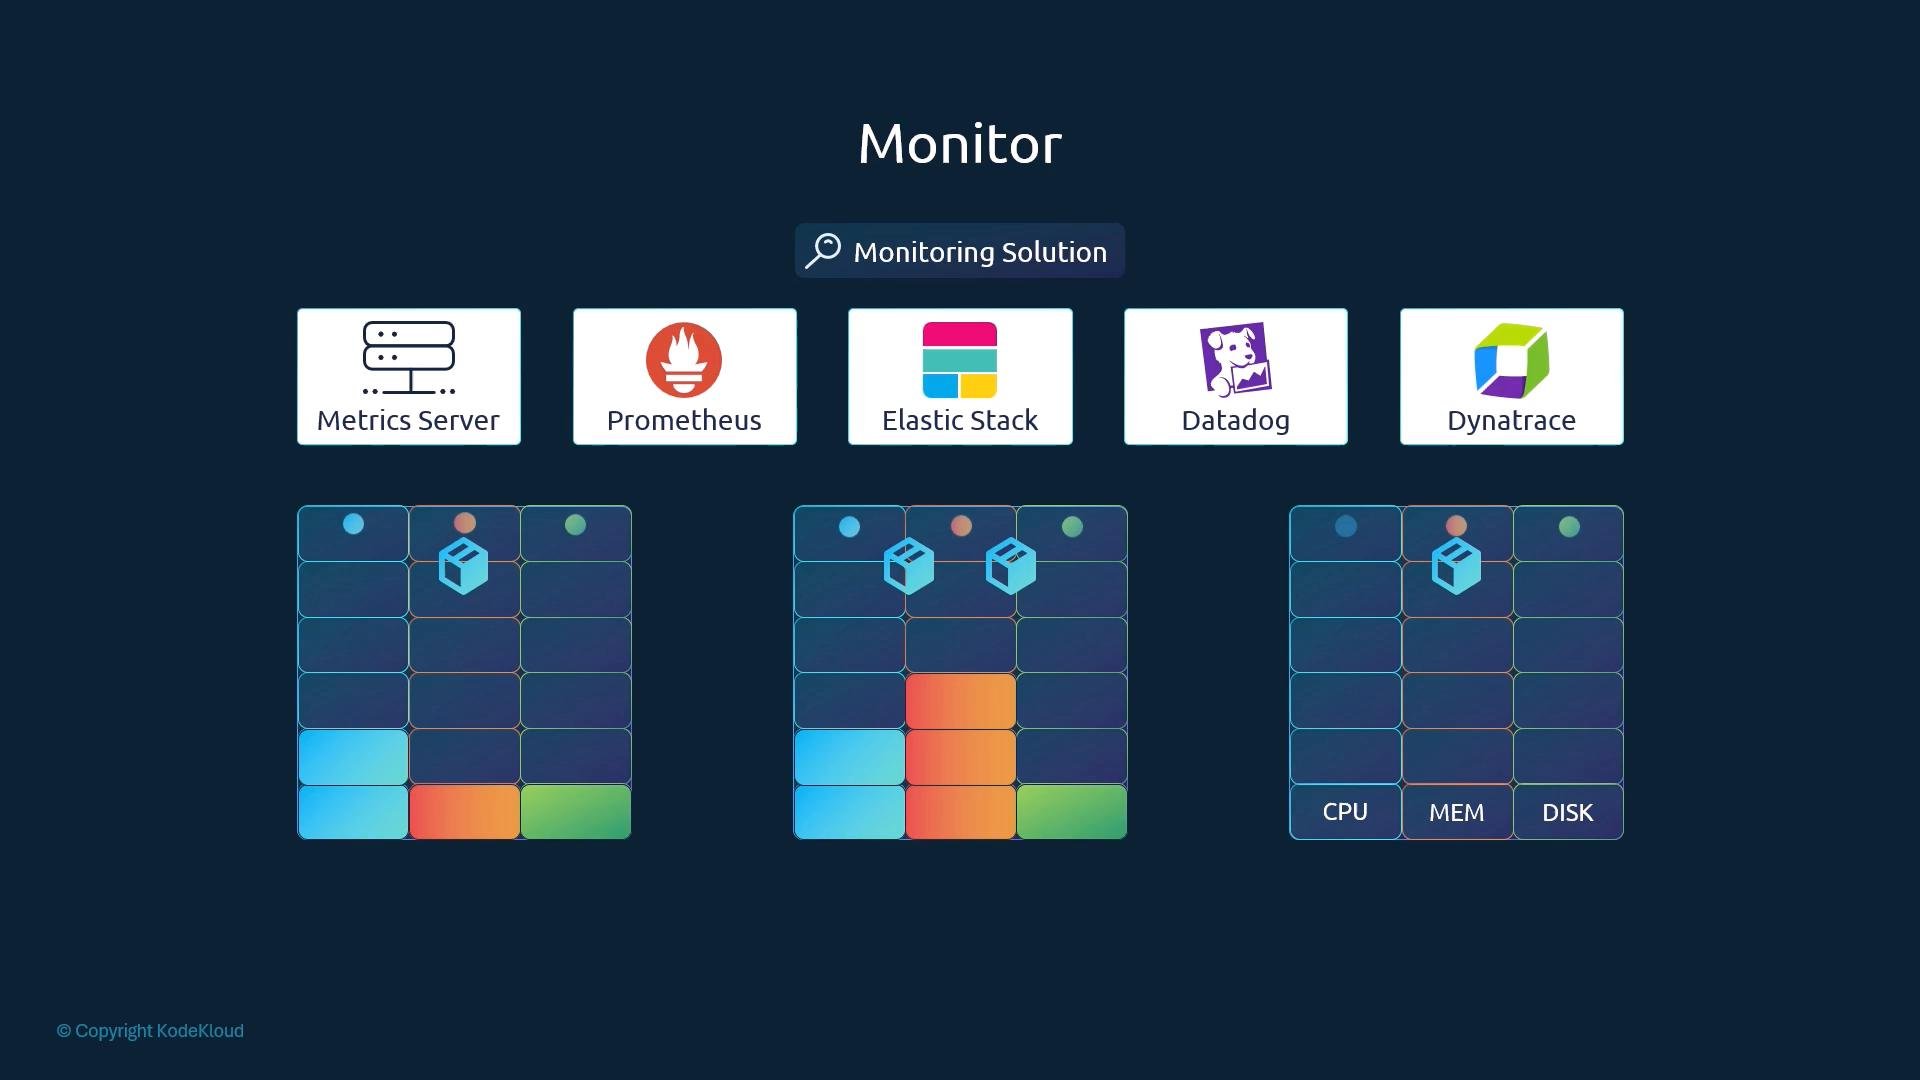
- Metrics Server (lightweight, short-term),
- Prometheus (time-series database and query engine),
- Elastic Stack, Datadog, Dynatrace (commercial/enterprise solutions).
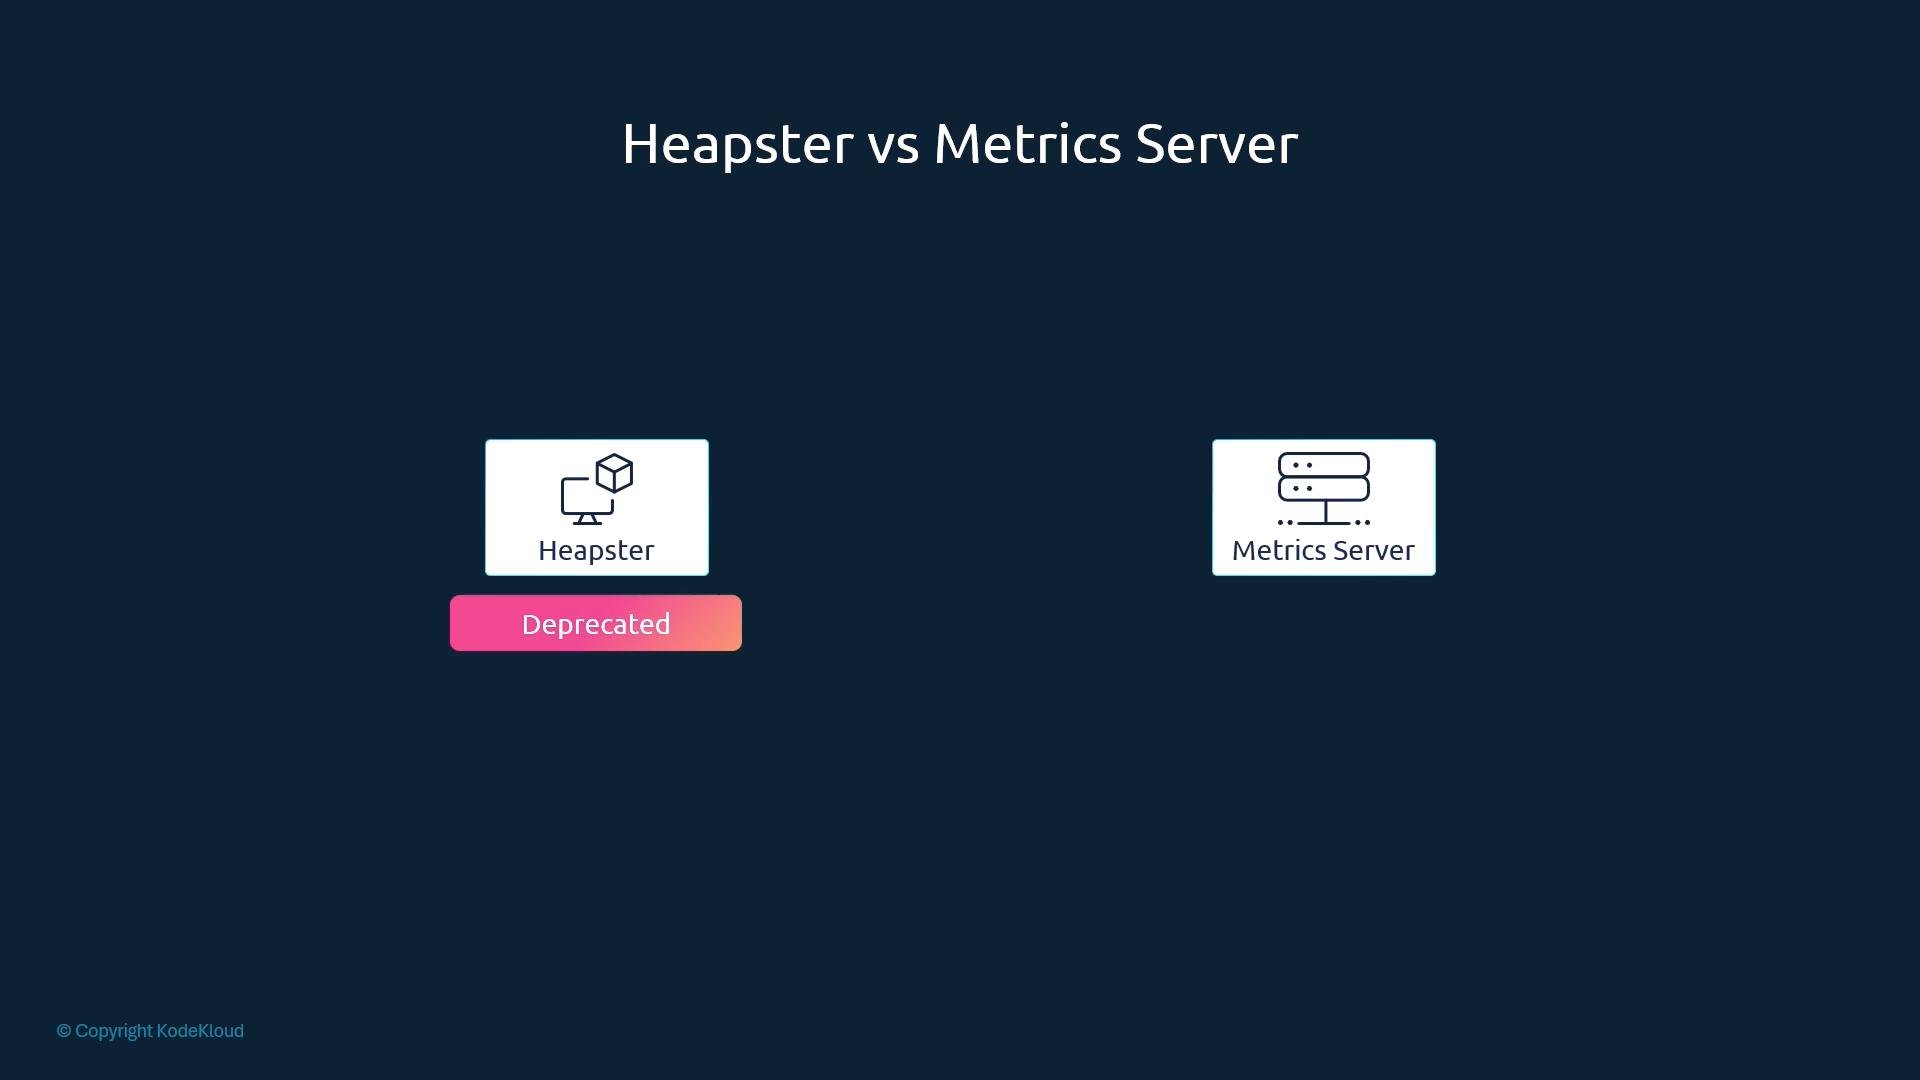
Heapster is deprecated and should not be used for production monitoring. Replace Heapster-based tooling with Metrics Server for short-term metrics or Prometheus for full time-series monitoring and long-term storage.
- One Metrics Server per cluster is typical.
- It scrapes metrics from all kubelets, aggregates them in memory, and serves current cluster metrics.
- It does not persist time-series data to disk, so it cannot provide historical metrics.
Use Metrics Server for lightweight, near-real-time metrics (e.g.,
kubectl top, Horizontal Pod Autoscaler). For historical storage, advanced queries, and alerting, use a Prometheus-based stack or a commercial monitoring service.- kubelet: runs on every node, manages pods, and exposes node/pod metrics.
- cAdvisor: built into kubelet; collects per-container resource usage (CPU, memory, filesystem, network).
- Metrics Server: scrapes the kubelet endpoints across the cluster to gather and aggregate metrics.
Deploying Metrics Server
- Minikube:
- Other clusters (apply official components):
- Node metrics:
- Pod metrics:
- Deploy Metrics Server in a test cluster (Minikube or a cloud cluster).
- Create a few pods with varying resource limits/requests.
- Use
kubectl top nodeandkubectl top podto observe live resource usage. - If you need historical metrics, set up Prometheus (and optionally a remote storage backend) and compare stored time-series vs Metrics Server live view.
- Metrics Server: https://github.com/kubernetes-sigs/metrics-server
- Prometheus: https://prometheus.io/
- Kubernetes concepts: https://kubernetes.io/docs/concepts/
- cAdvisor: https://github.com/google/cadvisor