

You may need repository read access (or higher) to view some Insights details. Organization-level settings can also restrict certain Analytics views.
Key Insights views
Below is a concise overview of the principal Insights tabs and what you can discover in each one.Pulse — activity summary
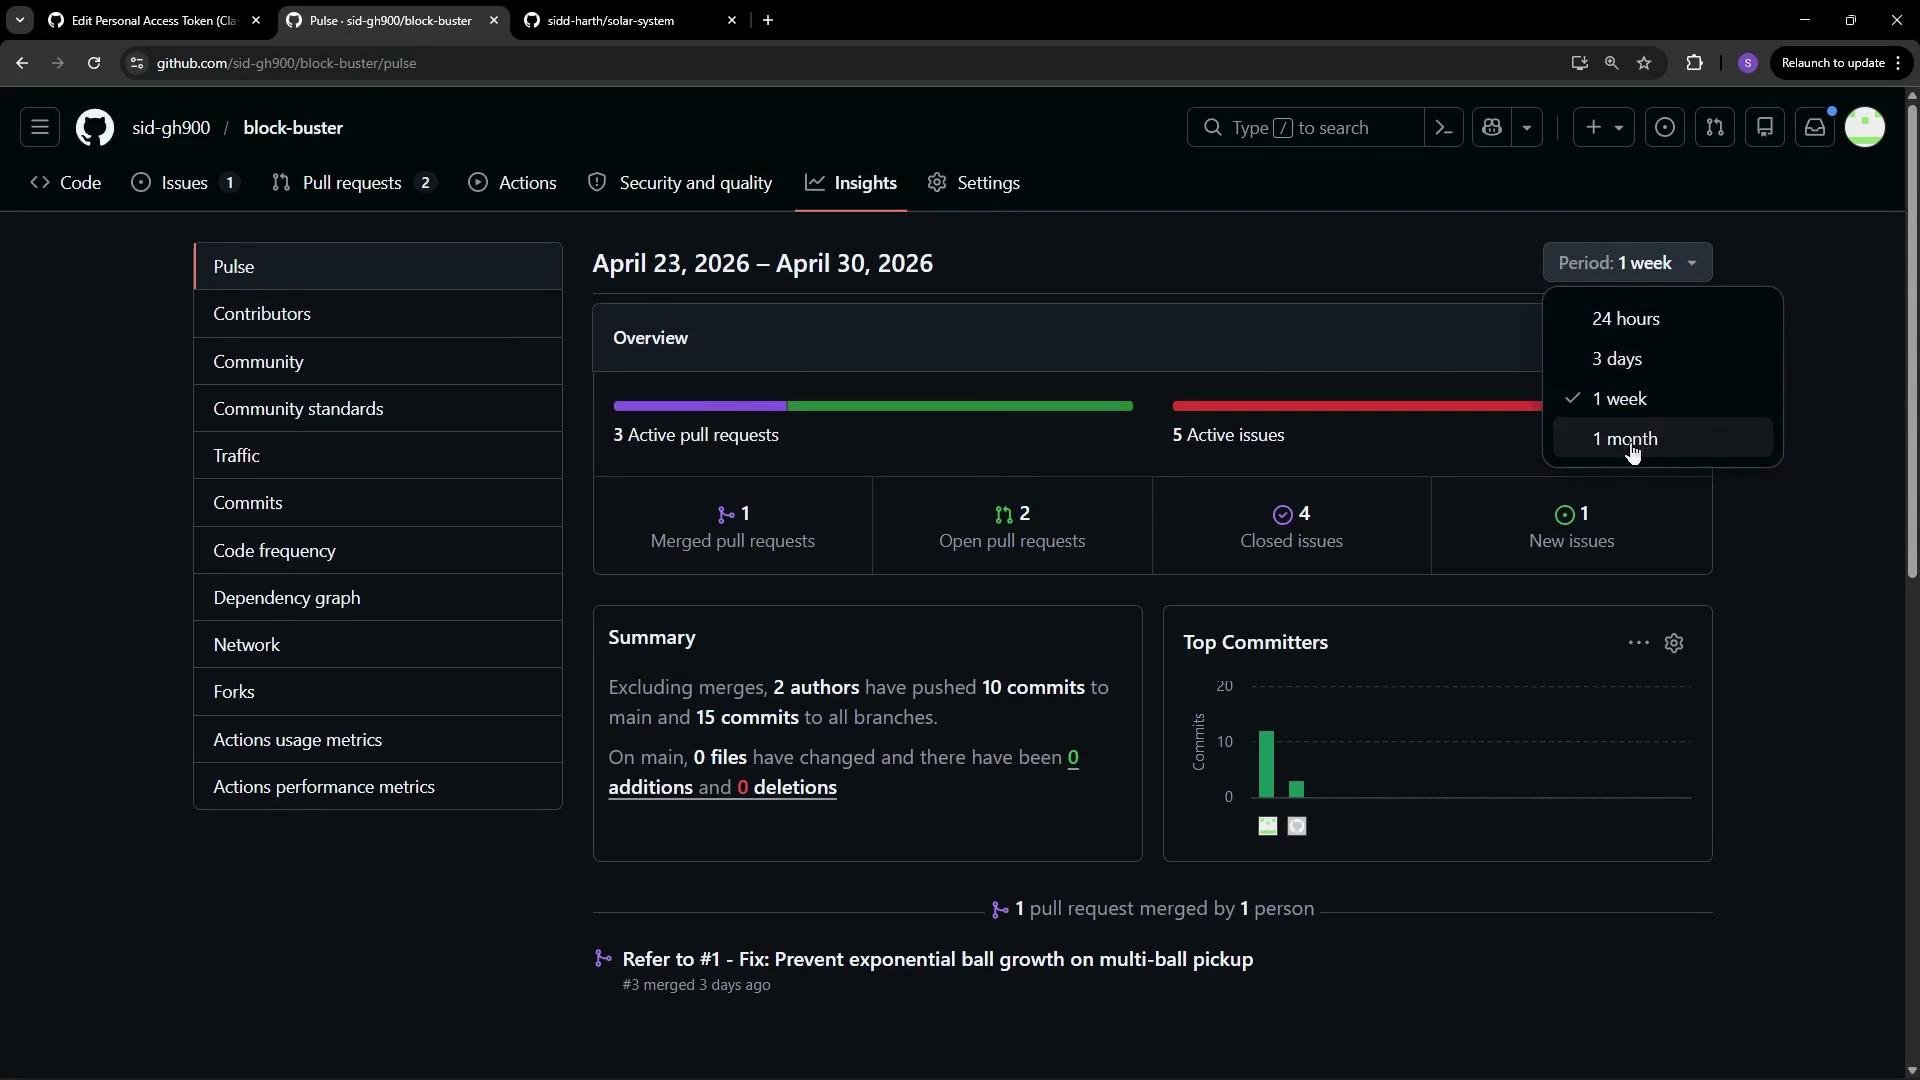
The Pulse tab summarizes recent repository activity for a selectable timeframe (for example, last week or last month). It highlights:- Active and closed pull requests
- Open and closed issues
- Recent commit activity and top committers
- Commit counts excluding merges, by default branch and all branches
Contributors — who’s doing the work
The Contributors view displays a graph and contributor list showing when and how much people commit. For single-contributor projects the graph will reflect that; for large projects it’s a quick way to spot active contributors and seasonal patterns.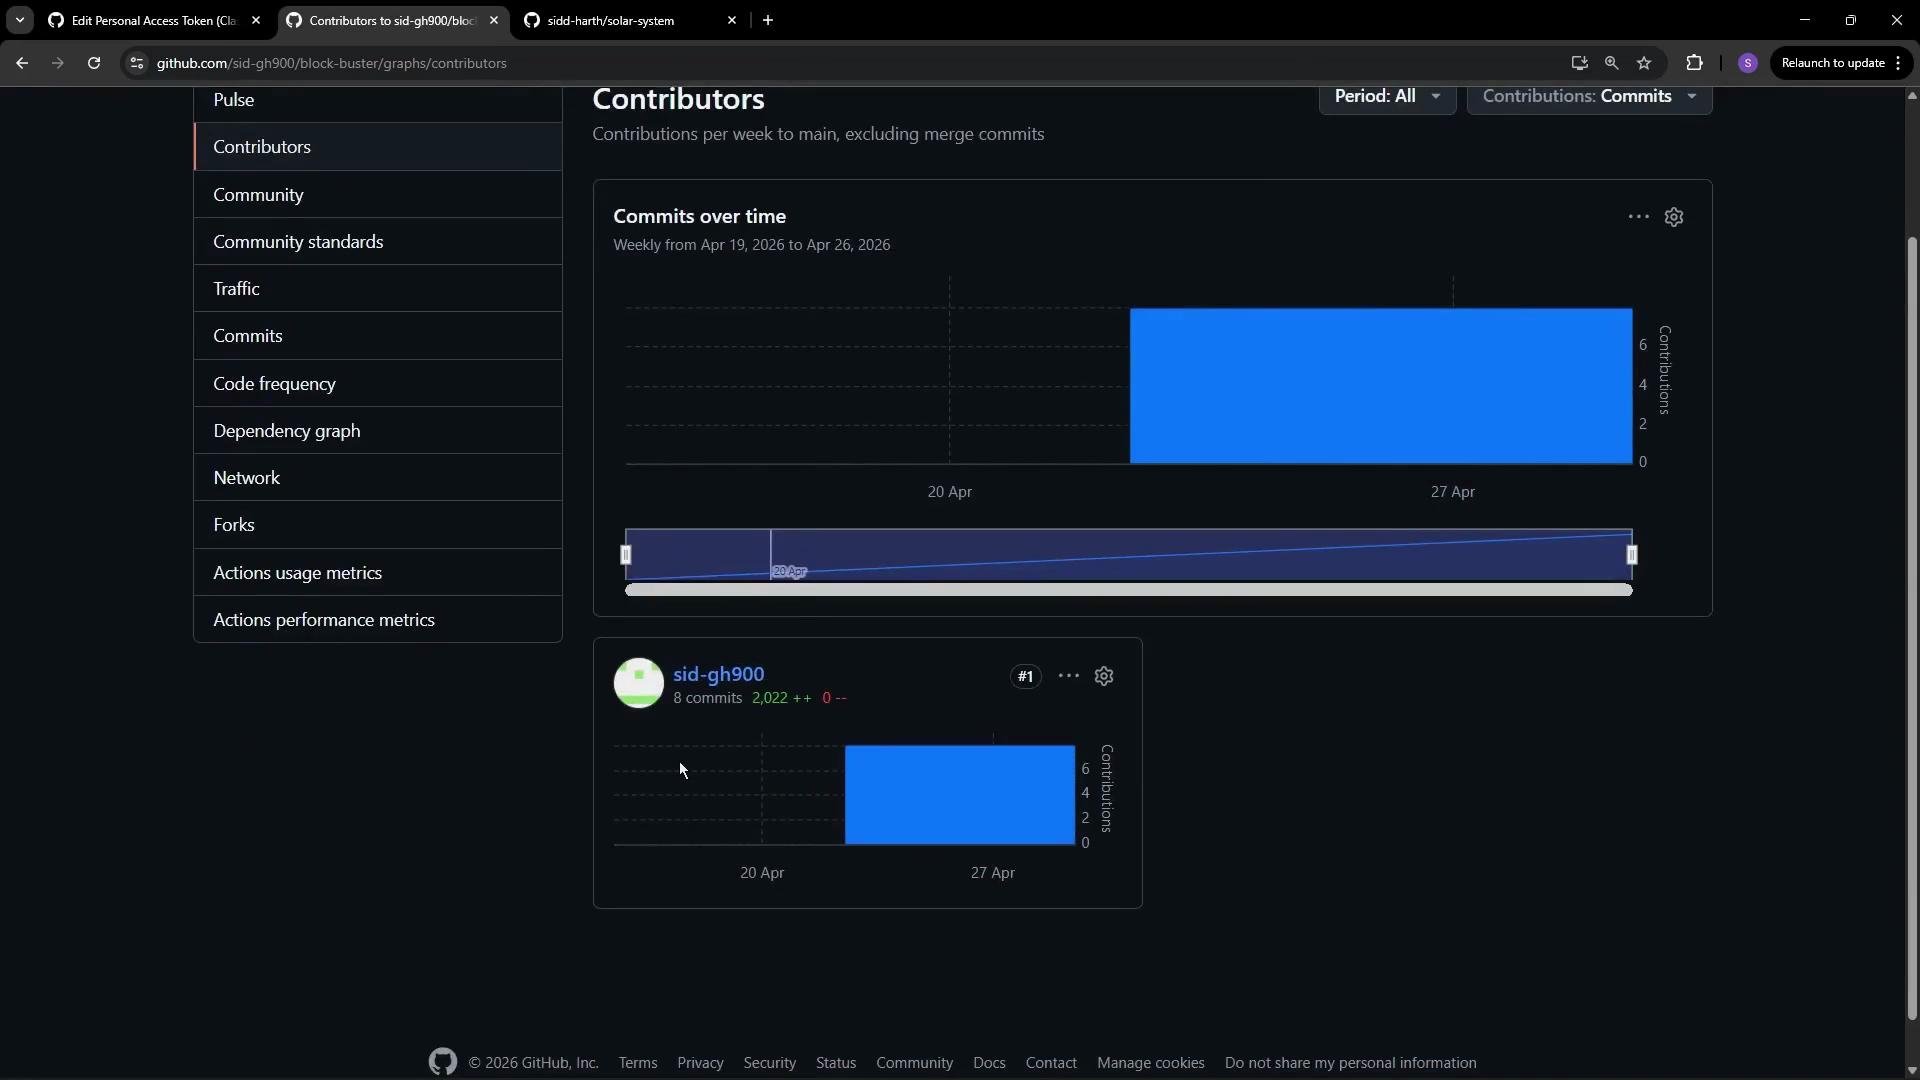
Community — engagement and standards
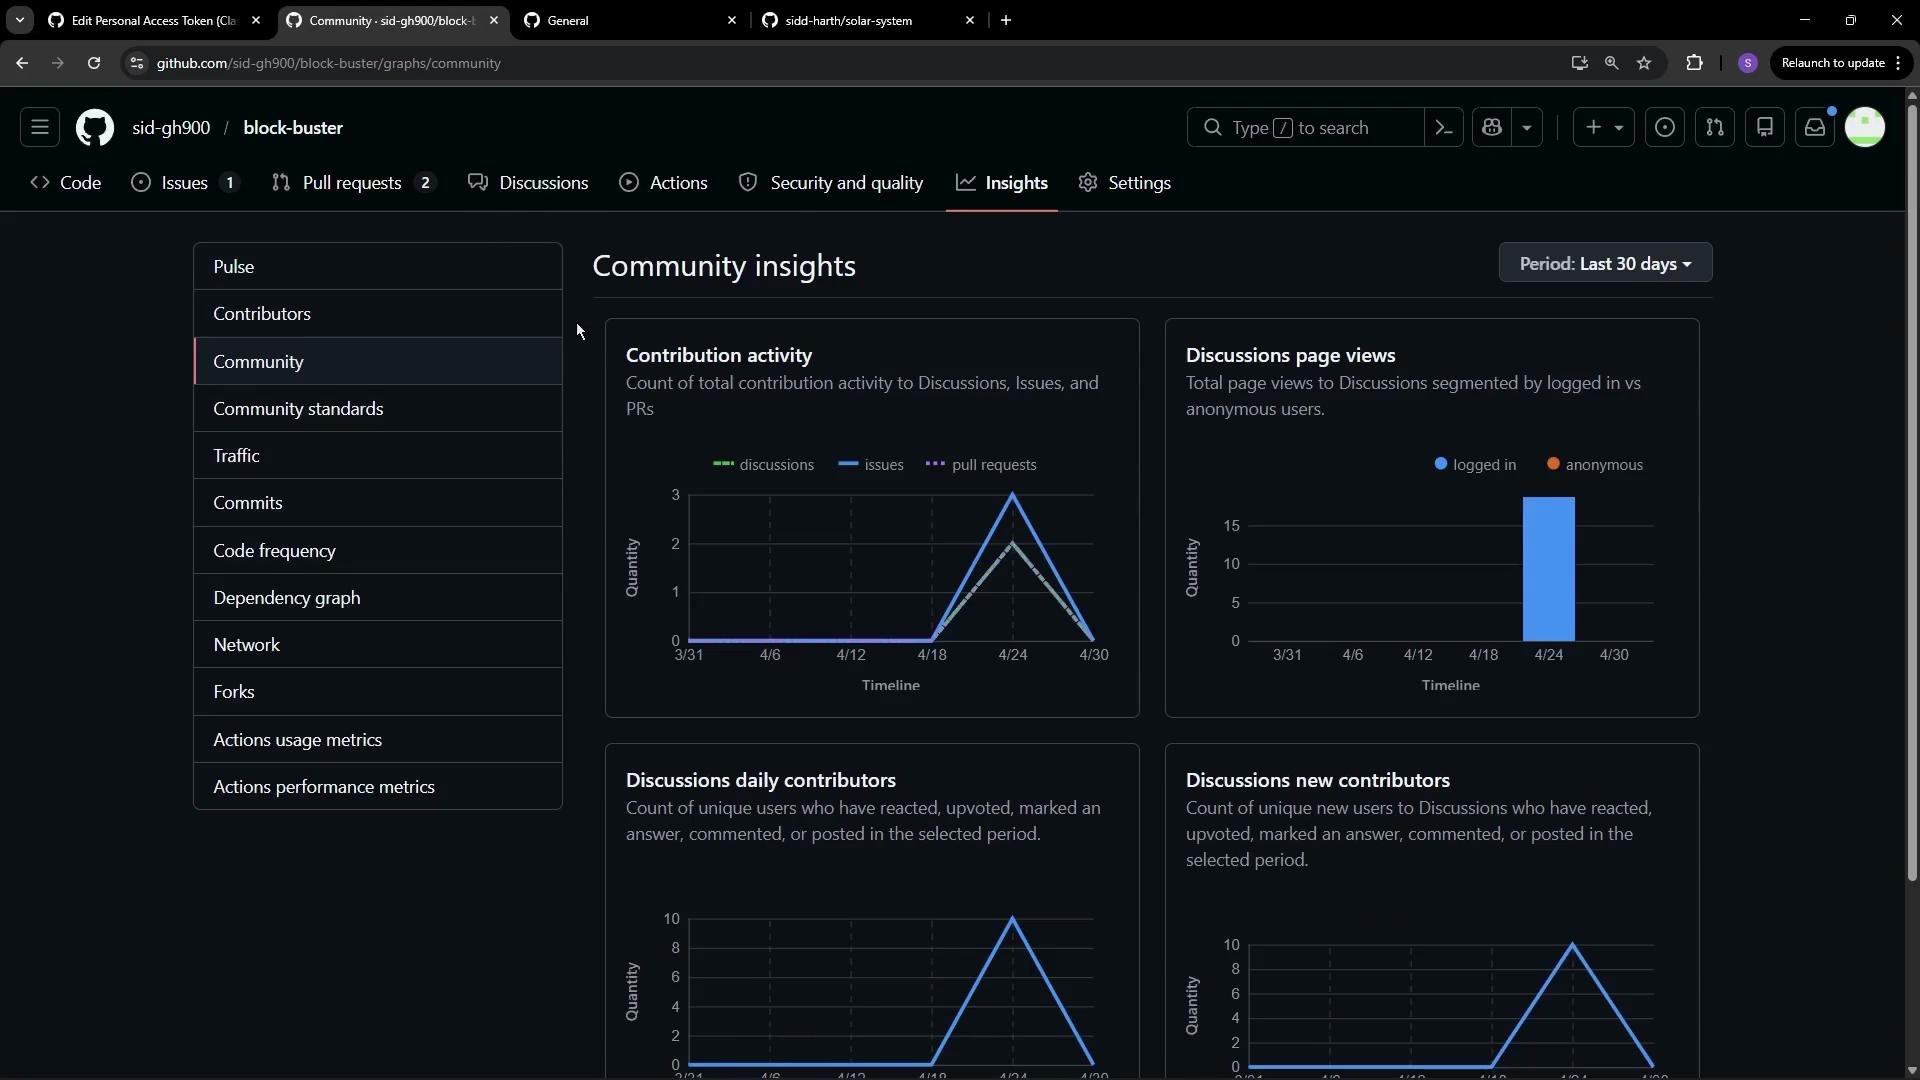
Community Insights aggregate signals from Discussions, issues, and pull requests. If Discussions are disabled, community metrics will be limited until you enable them. Once enabled, Insights can surface:- Discussion page views
- Daily contributors and new contributors
- Issue and PR engagement over time
Enable Discussions (if applicable) to include discussion activity in Community Insights. This provides a fuller picture of contributor engagement.
Community standards checklist
A healthy repository is welcoming and easy to understand. GitHub’s Community Standards provide a checklist of recommended files and settings:- License file (e.g.,
LICENSE) — clarifies permitted use. - Contribution guidelines (
CONTRIBUTING.md) — explains how to contribute. - Issue and pull request templates — standardize incoming reports and changes.
- Code of conduct — sets expected community behavior.
Traffic — how people find your project
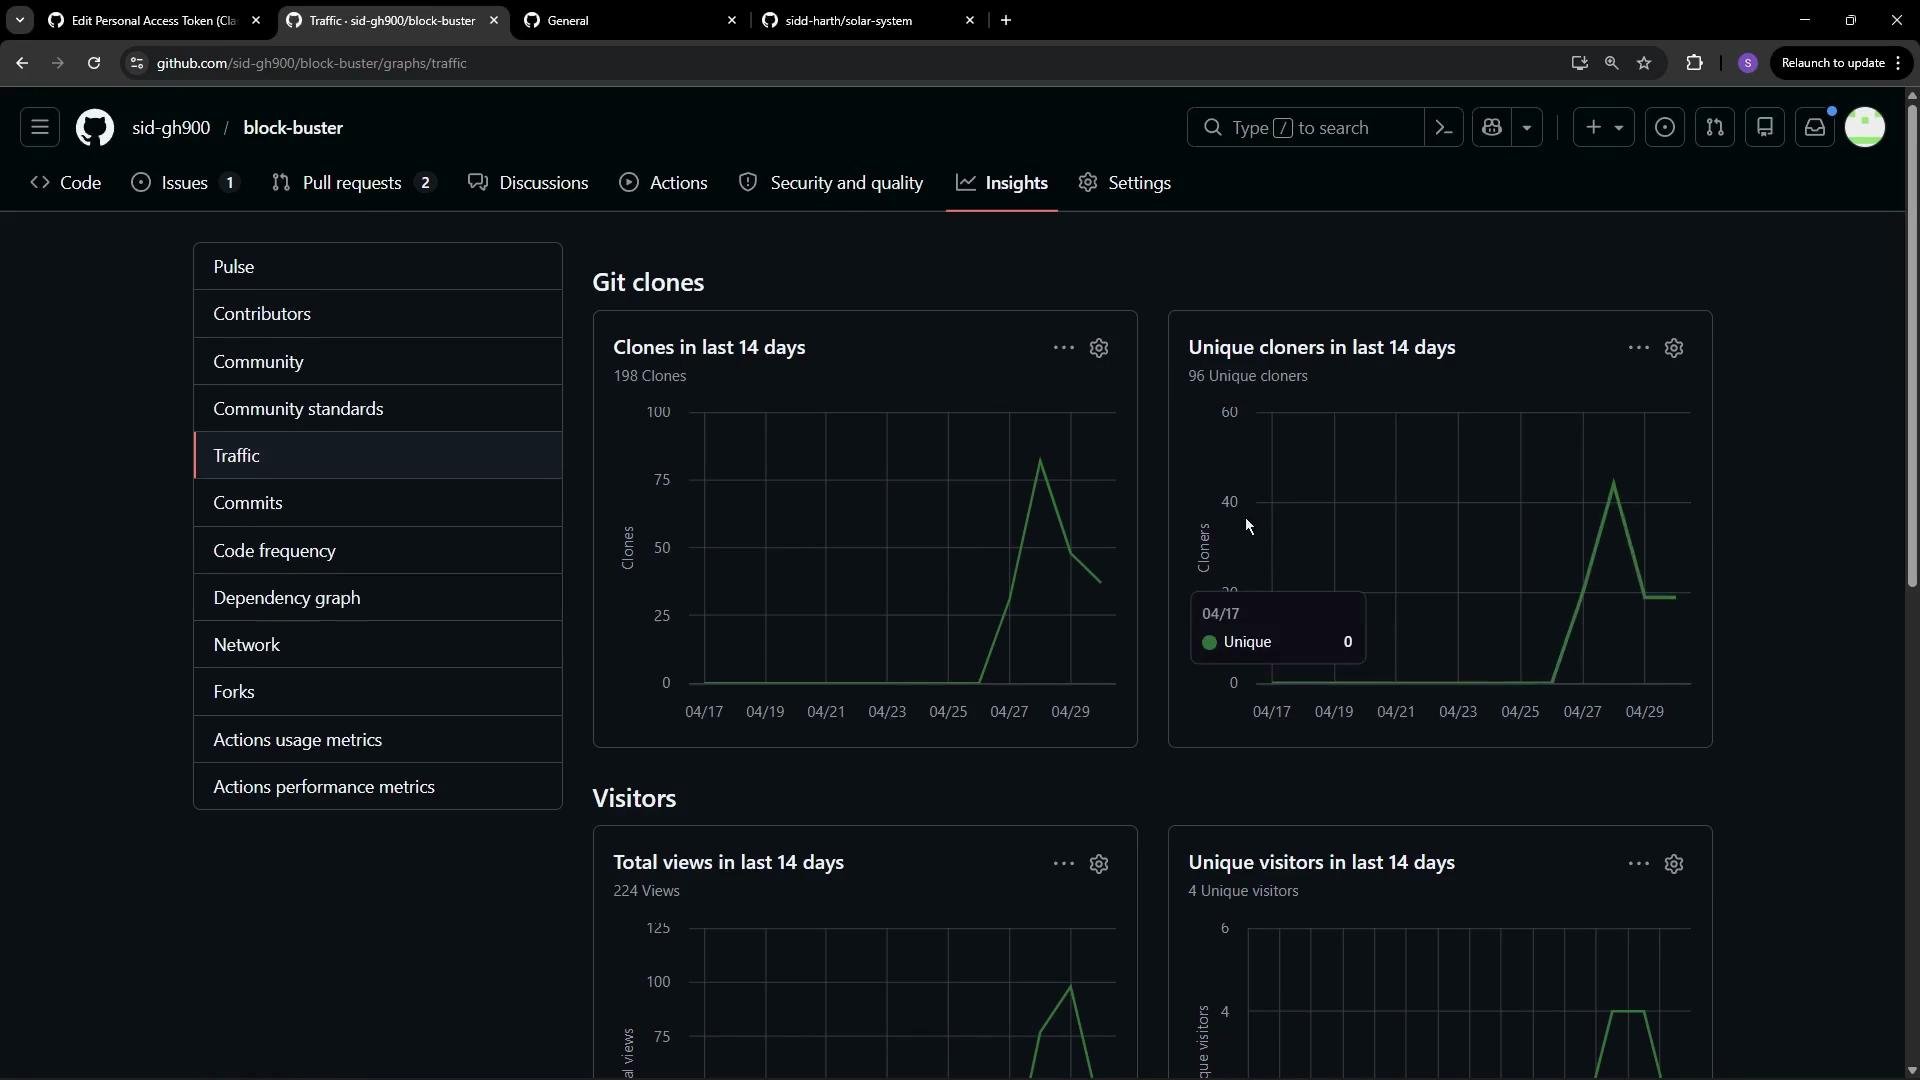
Traffic shows repository access metrics such as:- Git clones and unique cloners
- Visitors and unique visitors
- Referring sites
- Popular content (most-viewed files/pages)
Commits and code frequency
- Commits: visualized as a calendar heatmap for the past year. You can view commits as a table and export the data as an image or CSV.
- Code frequency: shows additions and deletions over time to indicate development intensity; may take time to populate.
Dependency Graph — parsed from your manifests
GitHub builds a dependency graph from language-specific manifest files (for examplepackage.json for Node, requirements.txt for Python). It lists detected dependencies, shows their relationships, and surfaces known vulnerabilities via Dependabot integration.
Example: a trimmed Node.js package.json that GitHub would read to build a dependency graph:
Network — branch and merge timeline
Network shows a visual timeline of branches, commits, and merges—helpful for quickly inspecting branching strategies and merge points across the project history.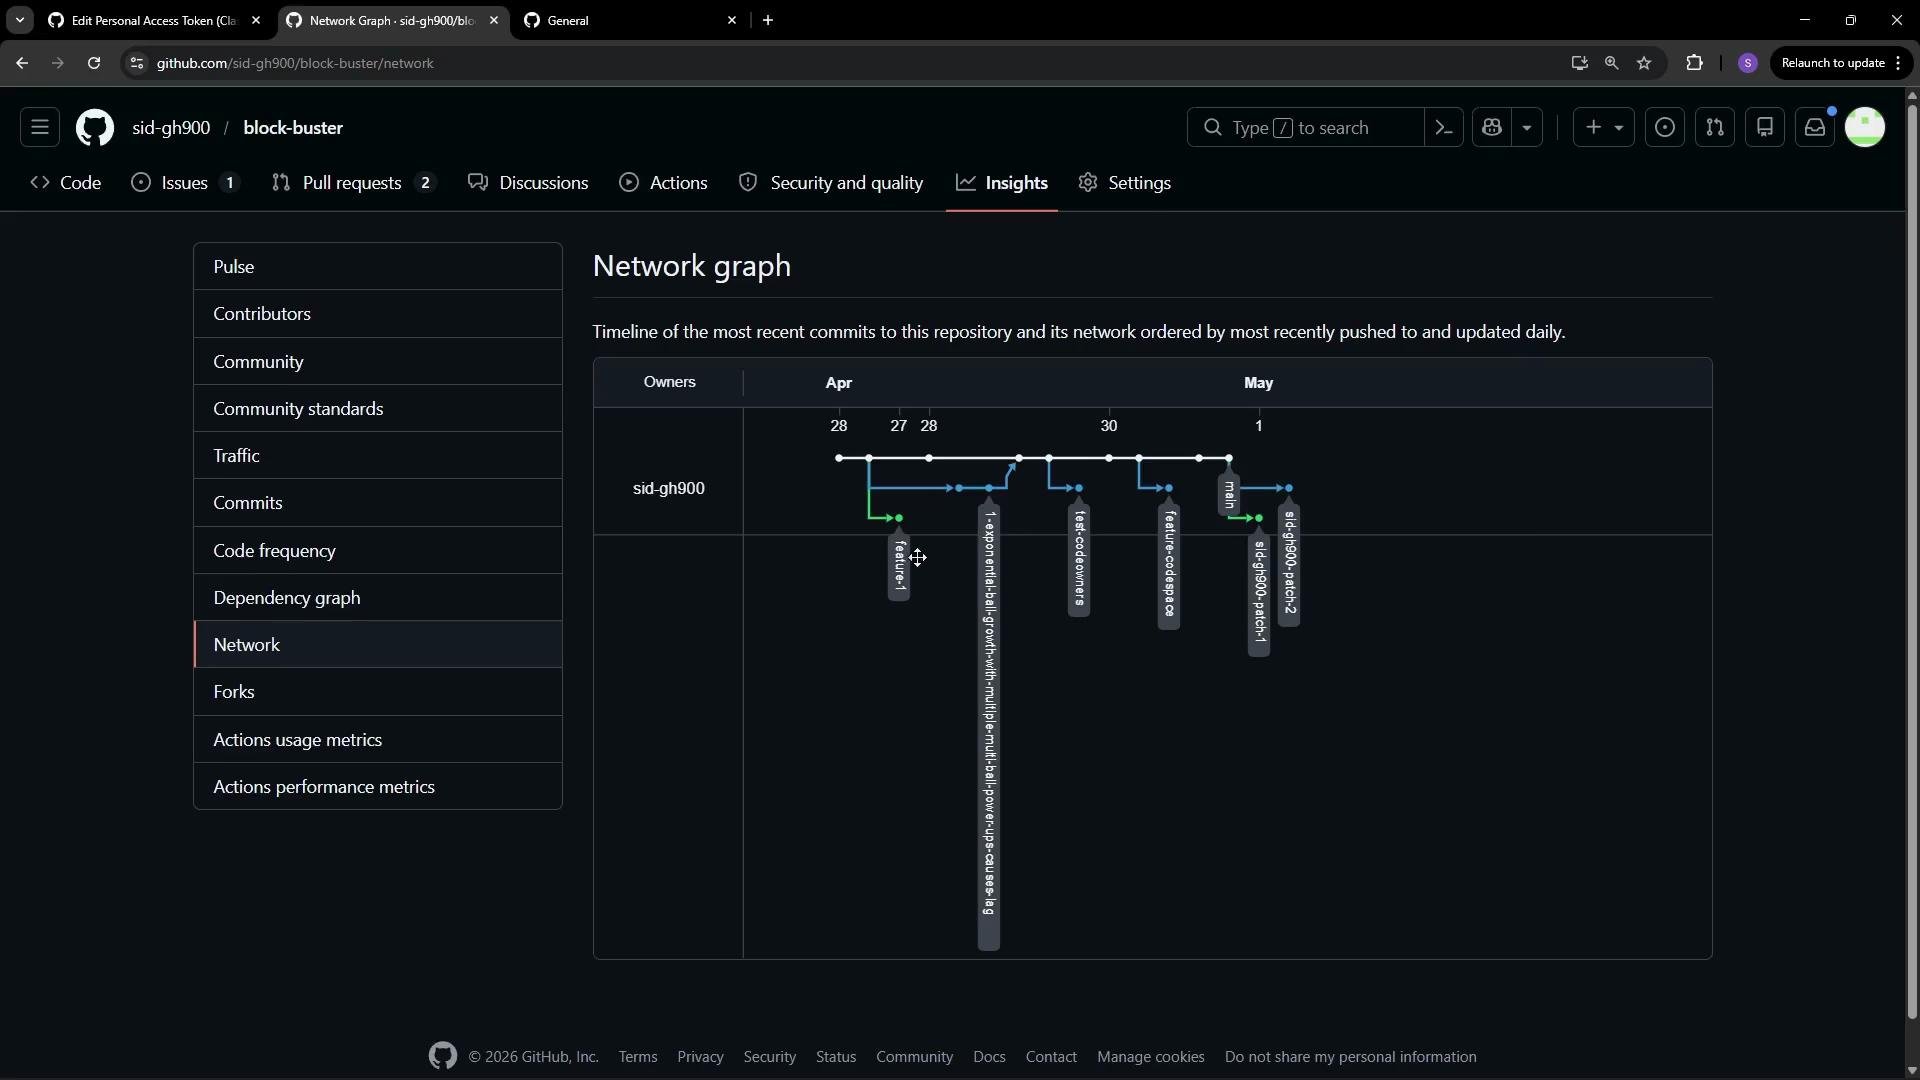
Forks — who forked your repo
Forks lists who has forked the repository and whether the forks have activity. Use filters to sort by recent push activity or view large numbers of forks in a tree view.Actions — usage and performance
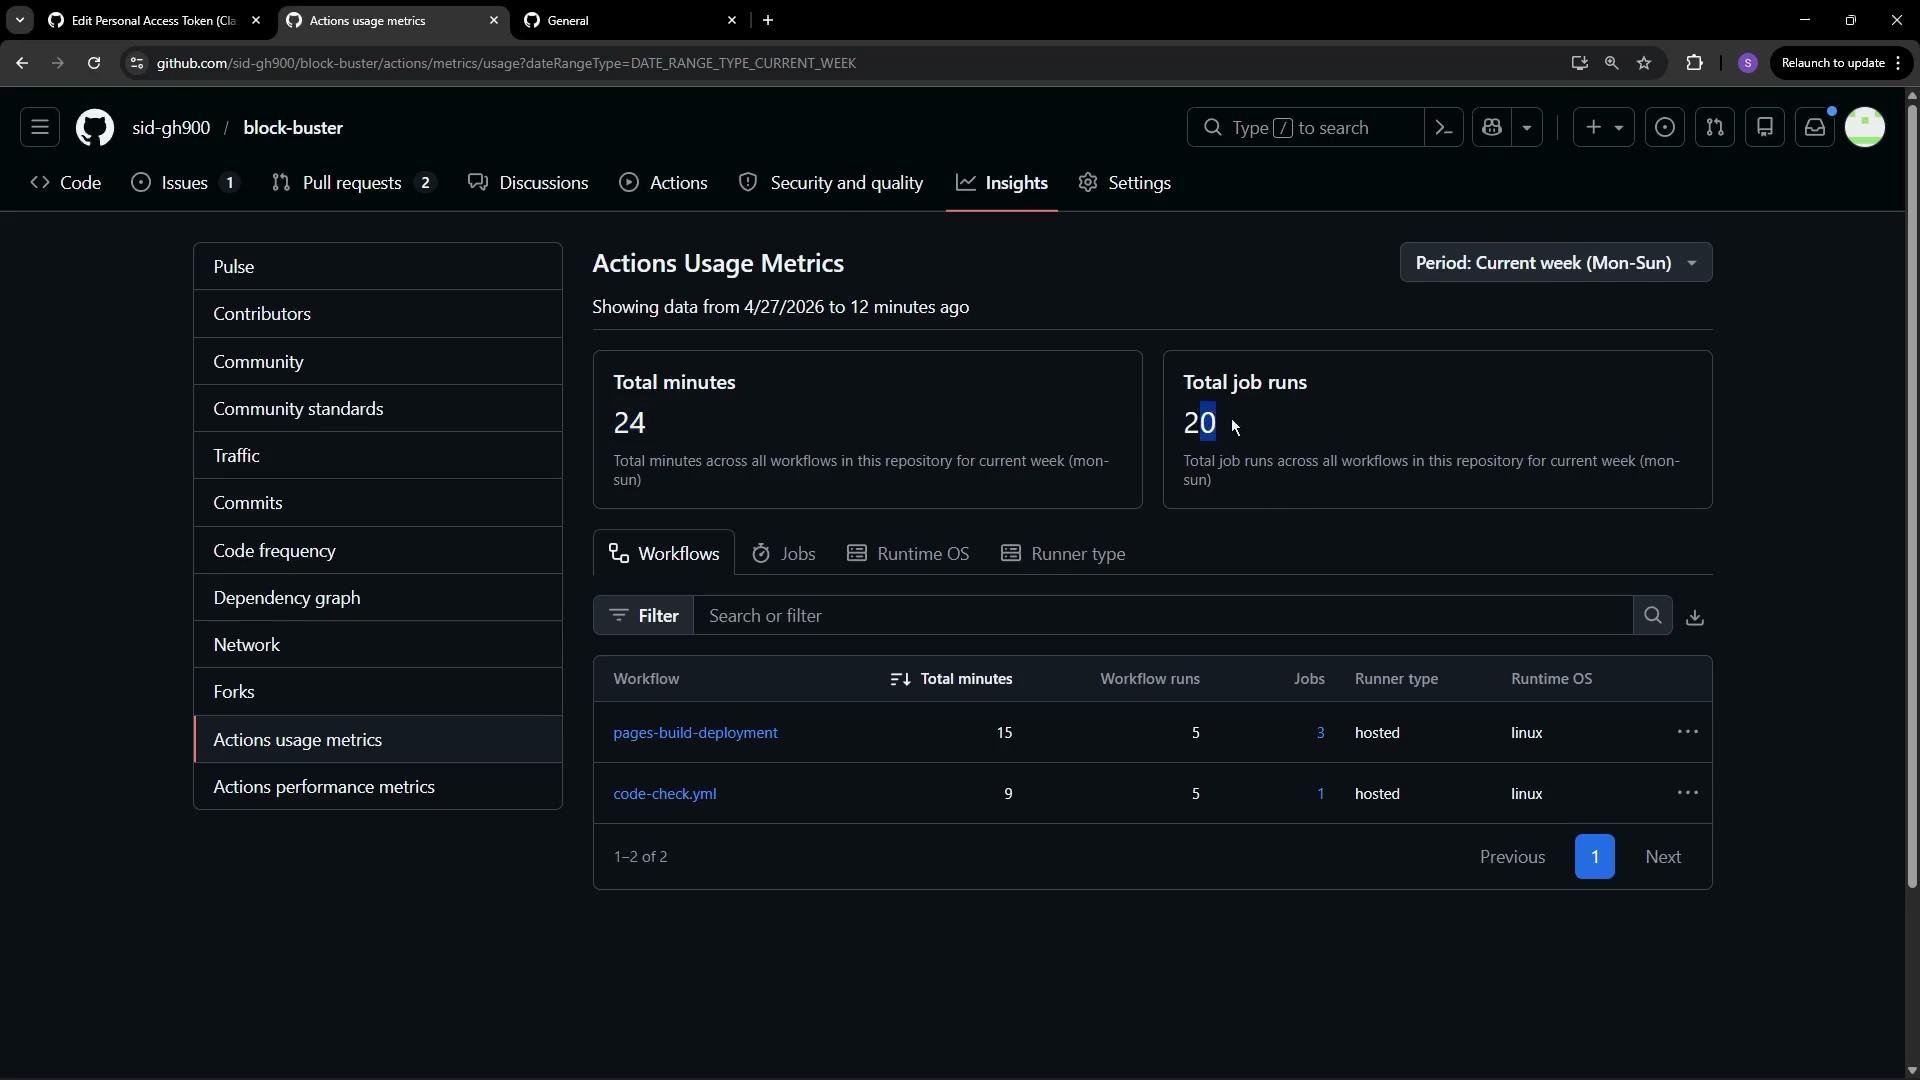
Actions usage metrics summarize how GitHub Actions workflows are being used:- Total minutes used
- Number of job runs
- Runner types and operating systems
Summary
Using the Insights tab gives maintainers and stakeholders a fast, data-driven view of repository health, contribution patterns, community engagement, dependency status, and CI/CD usage. Regularly review these views to:- Spot active contributors and gaps in activity
- Monitor community growth and engagement
- Track how users discover and use your project
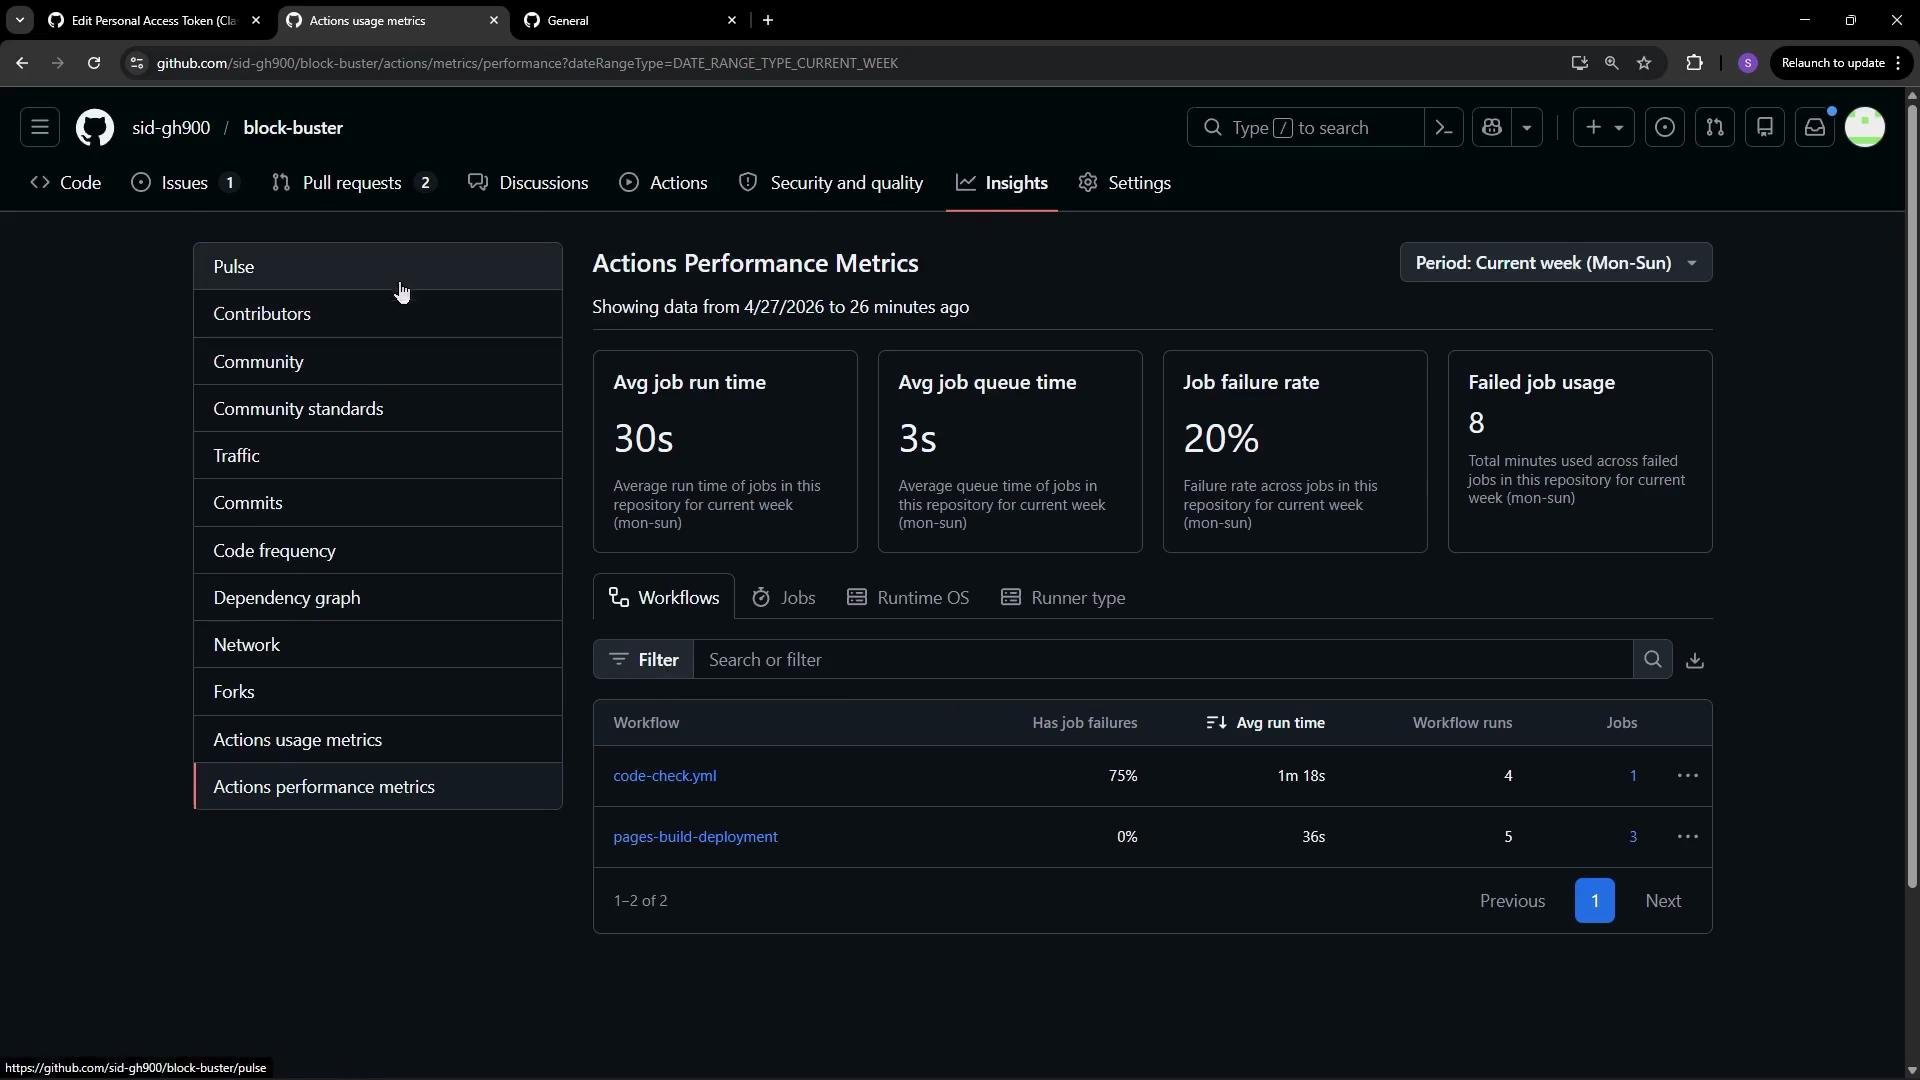
- Identify dependency risks and CI performance bottlenecks
Links and references
- GitHub Docs — Insights overview
- GitHub Docs — Dependency graph and Dependabot
- GitHub Docs — Actions usage and billing