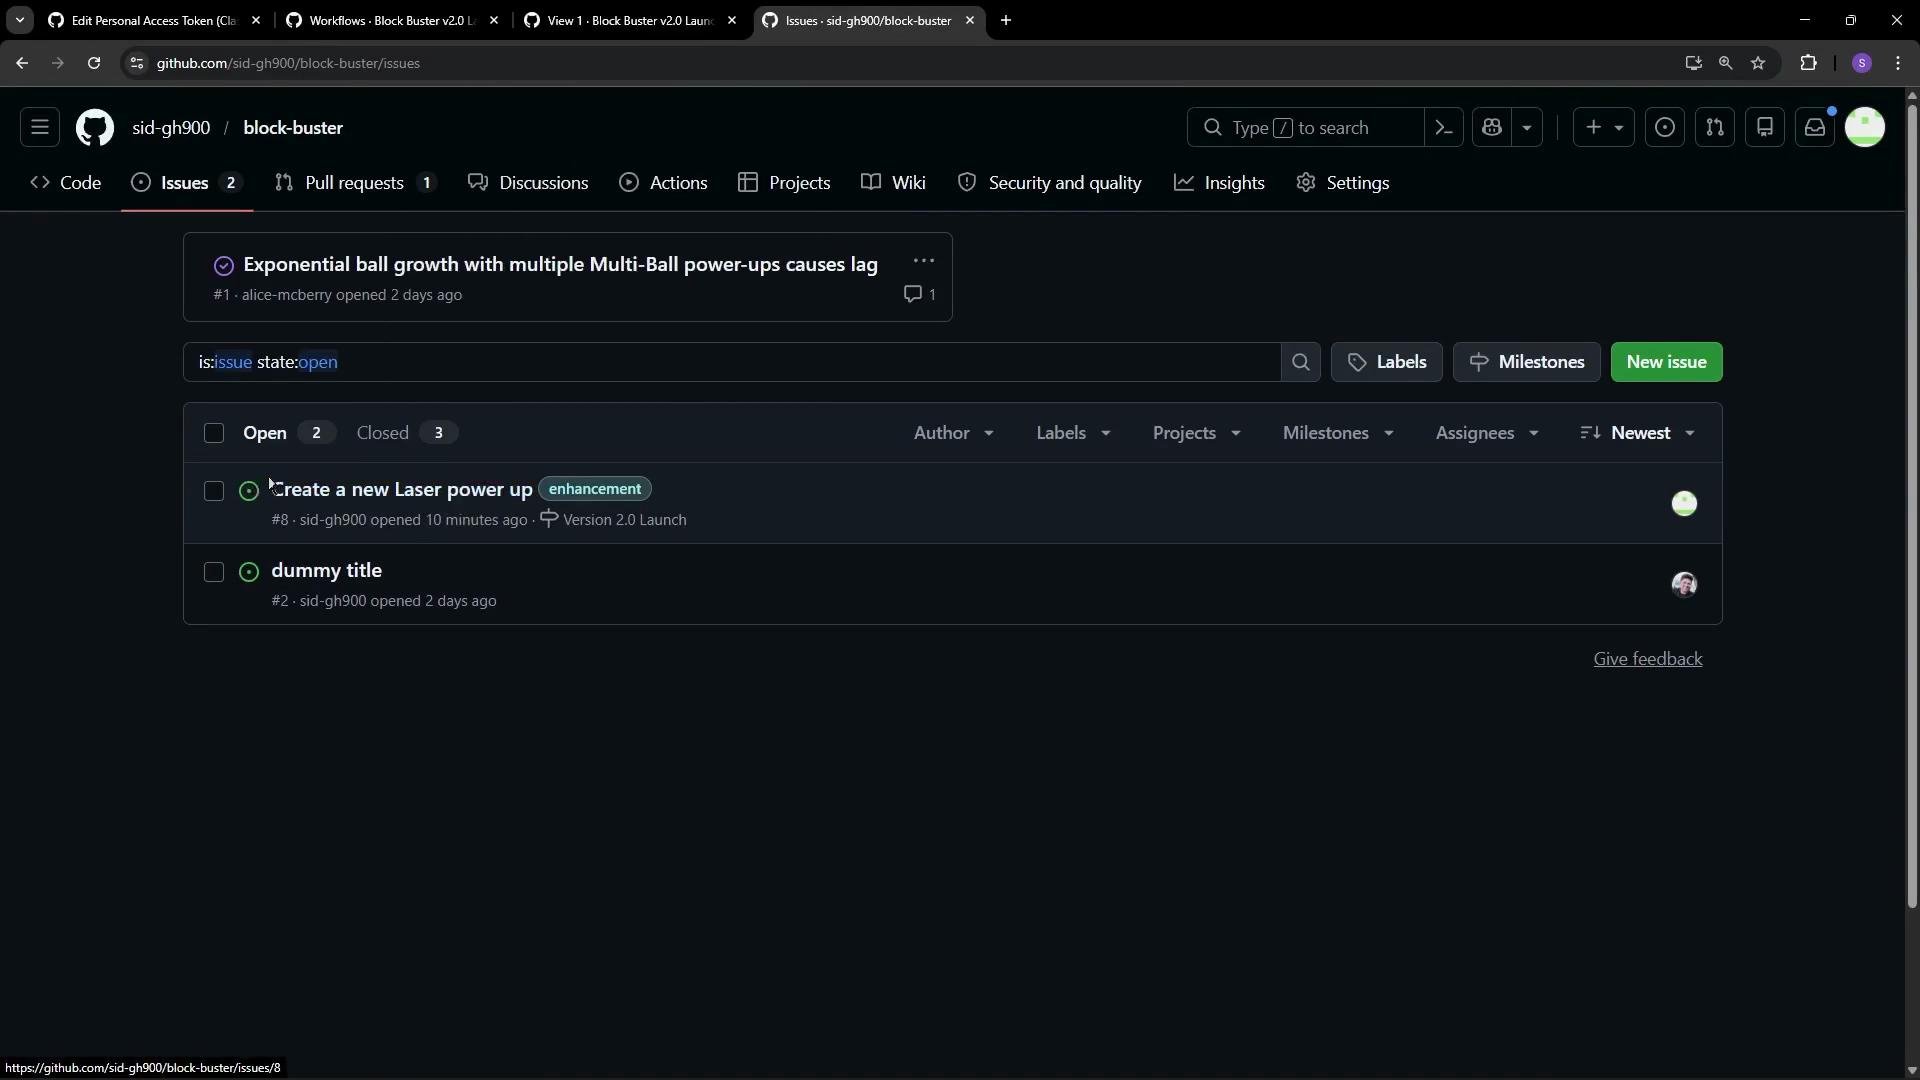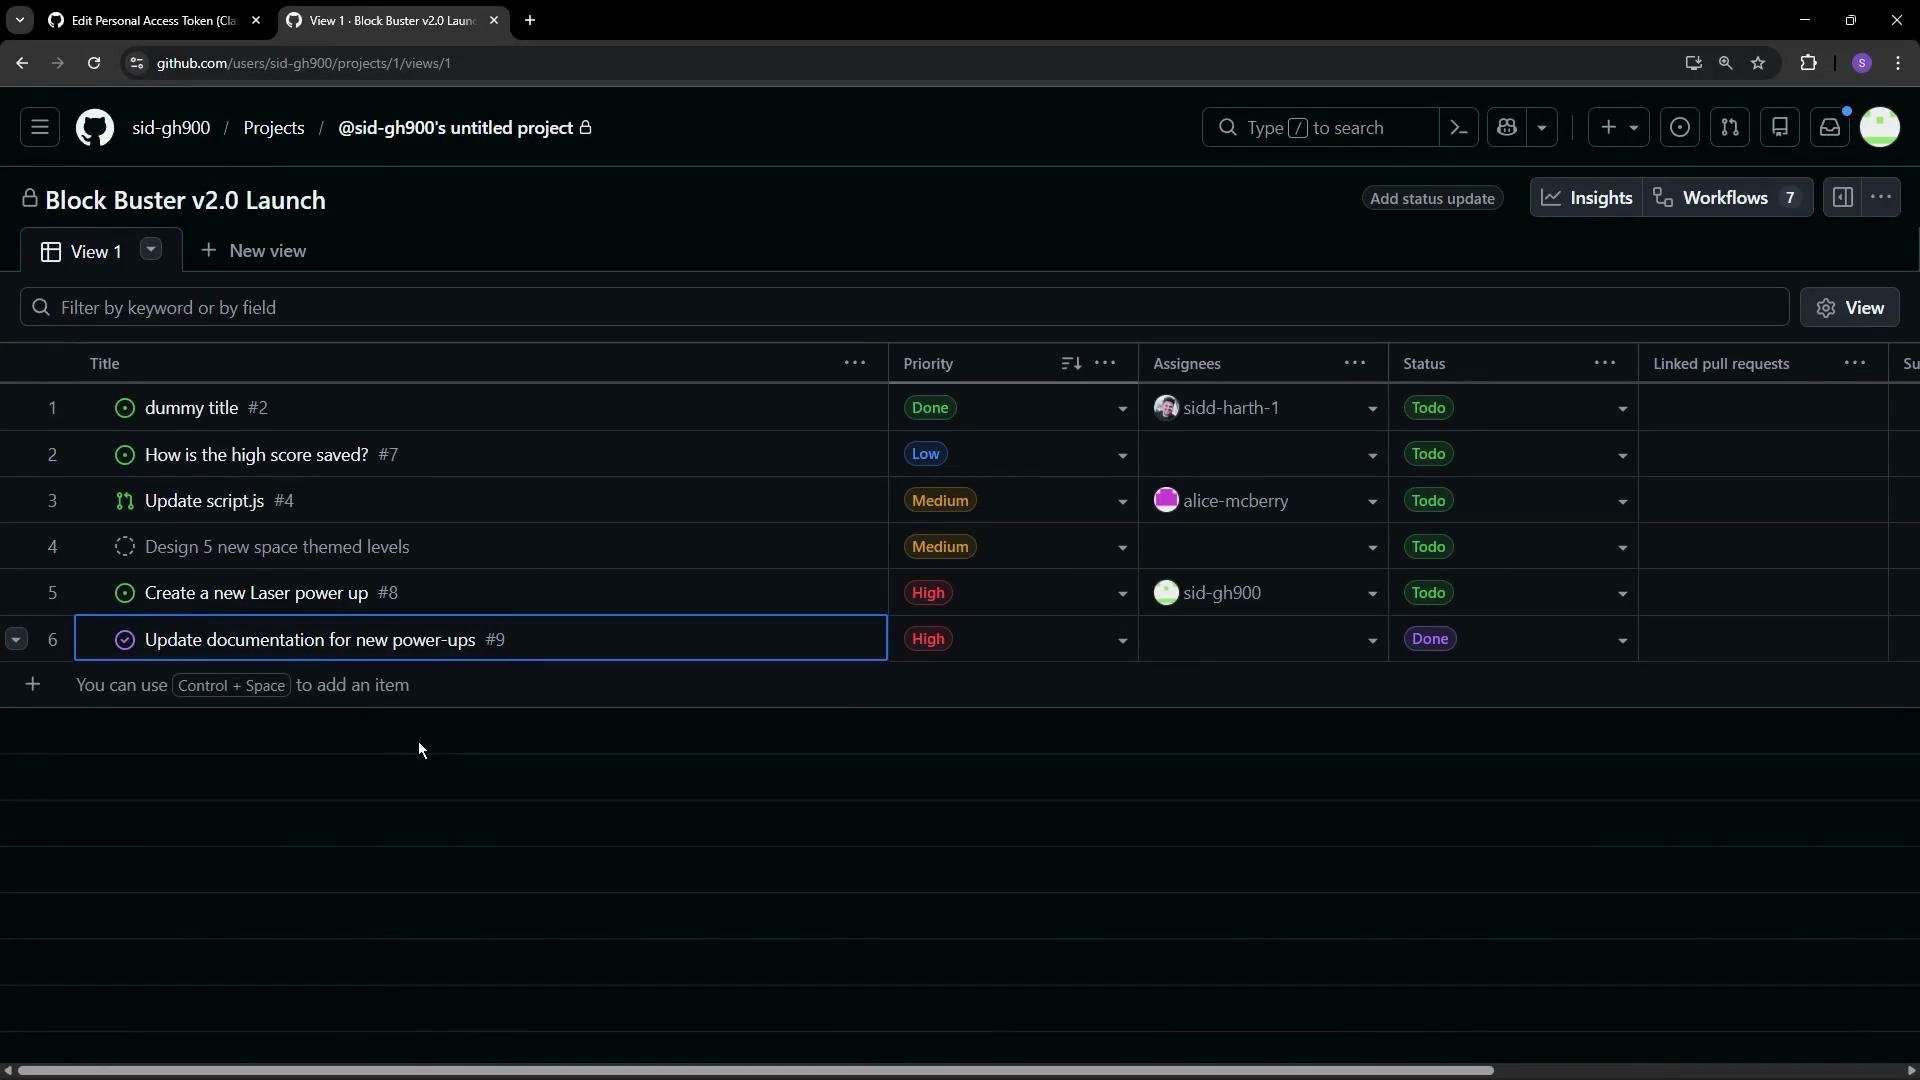
In this lesson we’ll examine how GitHub Projects keeps your board and repository in sync using project workflows (automation) and how the Insights dashboards help you measure progress over time. You’ll learn how board actions can trigger repository changes and how repository events can update cards on your board automatically. I’m back in the project view and the repository. Notice one of the issues on the project board has been automatically marked as closed.
The image shows a GitHub project board titled "Block Buster v2.0 Launch," listing tasks with priorities, assignees, and statuses.
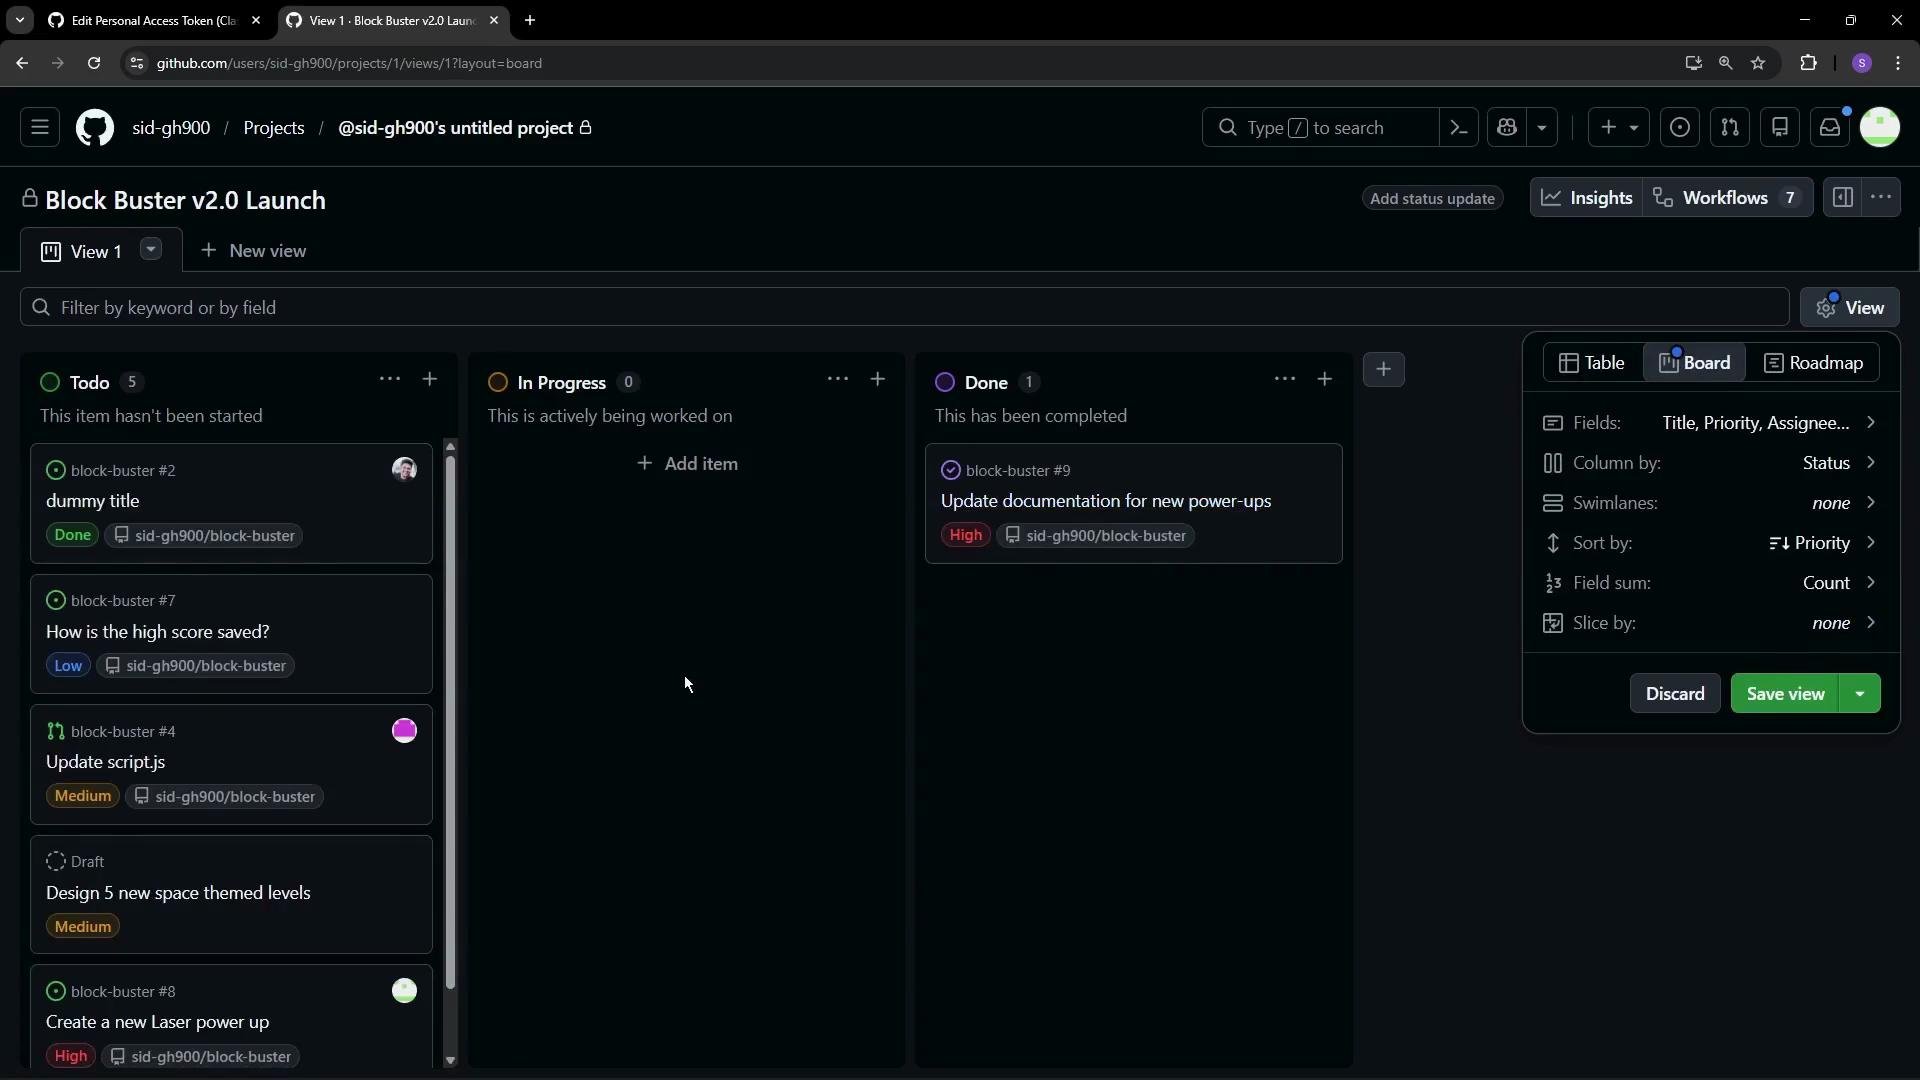
That card moved from the “To do” column to “Done” without manual intervention — project automation handled the update. Let’s step through how this synchronization works. Switching to the board view you can see the issue was moved to the Done column after it was closed in the repository’s Issues page.
The image shows a project management board on GitHub with columns for "Todo," "In Progress," and "Done," displaying tasks with different priorities.

How project automation works

Project automation is implemented as workflows powered by GitHub Actions. Some workflows are enabled by default, while others are available but disabled. You can enable, disable, or edit workflows to control how your project reacts to board or repository events.
Project automation in GitHub Projects runs as workflows backed by GitHub Actions. These workflows can react to board status changes, issue opens/closes, pull request events, and other triggers — keeping the project board and repository in sync.
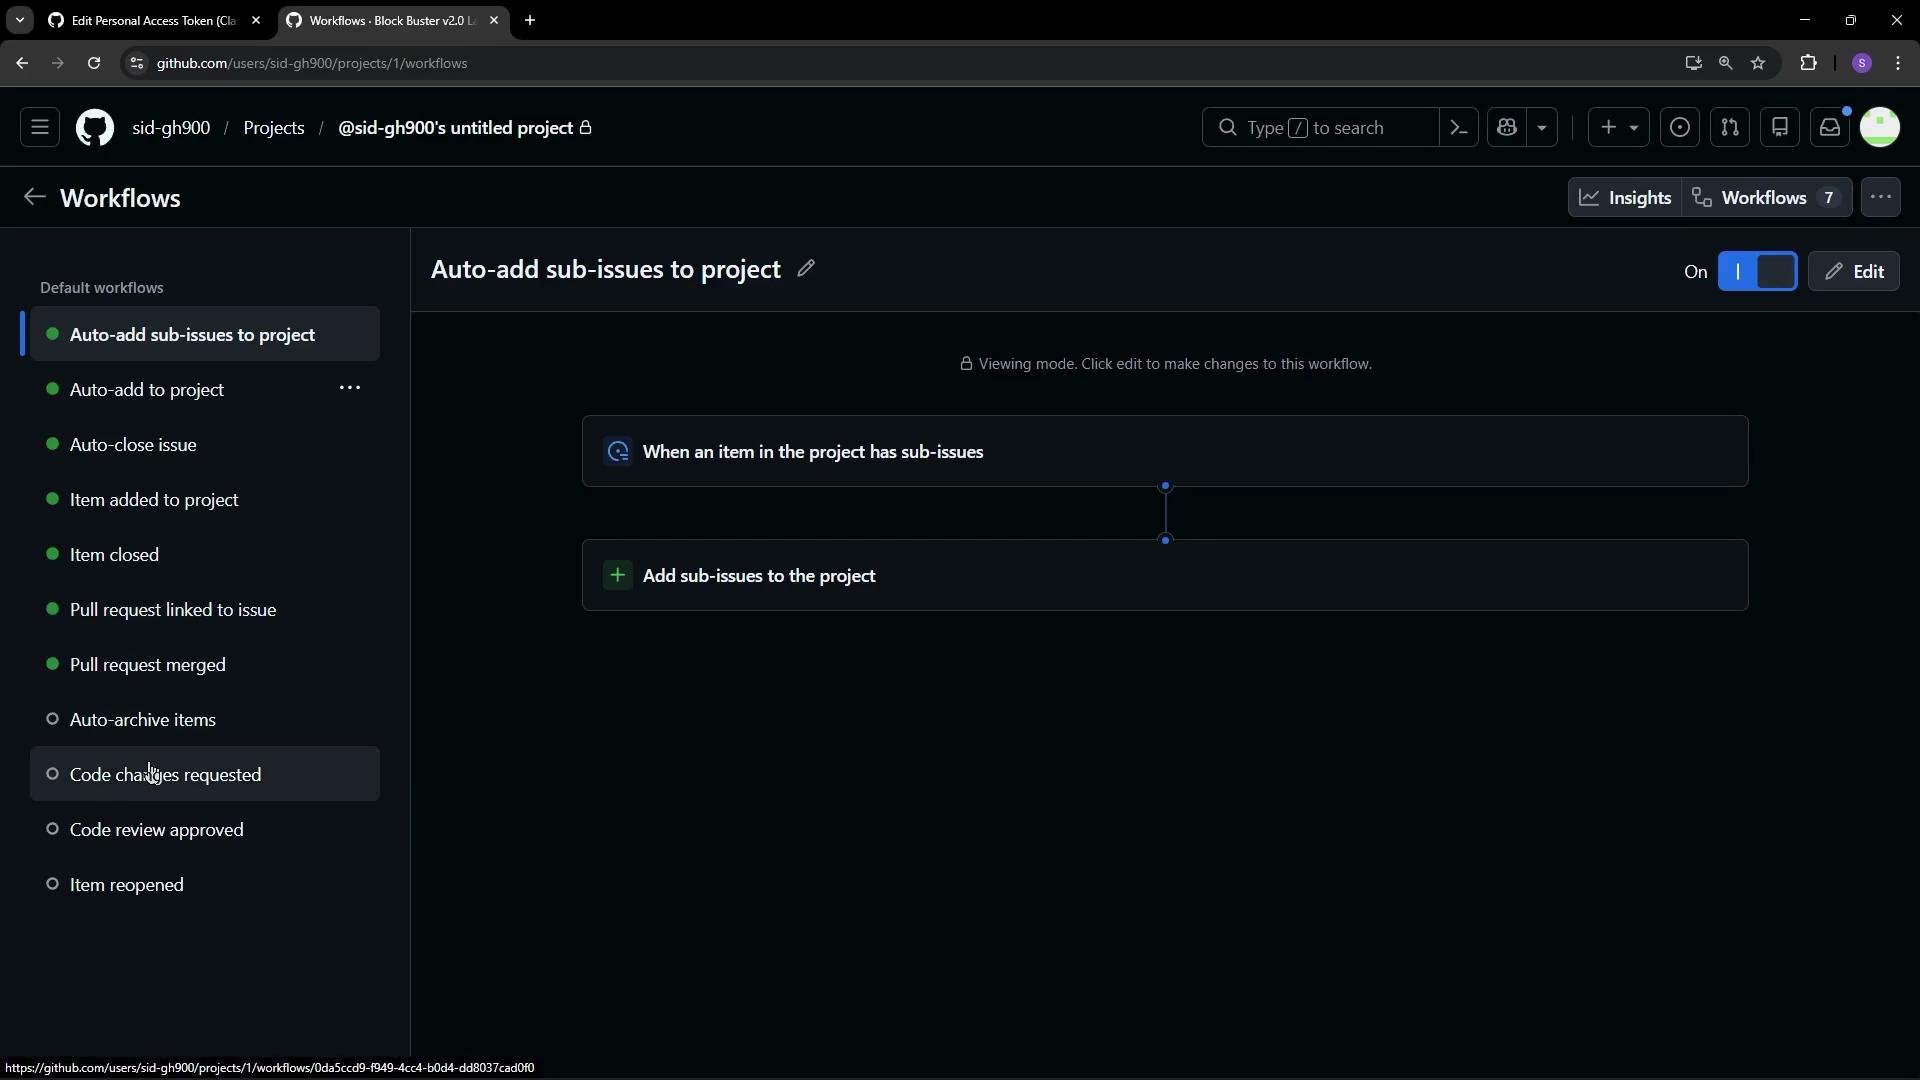
The project settings list several default workflows with clear behaviors. Common defaults include auto-adding child issues to a project, auto-closing issues when a card is marked Done, auto-archiving old items, and updating card status when an issue or PR is closed.
The image shows a GitHub project workflow interface with various workflow options listed on the left sidebar and a specific workflow titled "Auto-add sub-issues to project" displayed on the right.

Example: Auto-close issue workflow

The Auto-close issue workflow will close the associated issue in the repository when its project card status is changed to Done.
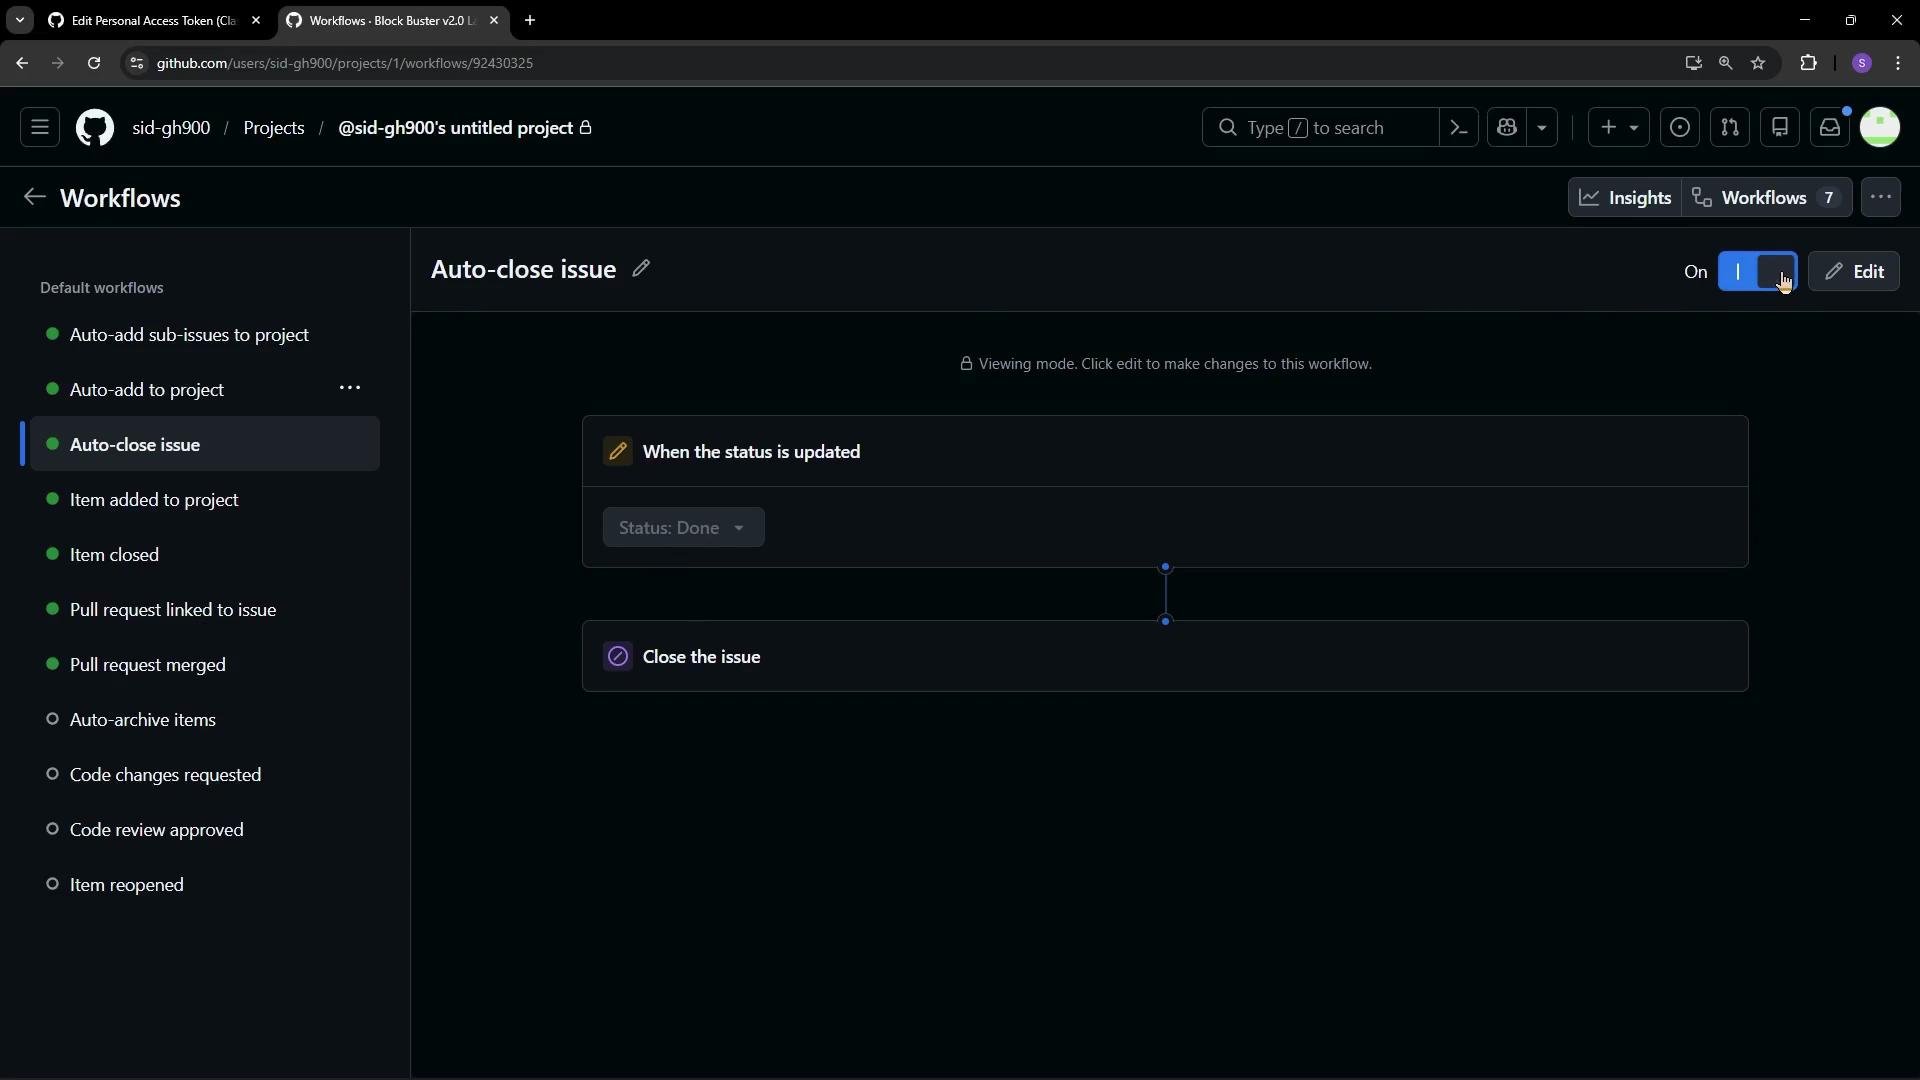
The image shows a GitHub interface displaying a workflow titled "Auto-close issue," where the action is set to close the issue when the status is updated to "Done".
To demonstrate, I changed the status of the “Create a new Laser power-up” card from To do to Done on the project board. That action triggered the workflow and automatically closed the issue in the repository. Initially, the issue was open in the repository Issues page:
The image shows a GitHub issues page for the repository "block-buster" with open issues, including "Create a new Laser power up" labeled as an enhancement.
After marking the card Done, the automation closed the issue. Refreshing the Issues page shows the item under closed issues. The reverse also works: the Item closed workflow updates a project card’s status to Done when the linked issue or pull request is closed. You can edit any workflow to change the triggers and actions, or disable it if you prefer manual control. Other default workflows you may encounter (often disabled) include auto-archive items, code change request, and item reopen — each automating a different project behavior.
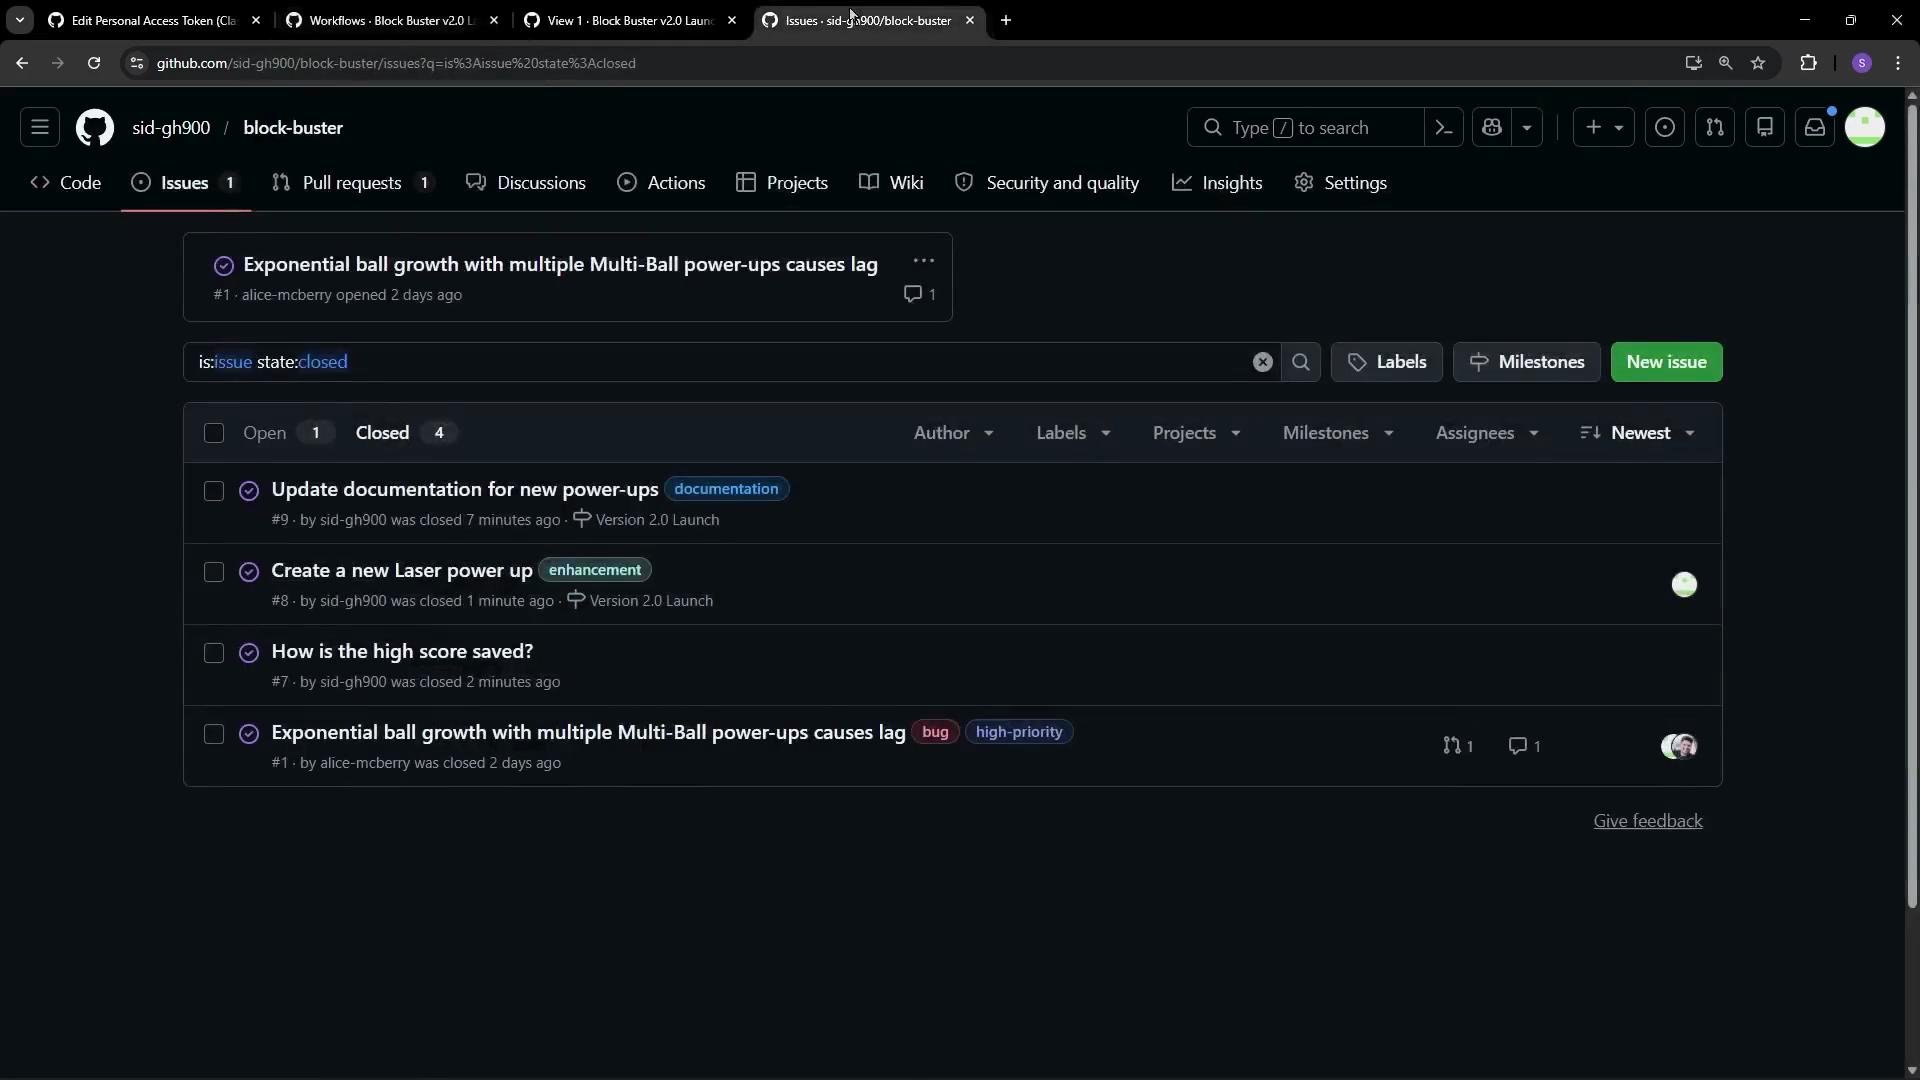
The image shows a GitHub Issues page for the repository "block-buster," listing closed issues related to power-ups and performance, with labels like "documentation" and "enhancement."

Quick reference: Default project workflows

(States can vary by repository or organization; check your project settings to confirm.)

Insights: charts and metrics for project health

The Insights section provides charts and metrics to help you monitor project progress over time. The default visualization is the Burn up chart, which shows the count of open vs. completed items across a chosen time range.
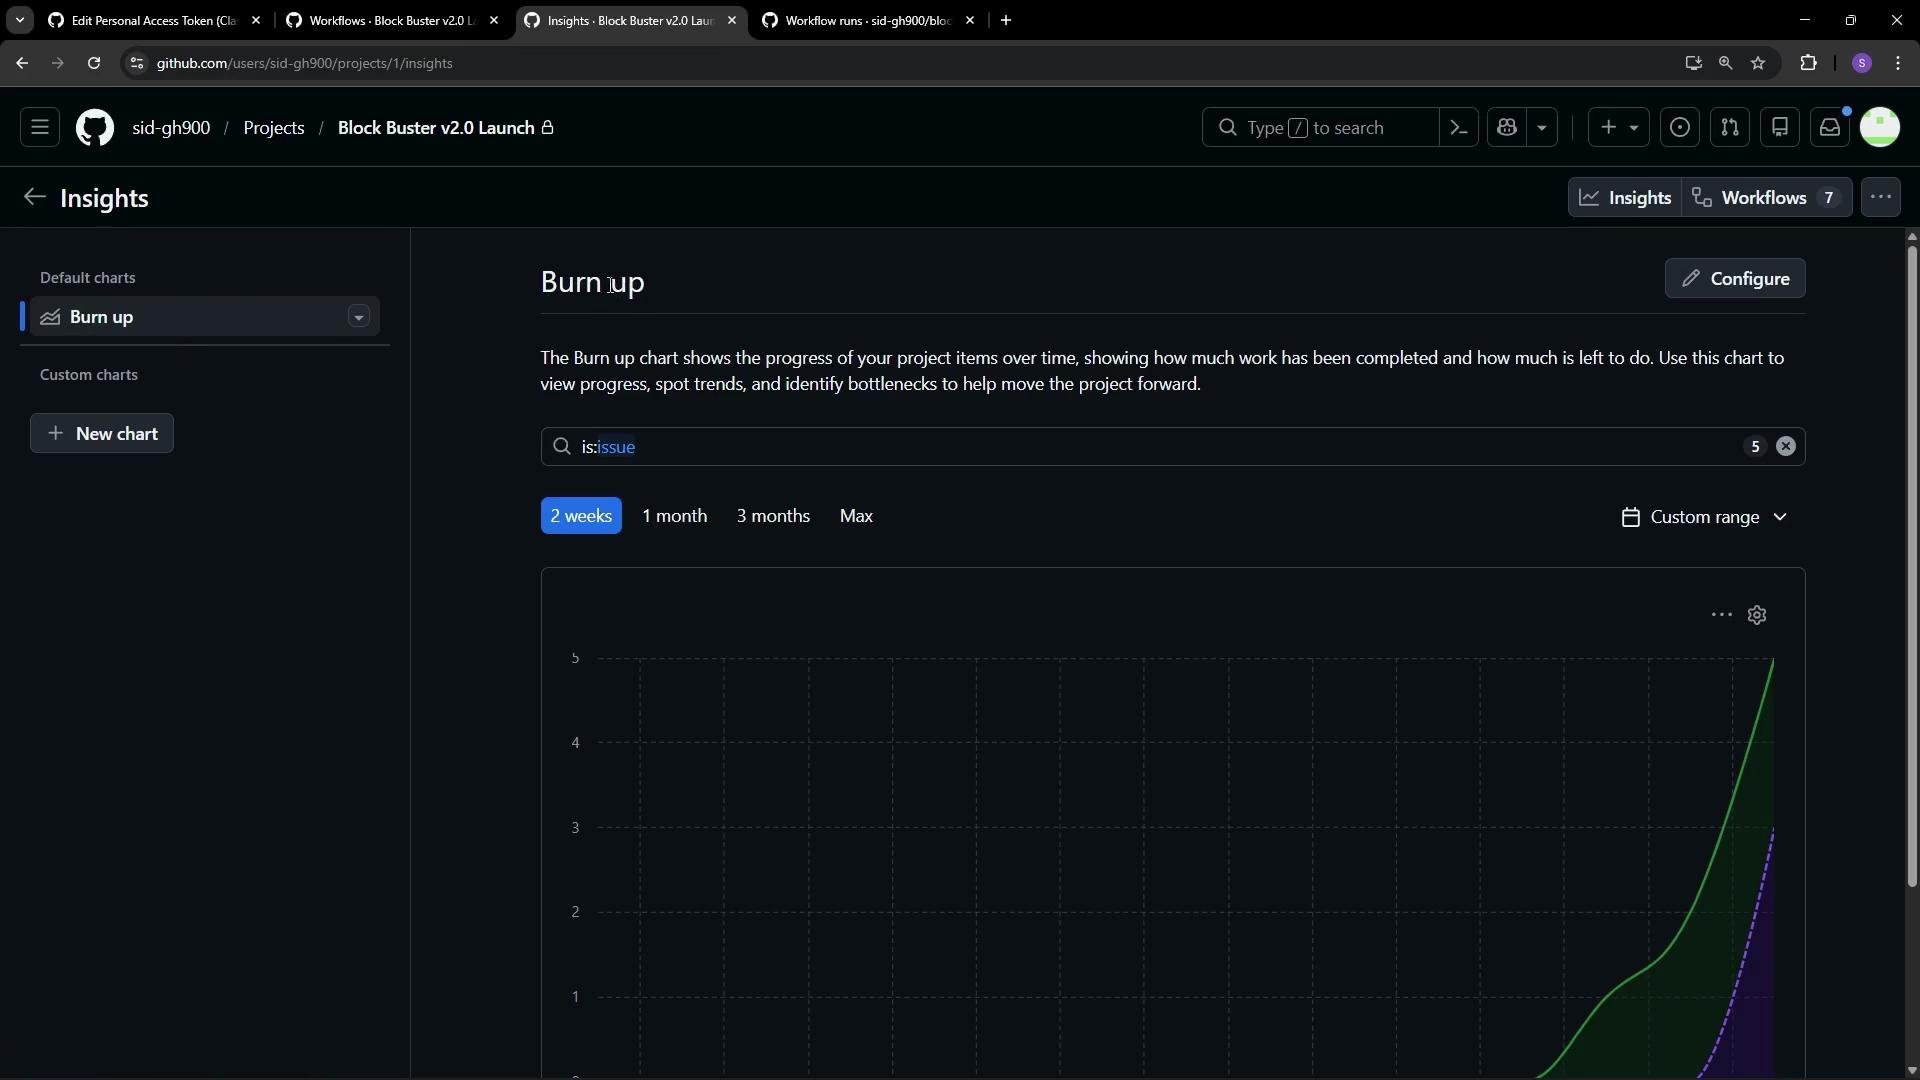
The image shows a GitHub Insights page with a "Burn up" chart, displaying project progress over time and options to view data over different time frames. The chart helps in identifying progress and trends for managing projects.
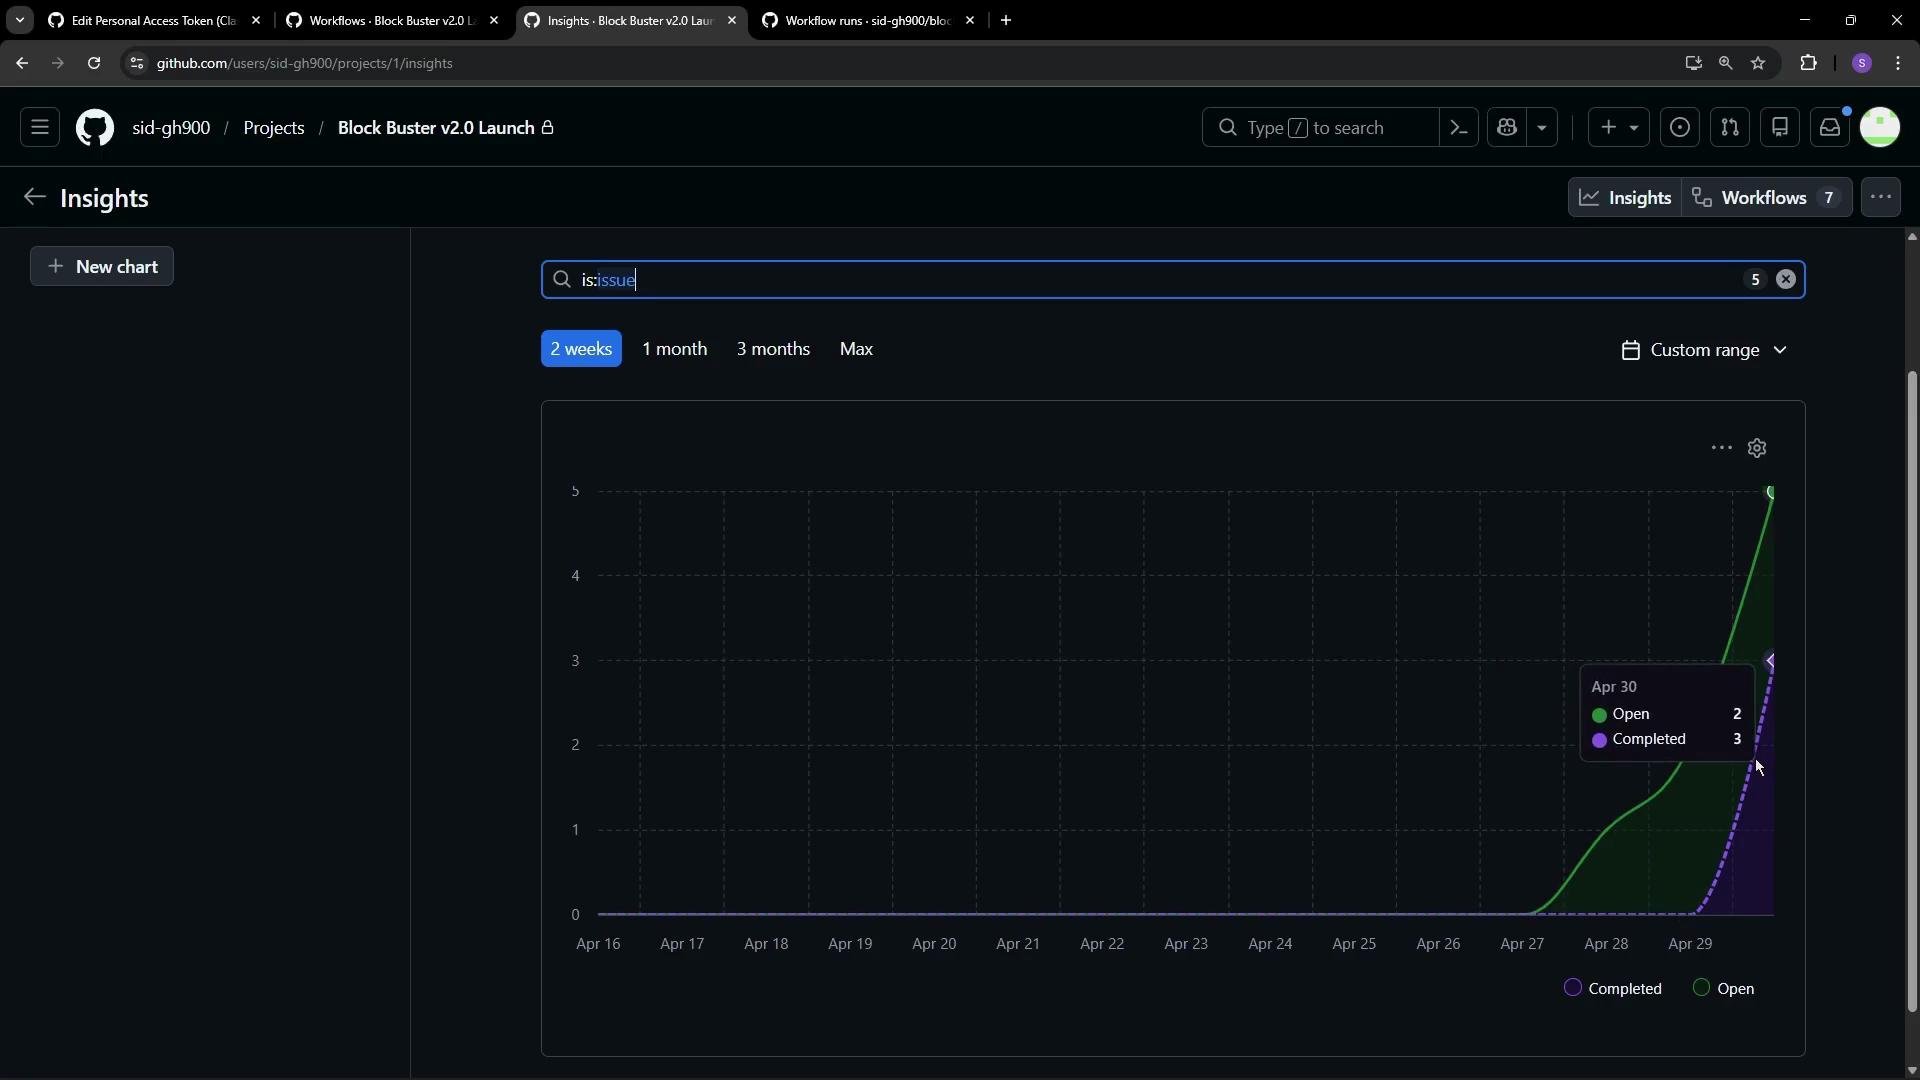
By default the chart may display the last two weeks. The green line represents currently open items and the purple line represents closed items. You can adjust:
  • Time range (last week, two weeks, month, custom)
  • Data scope (issues, pull requests, or both)
  • Visualization type (burn up, stacked column, x–y axis)
  • Grouping (milestones, assignees, labels)
These options let you create custom charts that surface the metrics most important to your workflow.
The image shows a GitHub Insights graph displaying the progress of open and completed issues over a two-week period. The graph indicates a rise in both open and completed issues towards the end of April.
Use Insights to identify trends (e.g., rising open items, burst of completions) and to refine workflows or team priorities. Combining automation and Insights gives you both control (via workflows) and visibility (via charts), enabling more predictable project delivery.

Watch Video