

These three layouts — Table, Board, and Roadmap — are complementary. Use the view that fits your current task and switch when necessary; all changes remain synchronized across views so your project data stays consistent.
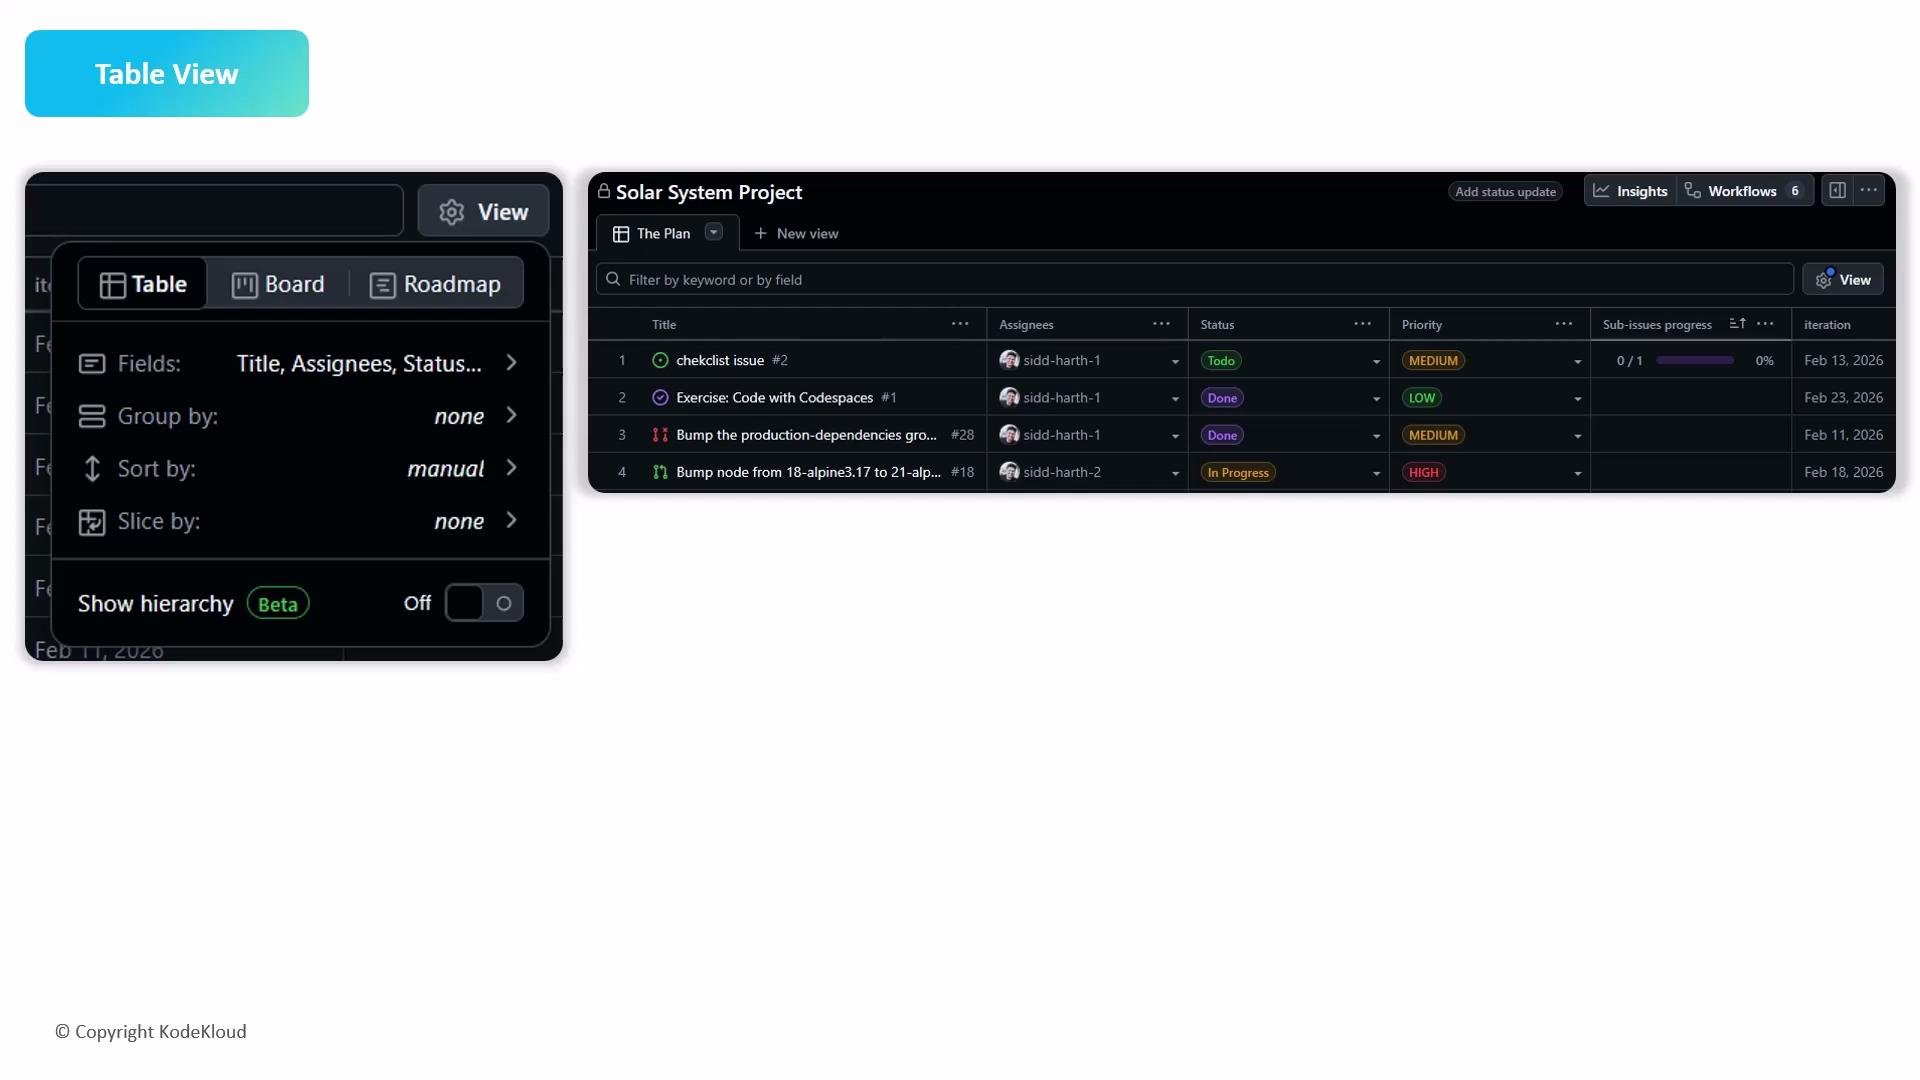
Table view (data-centric)
The Table view provides a spreadsheet-like interface for managing large volumes of issues and pull requests. It’s optimized for high-density data management, bulk editing, and detailed analysis. Key uses:- Rapid data entry and bulk updates across many items
- Sorting, filtering, and grouping by custom fields (priority, estimate, team, etc.)
- Viewing all project metadata in rows and columns for easy reporting
- Use filters and saved views to focus on specific slices of work (e.g., by team or priority).
- Leverage custom fields to surface the exact columns you need for status reporting.
Board view (process-centric)
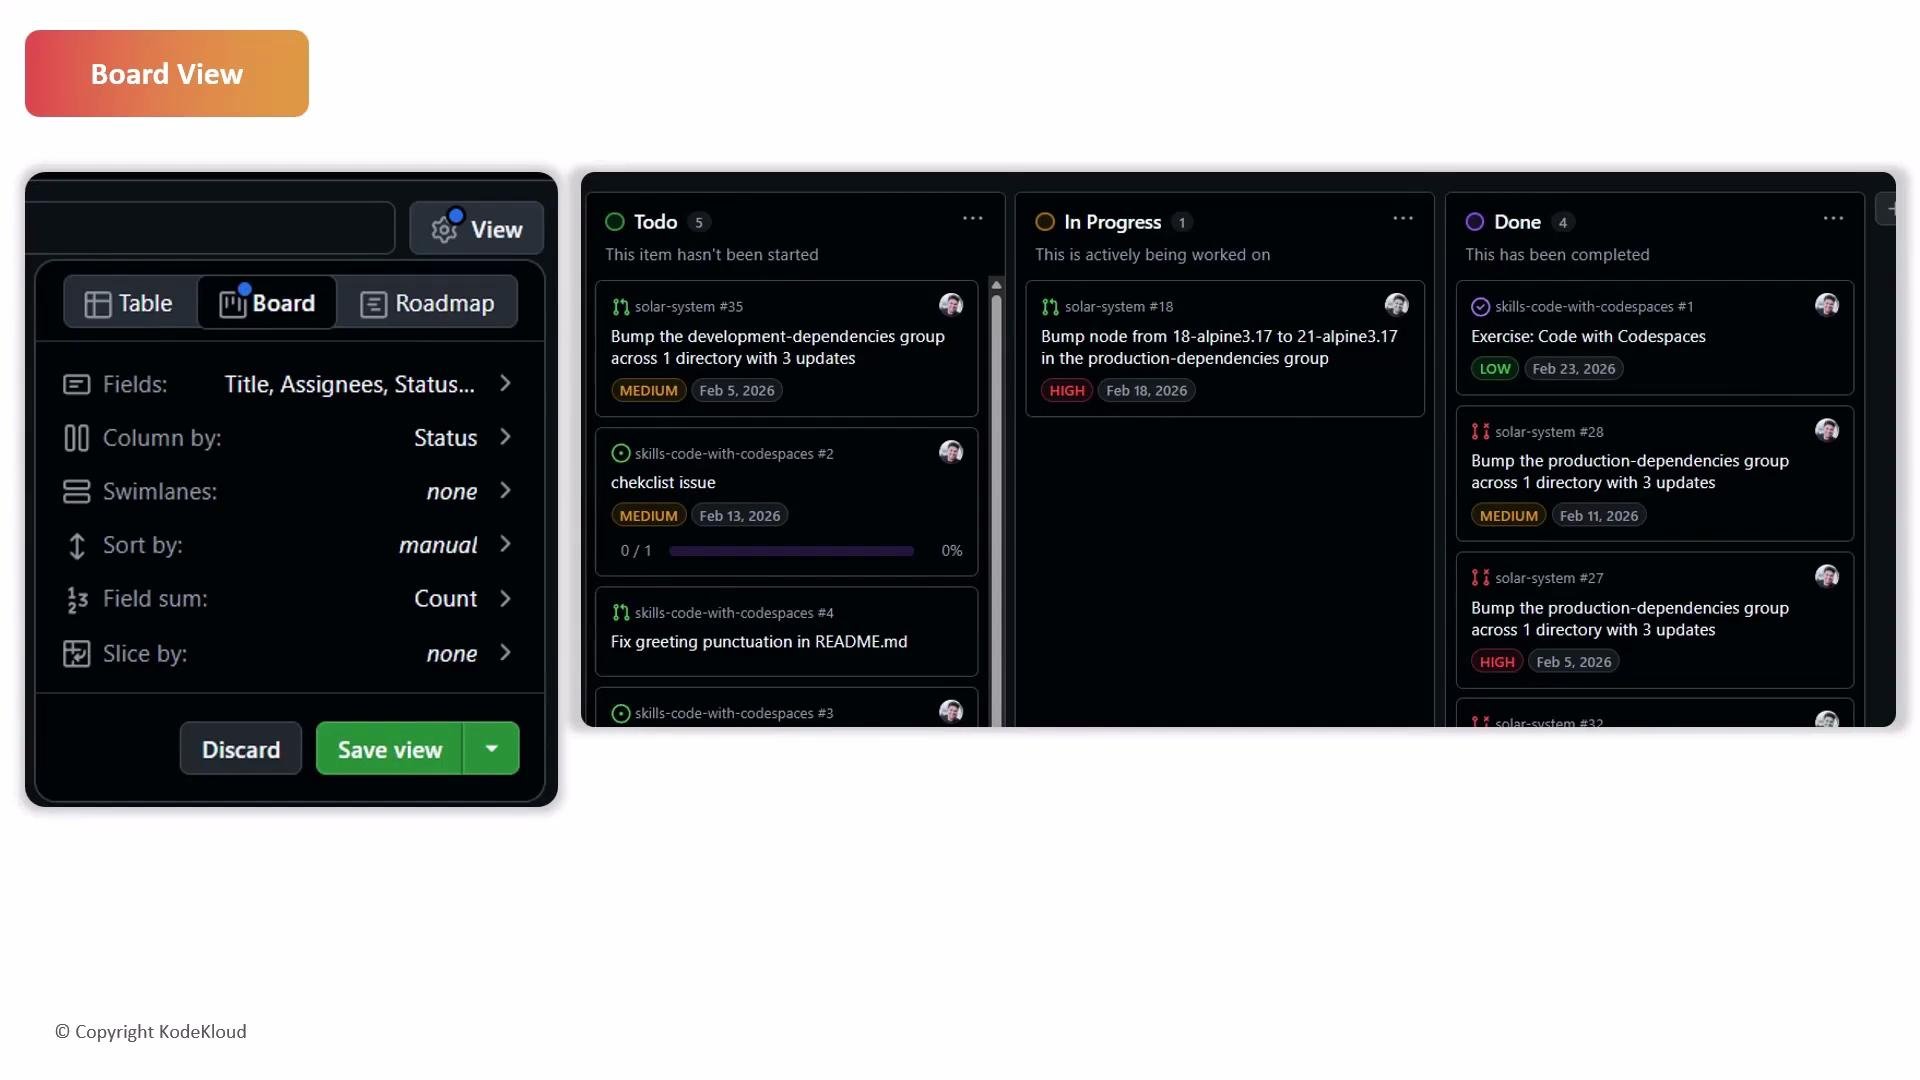
The Board view presents a Kanban-style layout to track the movement of work through your workflow. It’s ideal for day-to-day progress monitoring and for visualizing the status of individual items. Best for:- Managing work-in-progress and identifying bottlenecks
- Moving cards between columns (Backlog, In Progress, Done) to reflect current state
- Customizing columns, fields, and filters; creating swimlanes by grouping cards into rows
Roadmap view (time-centric)
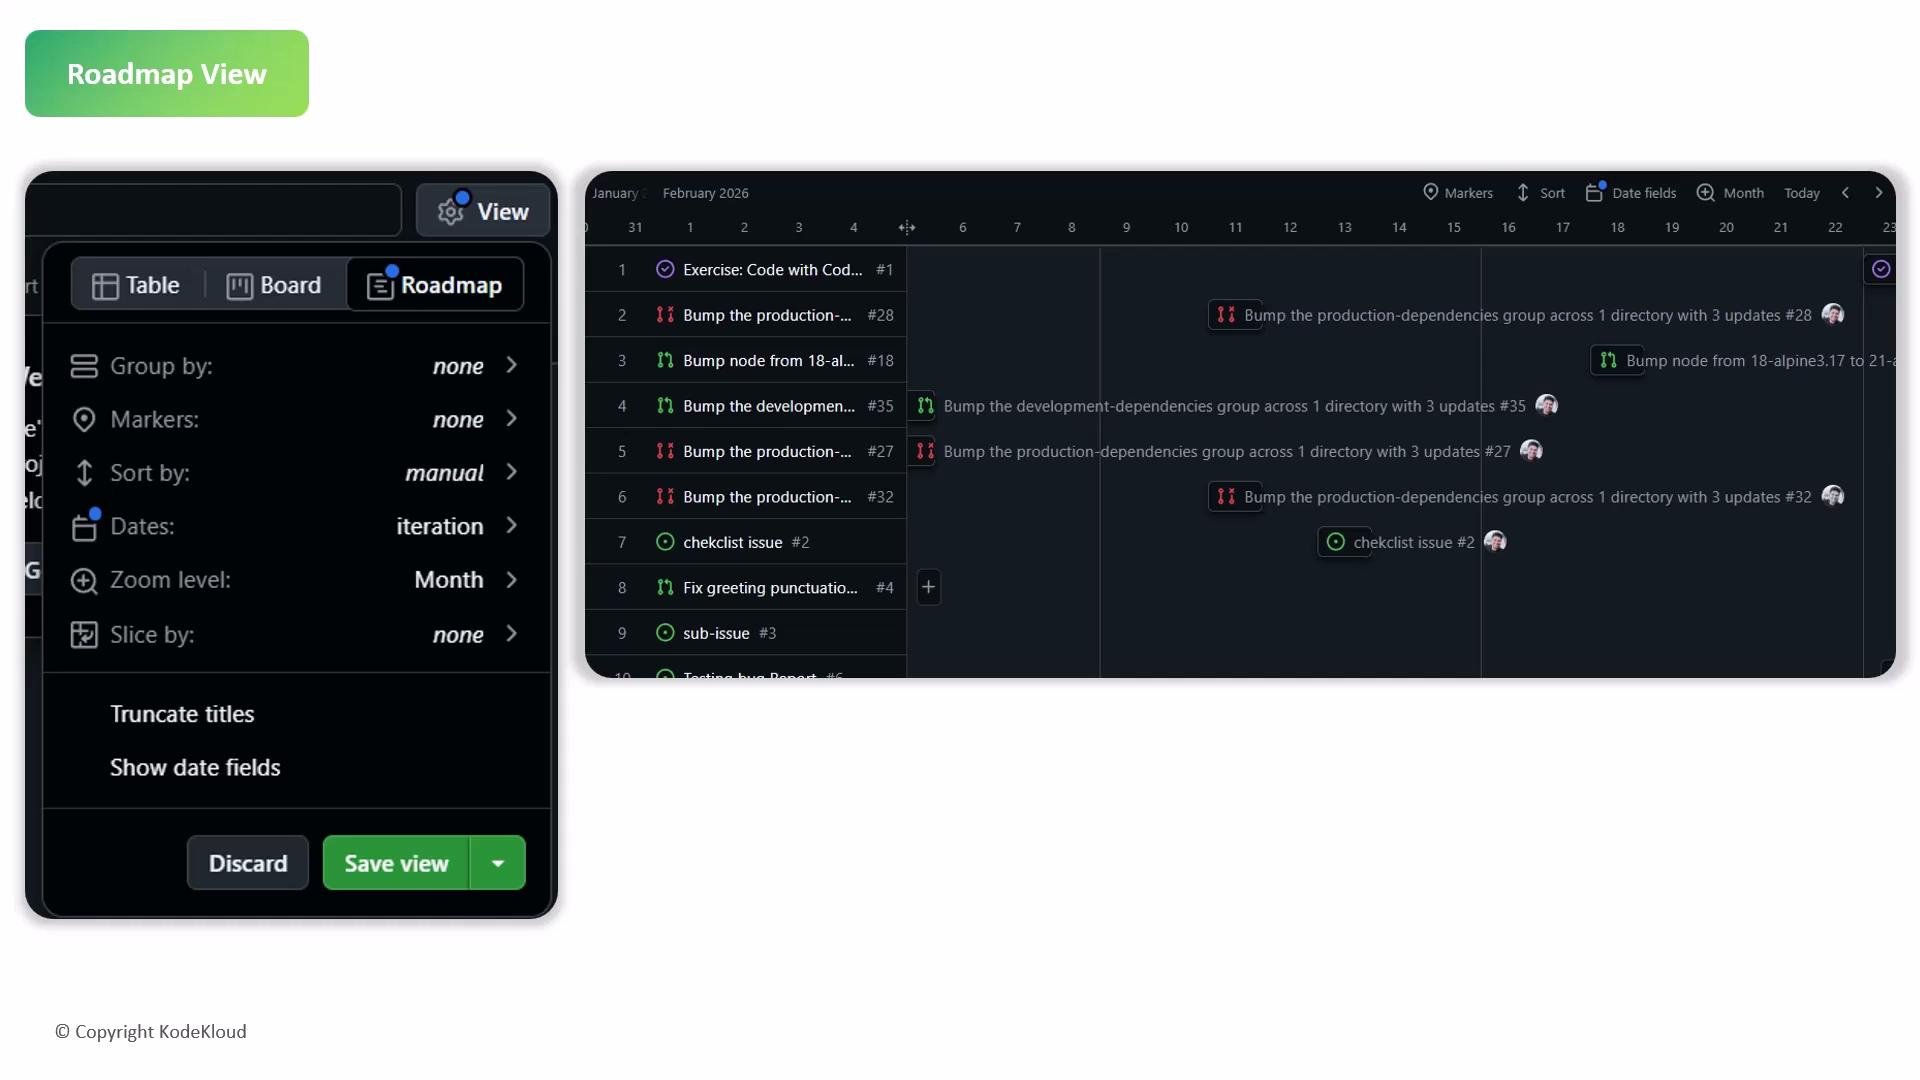
The Roadmap view shows a timeline of milestones and deliverables, mapping start and target (or due) dates across a horizontal calendar. Use this layout for long-term planning and communicating schedule progress to stakeholders. When to use it:- Planning releases and tracking deadlines
- Visualizing task duration and sequencing across weeks or months
- Detecting scheduling conflicts and aligning development velocity with upcoming milestones
Quick comparison
How teams combine views
- Use Table for intake and bulk edits (triage, labeling, estimates).
- Use Board to manage daily work and enforce workflow policies.
- Use Roadmap for release planning, stakeholder updates, and dependency visualization.
Links and references
Tip: Create saved views and templates for recurring workflows (e.g., sprint planning, release triage) to reduce setup time and ensure consistency across your team.