- Unified network health dashboard with per-resource health states (Available, Degraded, Unavailable).
- Deep traffic visibility via Traffic Analytics (top talkers, flow patterns, bandwidth usage).
- Integrated troubleshooting with Network Watcher tools such as Connection Monitor and Packet Capture.
- Proactive alerting for critical network failures.
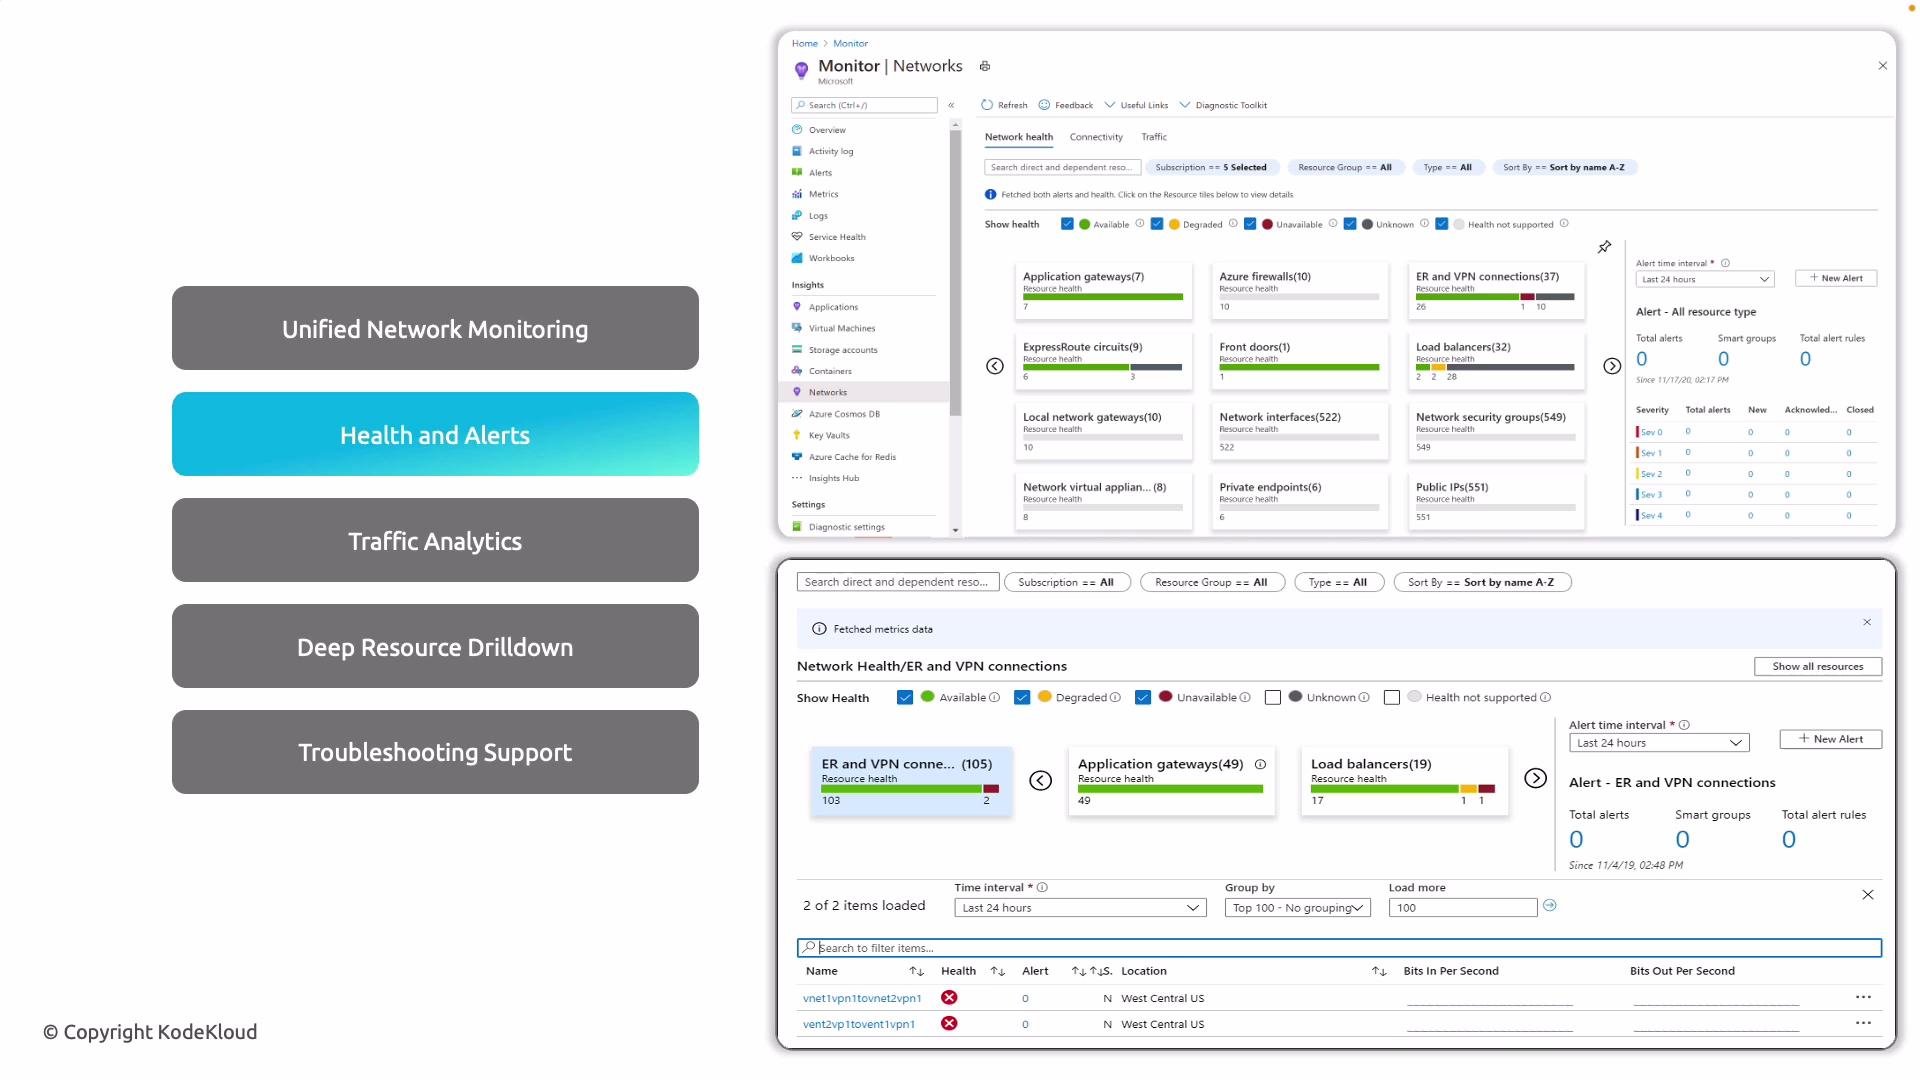
What Network Insights monitors
Network Insights consolidates health, connectivity status, and performance metrics across network resources. Instead of manually aggregating logs, you get structured views and drill-downs that speed up root-cause analysis. Highlights:- Health rollups and per-resource health indicators.
- Telemetry for throughput, packet drops, and latency.
- Traffic Analytics and NSG flow log integration for traffic pattern analysis.
- Diagnostics links to Packet Capture, Connection Monitor, and other Network Watcher tools.
Traffic Analytics
Traffic Analytics (built on Network Watcher) provides actionable insights into traffic flows and capacity planning:- Identify top talkers, application-level traffic patterns, and bandwidth hotspots.
- Detect asymmetric routing, unexpected spikes, or potential throughput bottlenecks.
- Use Traffic Analytics to prioritize remediation and plan scaling or routing changes.
To use Traffic Analytics and many Network Watcher features you may need to enable
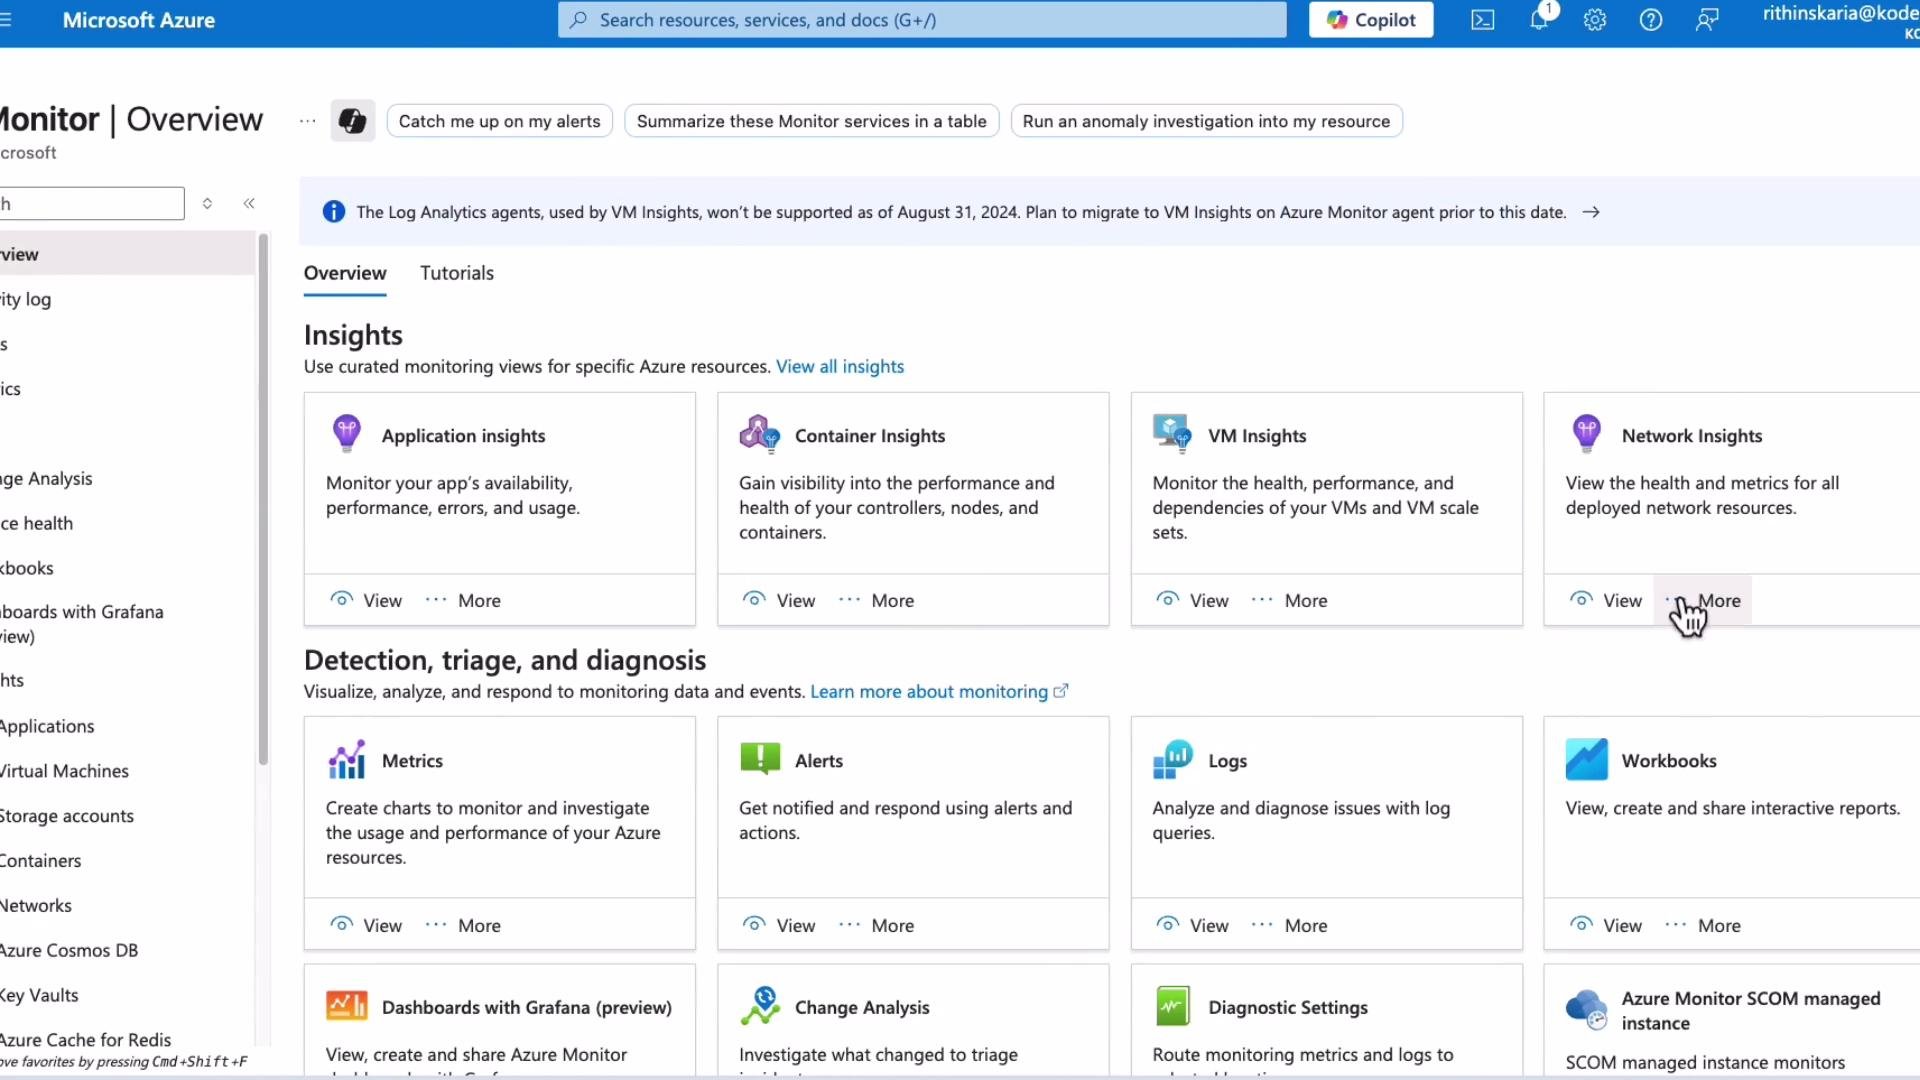
Network Watcher in the target region and enable diagnostic settings (for example, NSG Flow Logs). Ensure you have the required permissions and that diagnostic settings are configured for the resources you wish to monitor.Exploring Network Insights in the Azure portal
The Azure portal surfaces Network Insights under Azure Monitor > Insights > Networks. The layout is consistent across subscriptions; demo subscriptions may show limited telemetry but the interface remains the same. Steps to navigate:- Open Azure Monitor in the portal and select Insights.
- Choose Networks (expand the Insights menu if it’s not visible).
- Browse the inventory of networking components (NICs, NSGs, private endpoints, public IPs, VNets, gateways).
- Select a resource to open its blade and view metrics, health, and diagnostic links.
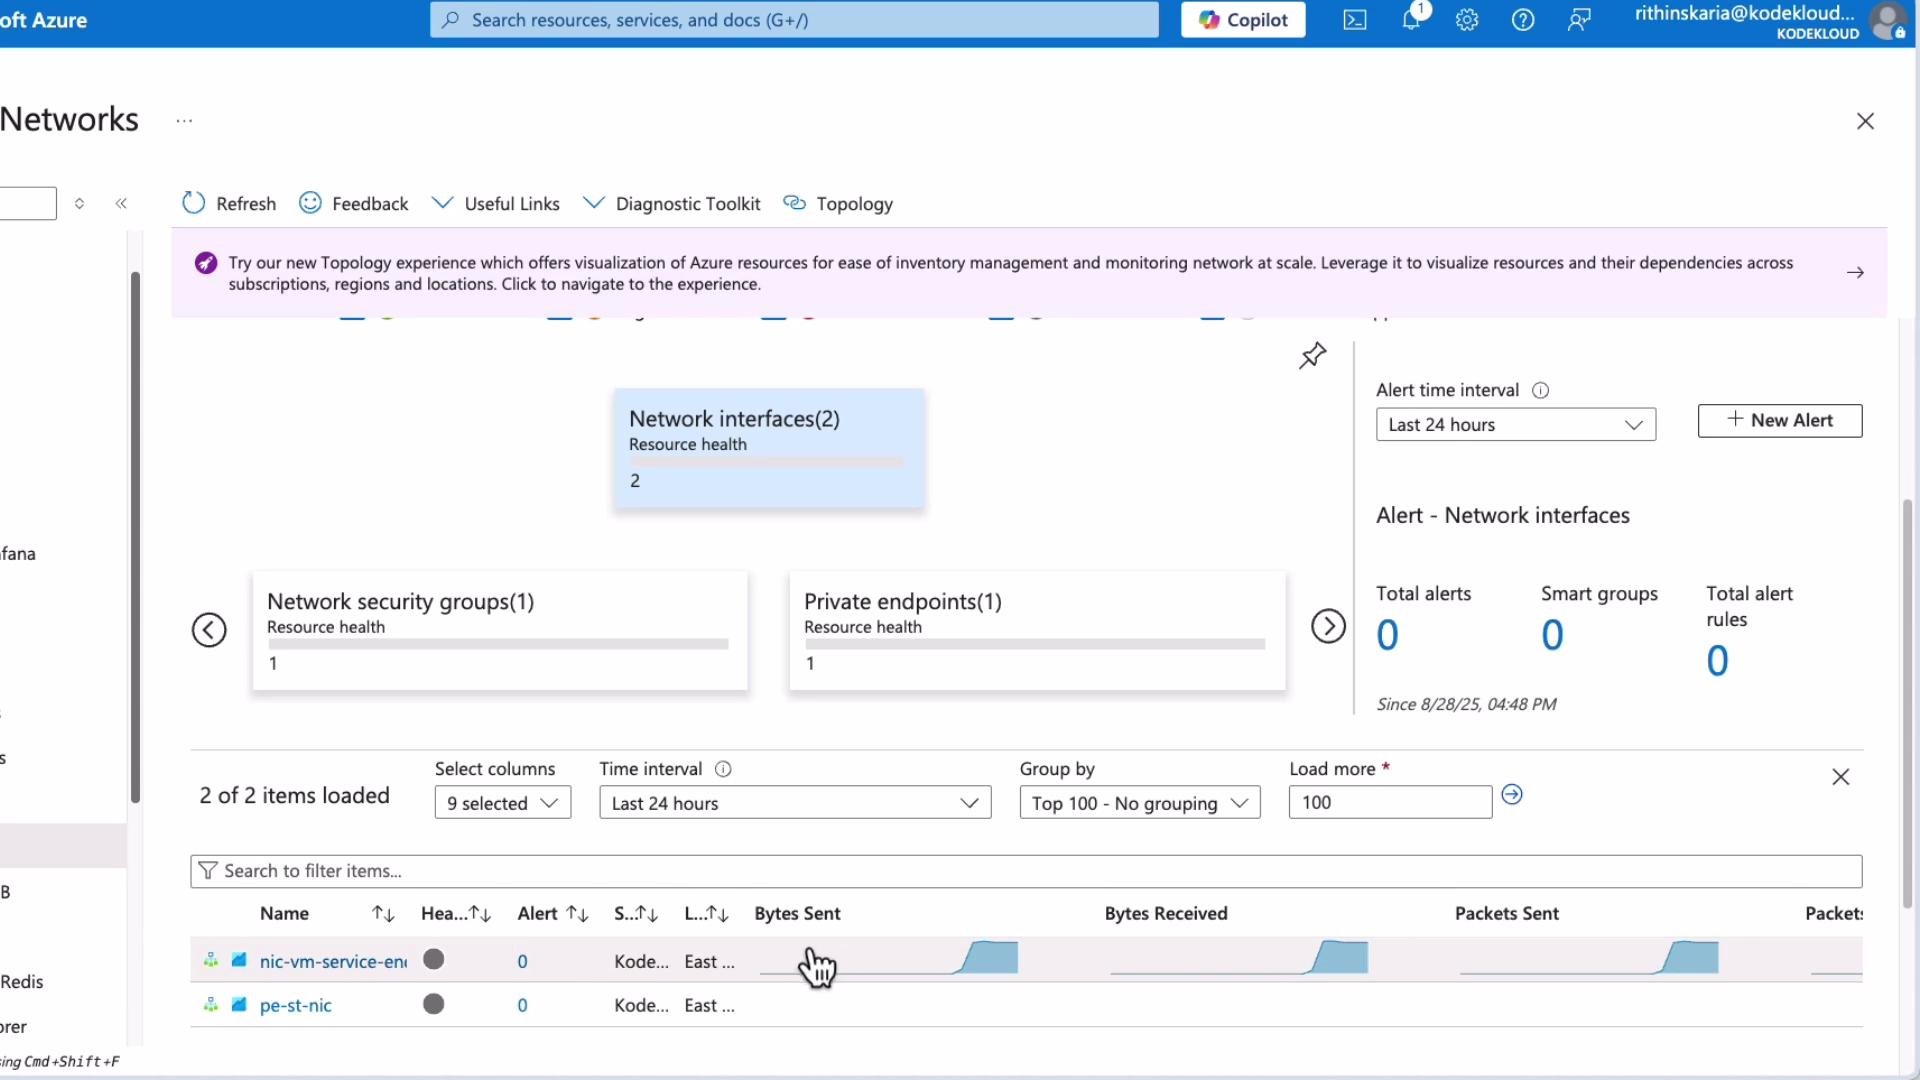
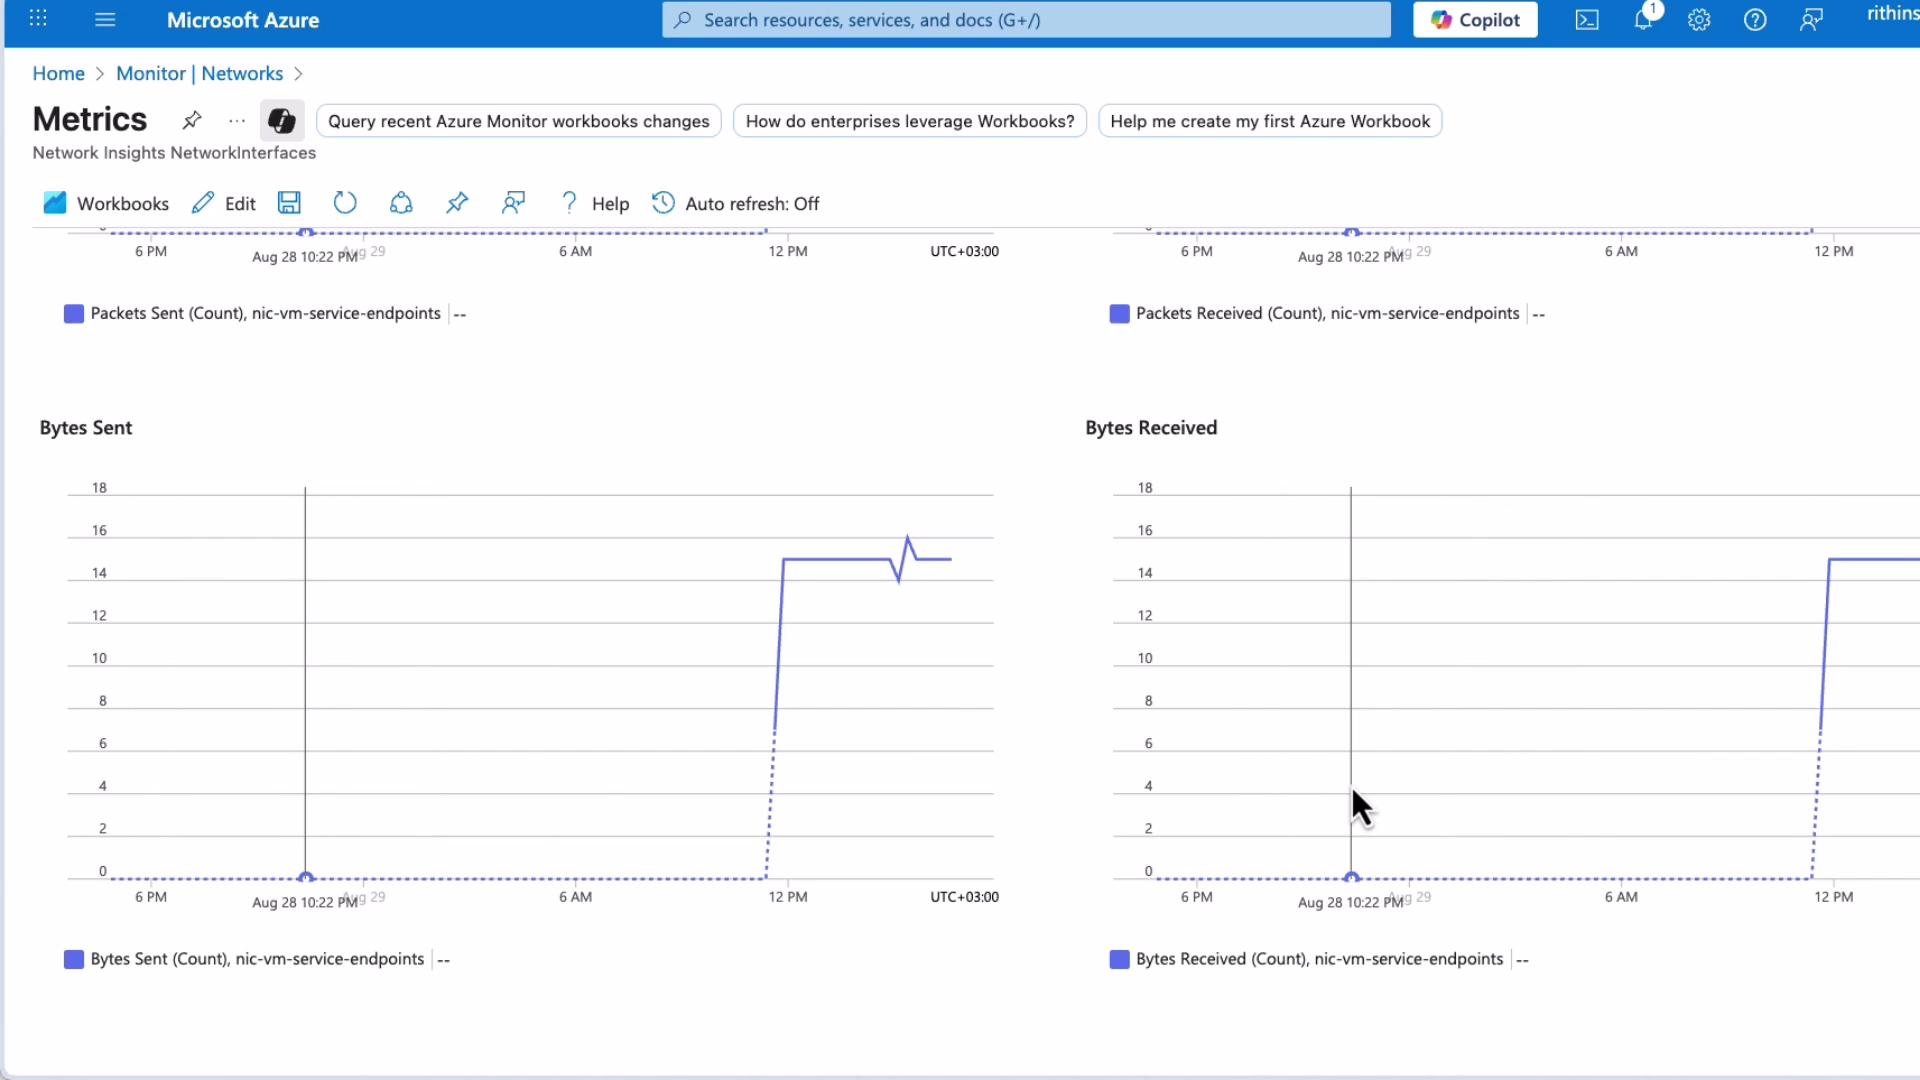
Resource overview and typical metrics
Best practices
- Enable Network Watcher in each region where you have resources to capture regional diagnostics.
- Turn on NSG Flow Logs and send them to a Log Analytics workspace to enable Traffic Analytics.
- Configure proactive alerts for critical thresholds and health-state changes.
- Use workbooks and prebuilt visualizations for faster root-cause analysis and recurring reporting.
Links and references
- Azure Monitor documentation: https://learn.microsoft.com/azure/azure-monitor/
- Network Watcher overview: https://learn.microsoft.com/azure/network-watcher/
- Traffic Analytics overview: https://learn.microsoft.com/azure/network-watcher/traffic-analytics