Recommended tools
Use these Azure-native and community tools for monitoring and diagnosing connectivity, throughput, and latency issues:- Azure Network Watcher — packet capture, topology, connection troubleshoot: https://learn.microsoft.com/azure/network-watcher/network-watcher-monitoring-overview
- Azure CLI — scripting and automation for Azure resources: https://learn.microsoft.com/cli/azure/
- Azure PowerShell — manage Azure resources from PowerShell: https://learn.microsoft.com/azure/powershell/
- Azure Connectivity Toolkit (AzCTK) — a PowerShell toolkit for end-to-end network diagnostics: https://github.com/microsoft/Azure-Connectivity-Toolkit
AzCTK overview and common cmdlets
AzCTK provides cmdlets that replicate real-world TCP behavior across different session counts and window sizes. Useful cmdlets include:
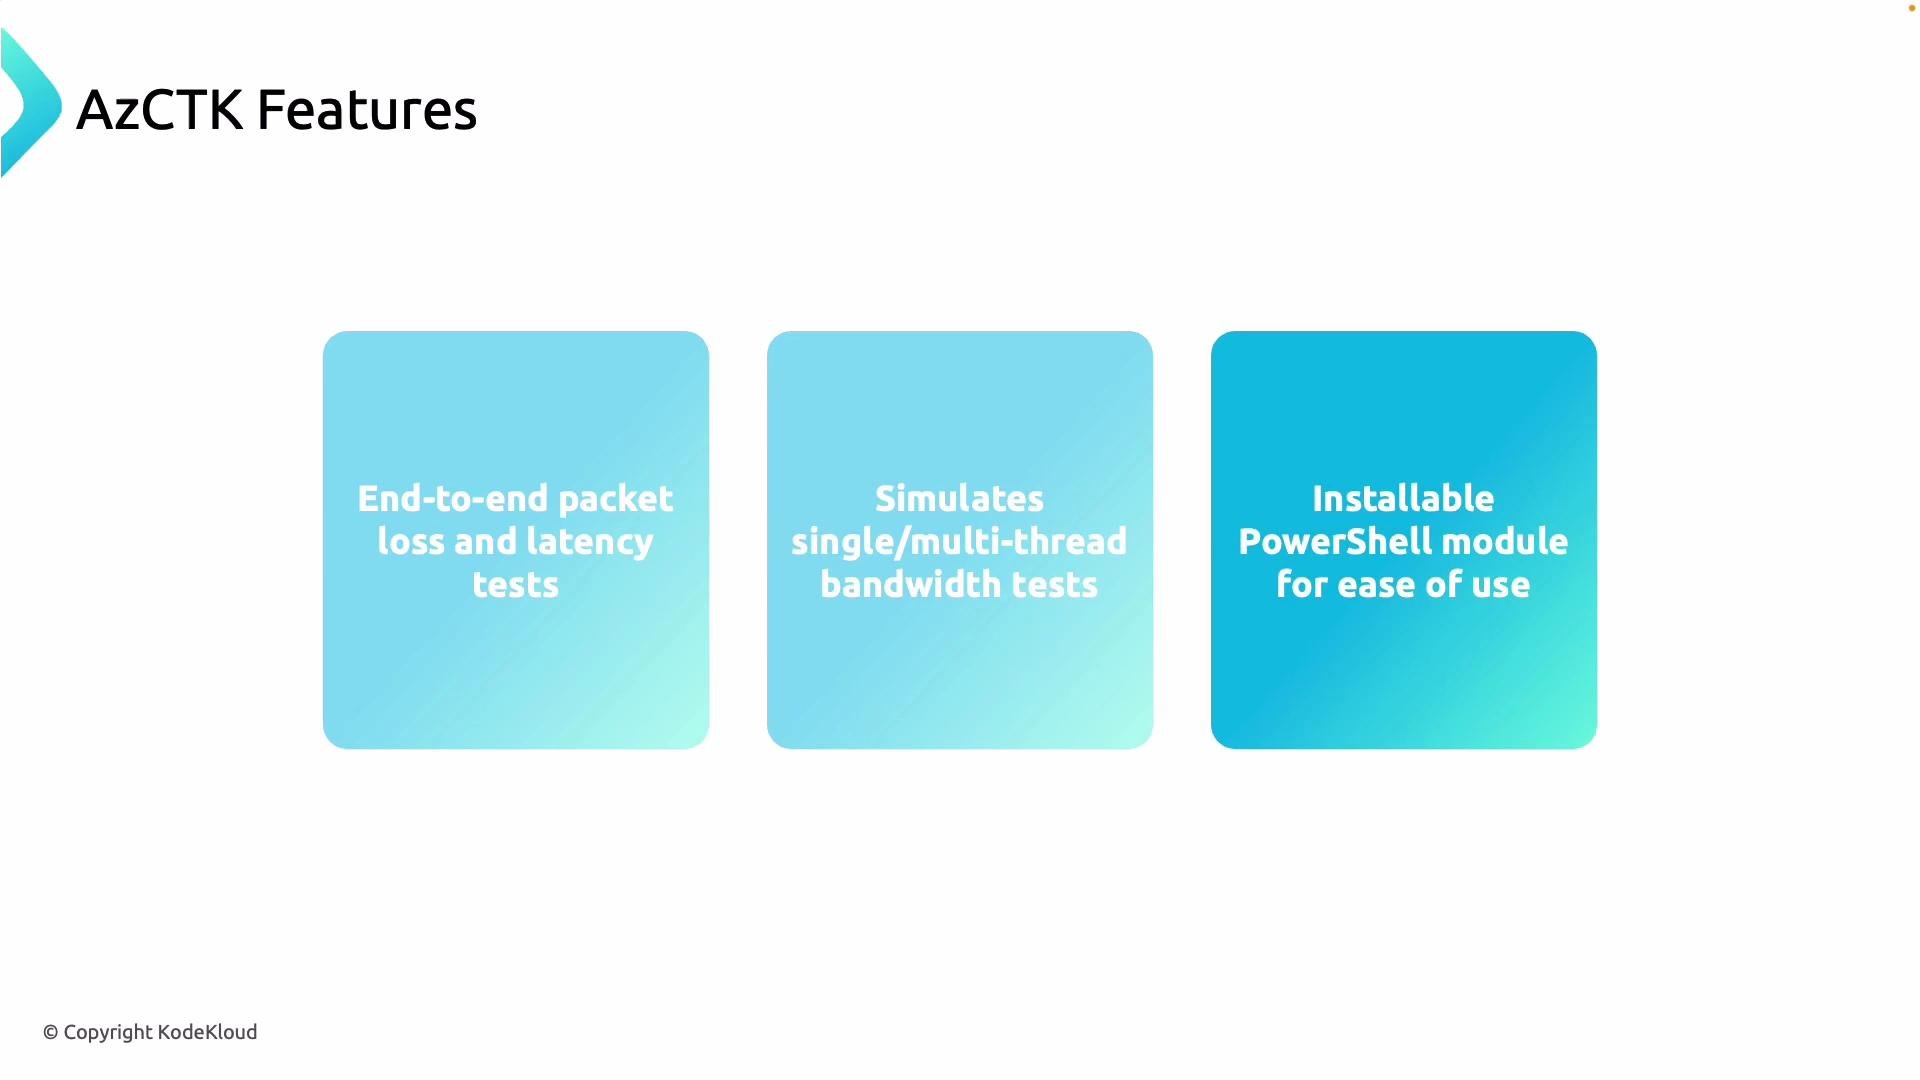
Key AzCTK features:
- End-to-end packet loss and latency tests.
- Single-thread and multi-thread bandwidth tests (multiple concurrent sessions).
- Ability to vary TCP window sizes to emulate different client behaviors.
- Installable as a PowerShell module for automation and scripting.
Example: running a Get-LinkPerformance test
Run a basic multi-stage performance test:Interpreting the core metrics
Troubleshooting checklist
When results show elevated loss, reduced bandwidth, or increased latency, validate configuration and capacity across all layers:- Azure networking:
- NSGs and UDRs for unintended rules.
- Load Balancer configuration and health probes.
- VM size and NIC capabilities (maximum bandwidth, Accelerated Networking).
- On-premises network:
- Routers, switches, firewalls for queueing or drops.
- MTU settings and VLAN configurations.
- Connectivity circuits:
- ExpressRoute or VPN circuit health and advertised BGP routes.
- Endpoints:
- Server NIC drivers, OS TCP stack tuning, CPU/memory saturation.
Installation and quick start
Install AzCTK from the PowerShell Gallery and import it into your session:Run PowerShell as an administrator if you need to install modules system-wide. Ensure you have a supported PowerShell version (PowerShell 5.1 or PowerShell Core) and an execution policy that permits module installation.
Example troubleshooting workflow
- Baseline test: run
Get-LinkPerformancewith default stages to capture baseline bandwidth/latency/loss. - Reproduce: run the same tests from the opposite endpoint to confirm symmetry.
- Isolate: increase session counts and vary window sizes to determine whether the limitation changes (network vs. endpoint).
- Inspect: review NSGs, UDRs, load balancers, VM SKUs, and NIC settings. Check on-premises devices and circuit state.
- Remediate: adjust configuration (e.g., increase VM size, tune TCP, resolve MTU mismatches), then retest.
Links and references
- Azure Network Watcher docs: https://learn.microsoft.com/azure/network-watcher/network-watcher-monitoring-overview
- AzCTK GitHub: https://github.com/microsoft/Azure-Connectivity-Toolkit
- Azure PowerShell: https://learn.microsoft.com/azure/powershell/
- Azure CLI: https://learn.microsoft.com/cli/azure/