Network Watcher is enabled per region for each subscription. NSG Flow Logs require a storage account or Log Analytics workspace and may incur storage/ingestion costs. Configure retention and routing to meet your compliance and cost requirements.
-
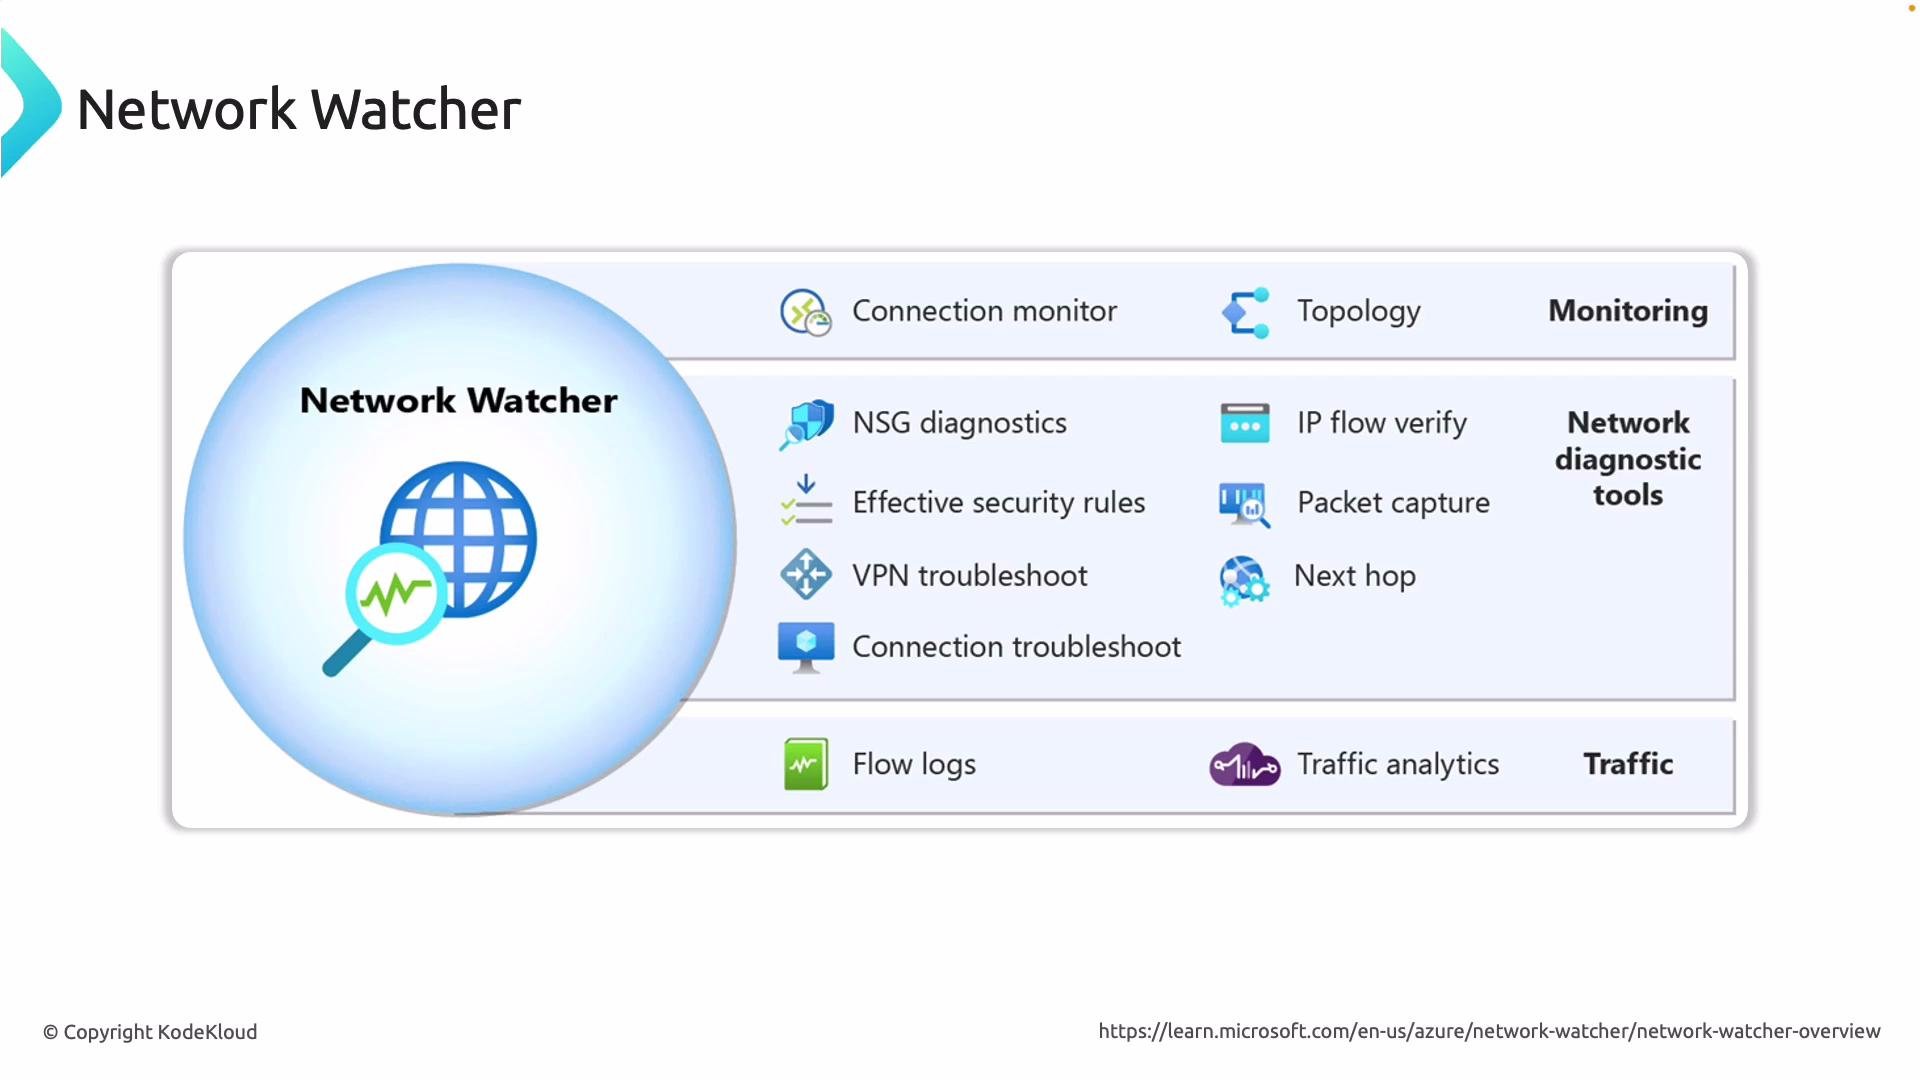
IP Flow Verify
Purpose: Verify whether traffic to or from a VM is allowed or denied based on the VM’s effective Network Security Group (NSG) rules and routing.
How it helps: Identify the specific NSG rule (and priority) that allowed or denied traffic, avoiding manual rule-by-rule inspection.
Example usage (Azure CLI):When to run: during access issues to determine whether NSG rules are blocking expected traffic. -
Next Hop
Purpose: Show the effective forwarding decision for a packet leaving a VM’s NIC by evaluating route tables and UDRs.
How it helps: Pinpoint whether traffic is routed to a VirtualAppliance, Internet, VirtualNetworkGateway, VNetLocal, or None, which is critical for UDR, firewall, and gateway troubleshooting.
Example usage (Azure CLI):When to run: if traffic goes to an unexpected appliance or drops, or when verifying route propagation. -
VPN Troubleshoot
Purpose: Diagnose VPN gateway connectivity, tunnel status, and common configuration issues between on-premises and Azure.
How it helps: Surface tunnel health, configuration mismatches, and gateway errors so you can resolve VPN outages faster.
Typical checks: tunnel status, phase 1/2 negotiation errors, shared key mismatches, gateway capacity/throughput, and gateway IP reachability. Use portal diagnostics or CLI tooling for detailed logs. -
Flow Logs
Purpose: Capture IP flow records for traffic traversing an NSG. Flow logs can be stored in a storage account or sent to Log Analytics/Traffic Analytics for processing and visualization.
How it helps: Analyze traffic patterns, detect anomalies, perform forensics, and support capacity planning. Flow logs are enabled per NSG and support different log versions and retention periods.
Example usage (Azure CLI):Best practices: centralize flow log storage for multiple NSGs, enable Traffic Analytics for aggregated insights, and configure retention to balance cost vs. investigation needs. -
Connection Troubleshoot
Purpose: Simulate an end-to-end path between two endpoints (for example, VM to destination IP) and show where connectivity fails or where latency is introduced.
How it helps: Evaluate NSGs, UDRs, gateway/firewall rules and return per-hop information, packet loss, and latency where available.
Example usage (Azure CLI):When to run: when users or services report intermittent connectivity, high latency, or when validating connectivity after a topology change. -
Topology
Purpose: Generate a visual map of network resources and their relationships — VNets, subnets, NICs, VMs, gateways, and connected resources.
How it helps: Quickly identify misconfigurations, unexpected attachments, missing peering, or security gaps in your network design.
Example usage (Azure CLI):When to run: during architecture reviews, incident triage, or before applying major network changes.
- Enable Network Watcher for a region (Azure CLI):
- For long-term analysis, send NSG Flow Logs to Log Analytics and enable Traffic Analytics for aggregated dashboards and anomaly detection.
- Combine Network Watcher tools in sequence: use Topology to visualize, Next Hop to verify routing, IP Flow Verify to check ACLs, and Connection Troubleshoot to simulate the full path.
- Azure Network Watcher overview: https://learn.microsoft.com/azure/network-watcher/overview
- Network Watcher CLI reference: https://learn.microsoft.com/cli/azure/network/watcher?view=azure-cli-latest
- Configure NSG flow logs and Traffic Analytics: https://learn.microsoft.com/azure/network-watcher/flow-logs-manage