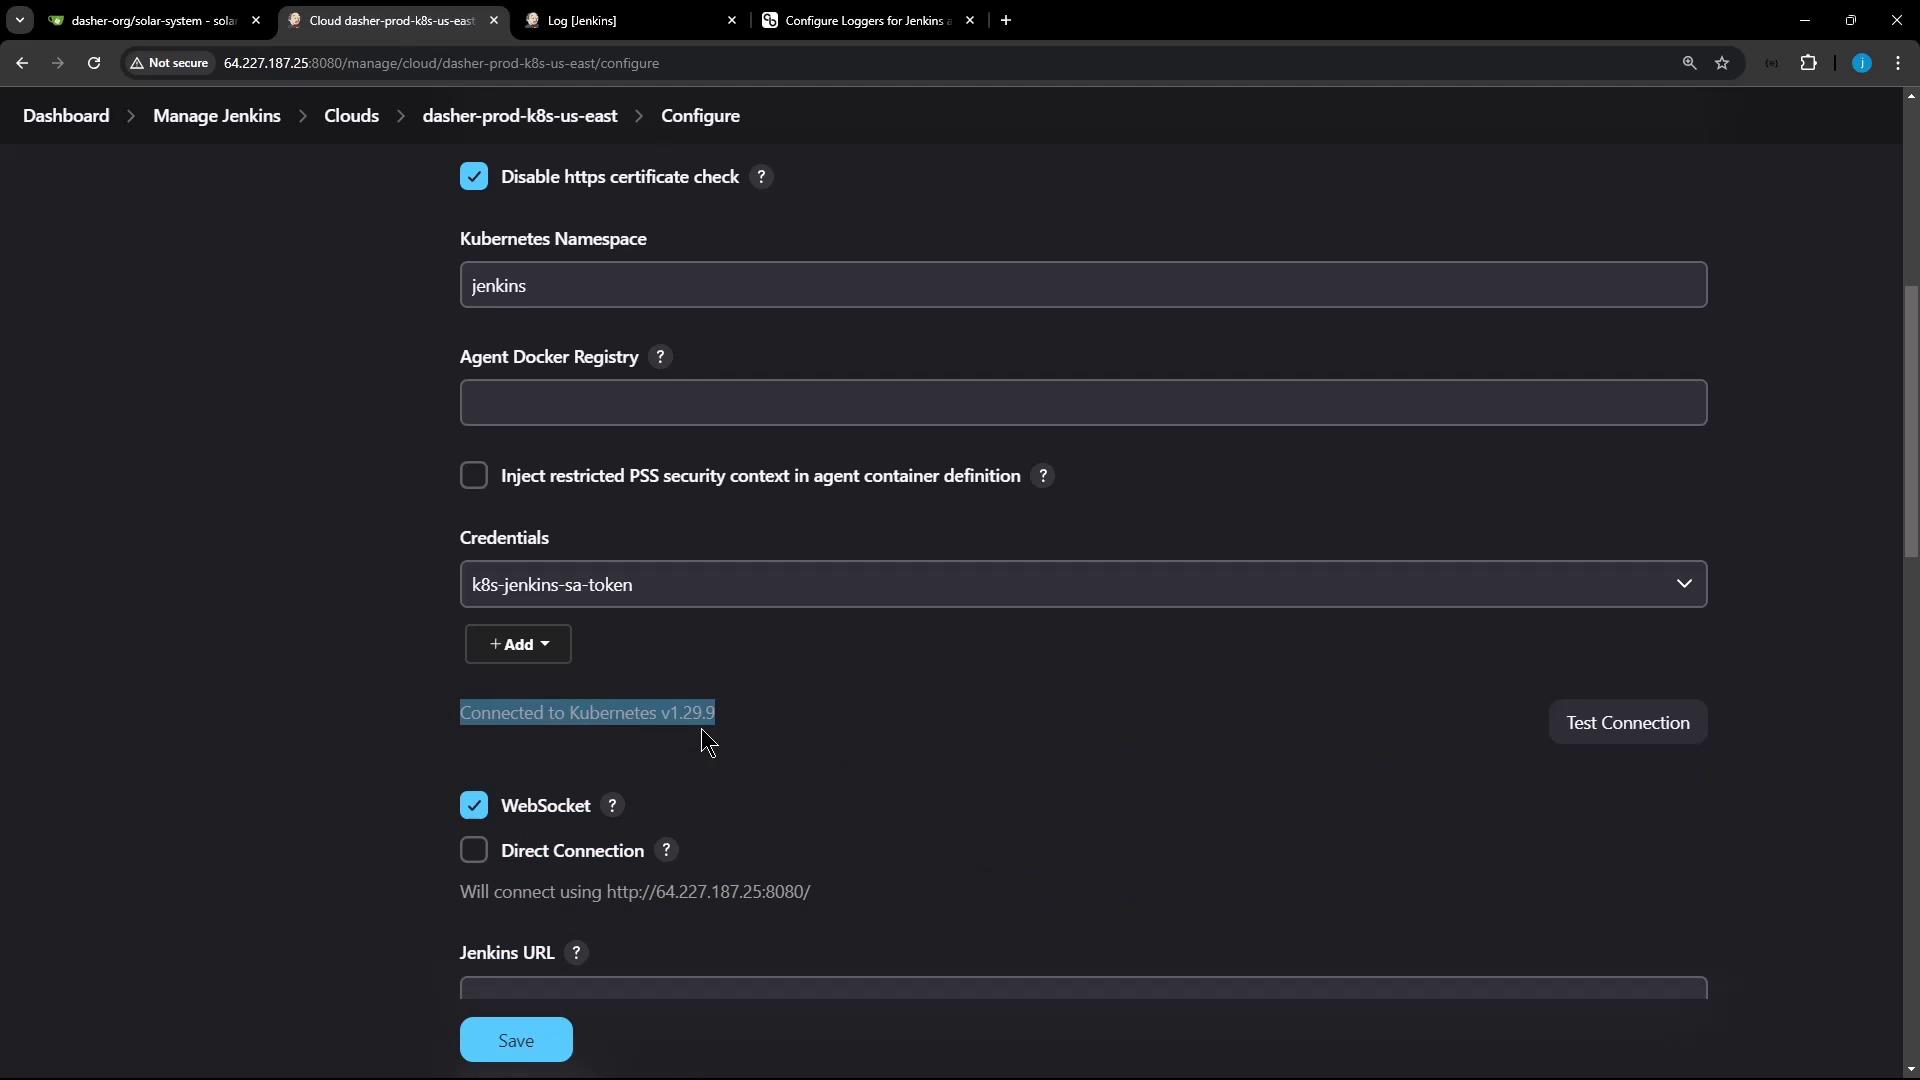
Increasing verbosity generates more log output and can impact controller performance due to higher disk and I/O usage. Only raise logging levels during active troubleshooting, and revert to defaults afterward.
Logging Configuration Options
You can configure custom logging in Jenkins using one of these five approaches:- Add a Logger via the Jenkins UI (recommended)
- Initialize via a Groovy Script
- Use a Java Util Logging Properties File
- File System Custom Log Recorder
- XML Configuration via the UI (non-persistent)
1. Add a Logger via the Jenkins UI
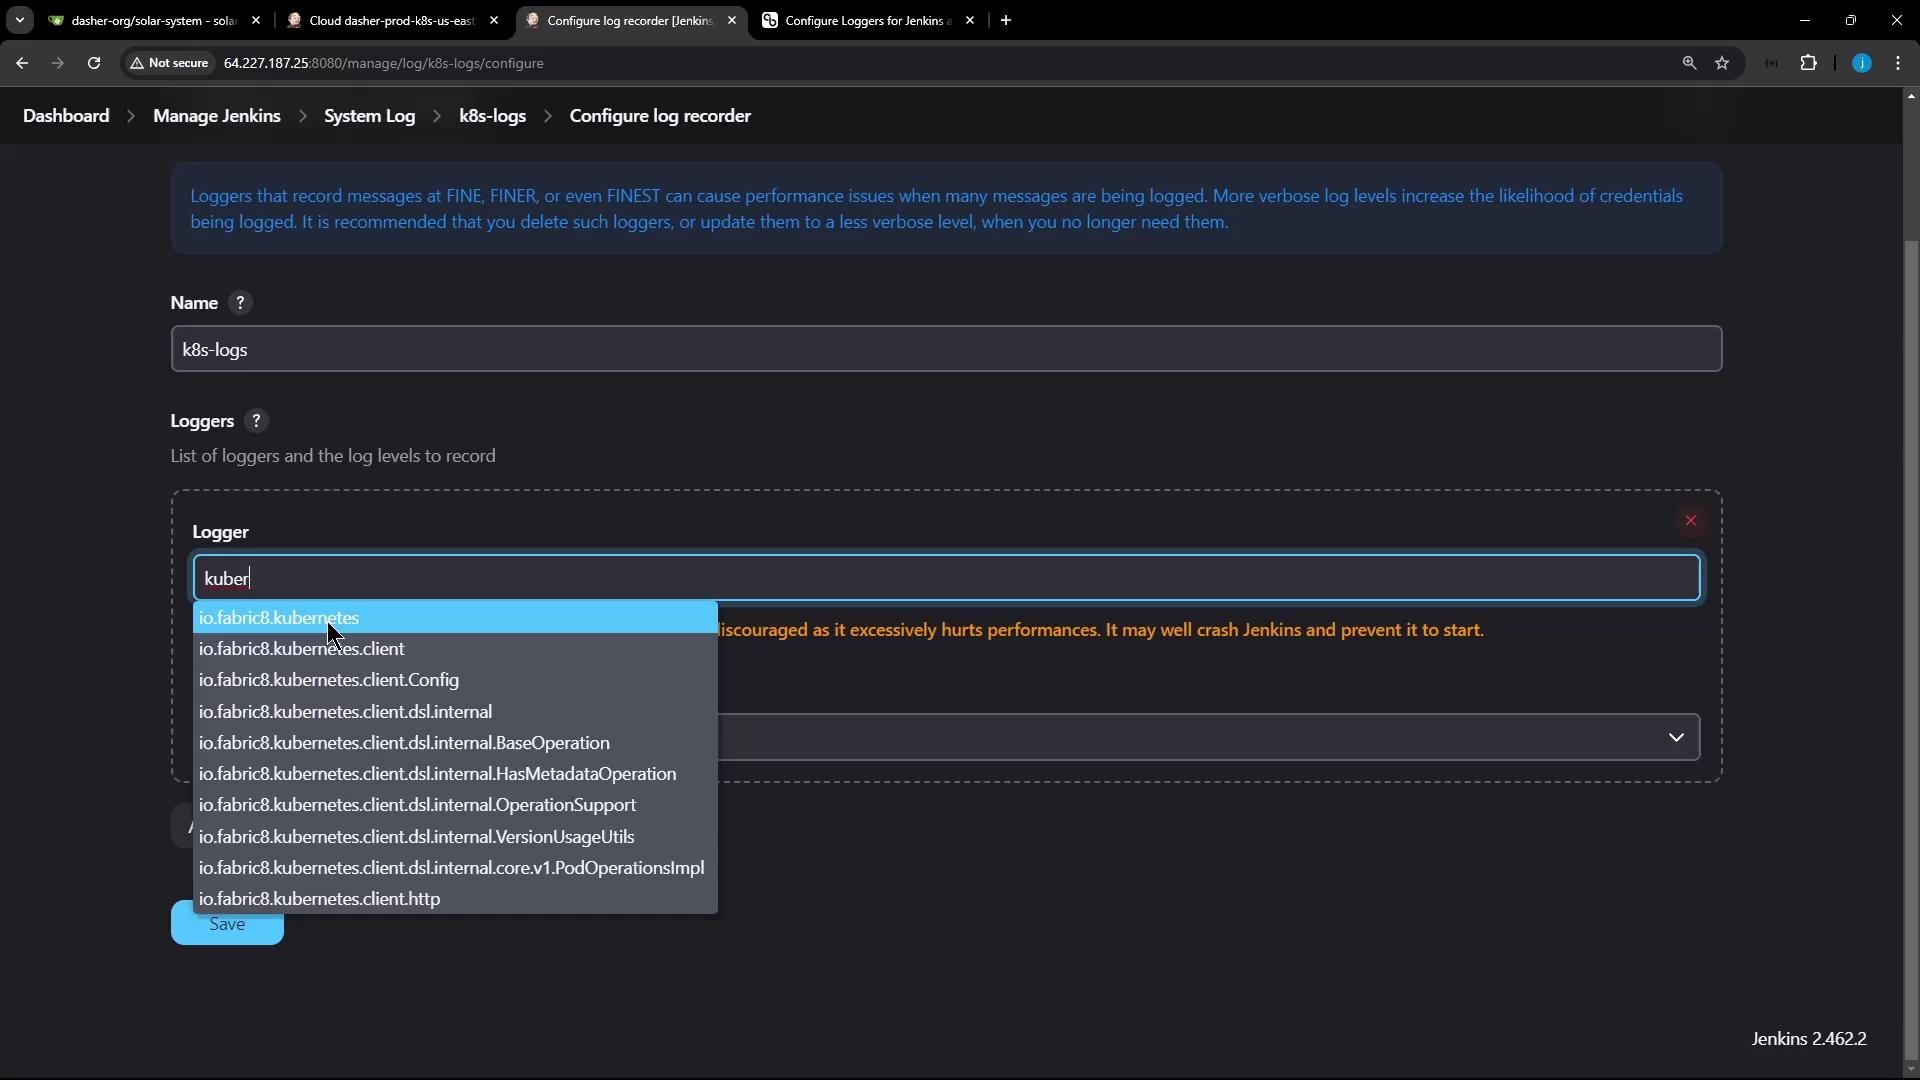
For dynamic control over logging, the Jenkins UI is the easiest option. For example, to troubleshoot the Kubernetes cloud plugin:- Go to Manage Jenkins → System Log.
- Click Add new log recorder, provide a name, then add the package or logger and select the desired level.
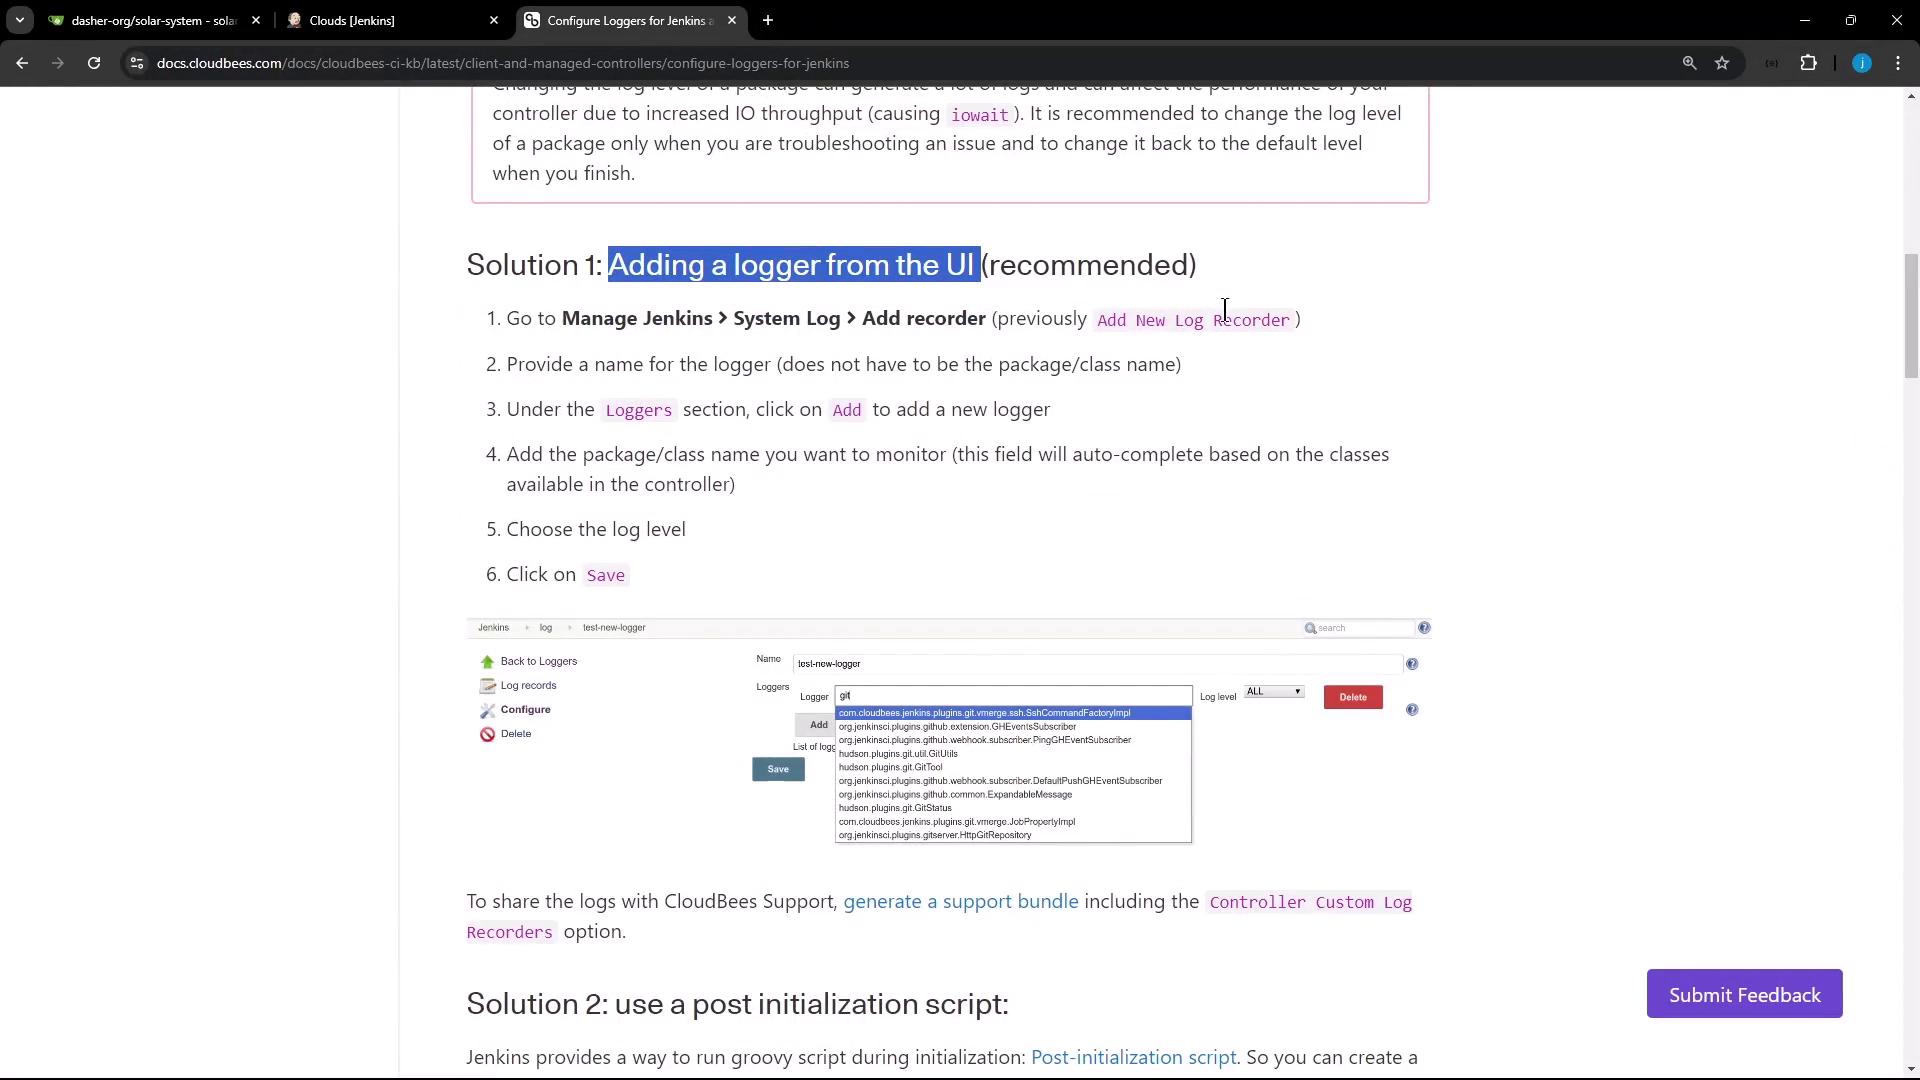
Using the UI allows you to switch log levels at runtime without restarting Jenkins.
2. Initialize via a Groovy Script
Place a Groovy file underJENKINS_HOME/init.groovy.d/ to set log levels at startup:
3. Java Util Logging Properties File
Drop alogging.properties file into $JENKINS_HOME:
4. File System Custom Log Recorder
Create XML definitions under the Jenkins home directory:5. XML Configuration via the UI (Non-Persistent)
You can also paste default logger settings directly in the UI (resets on restart):Example: Debugging Kubernetes Cloud Connection
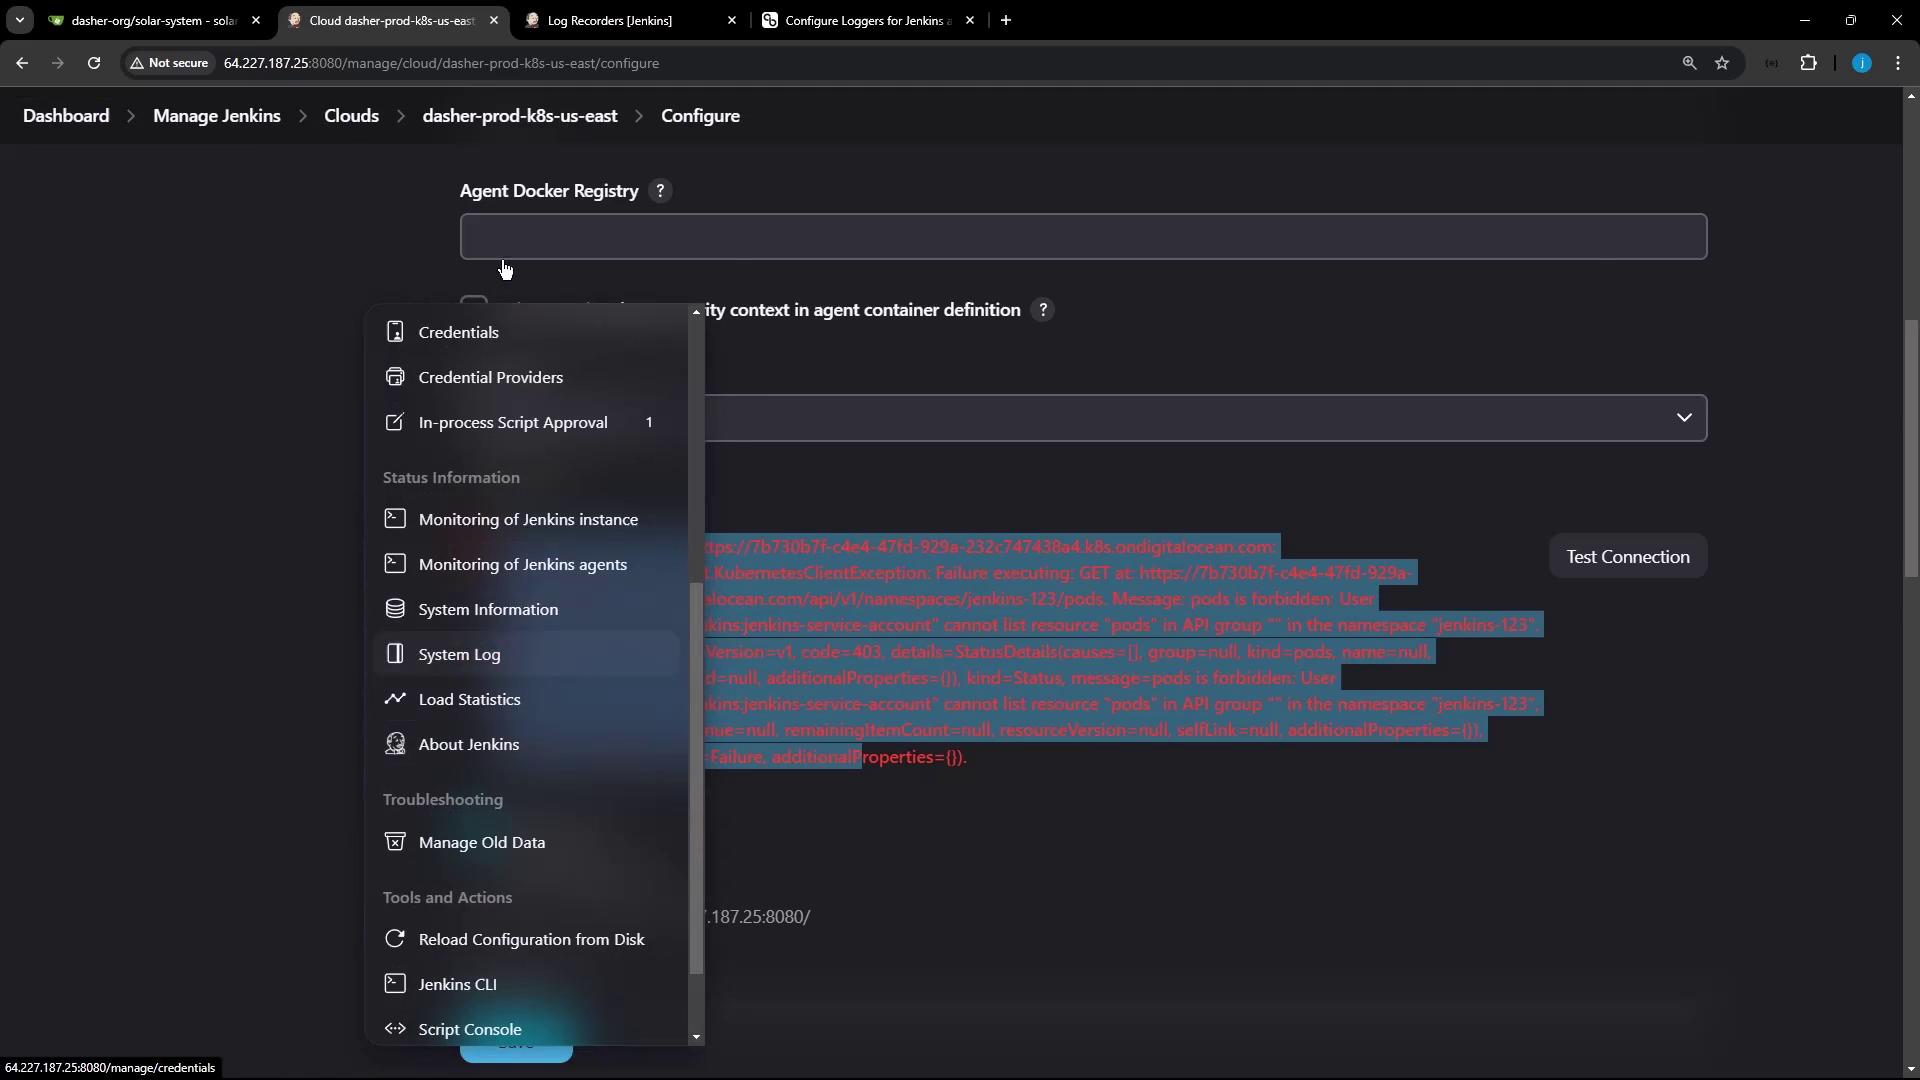
When testing your Kubernetes cloud in Jenkins, you might see a generic error:A 403 Forbidden often indicates missing RBAC permissions for the Jenkins service account.
- Go to Manage Jenkins → System Log.
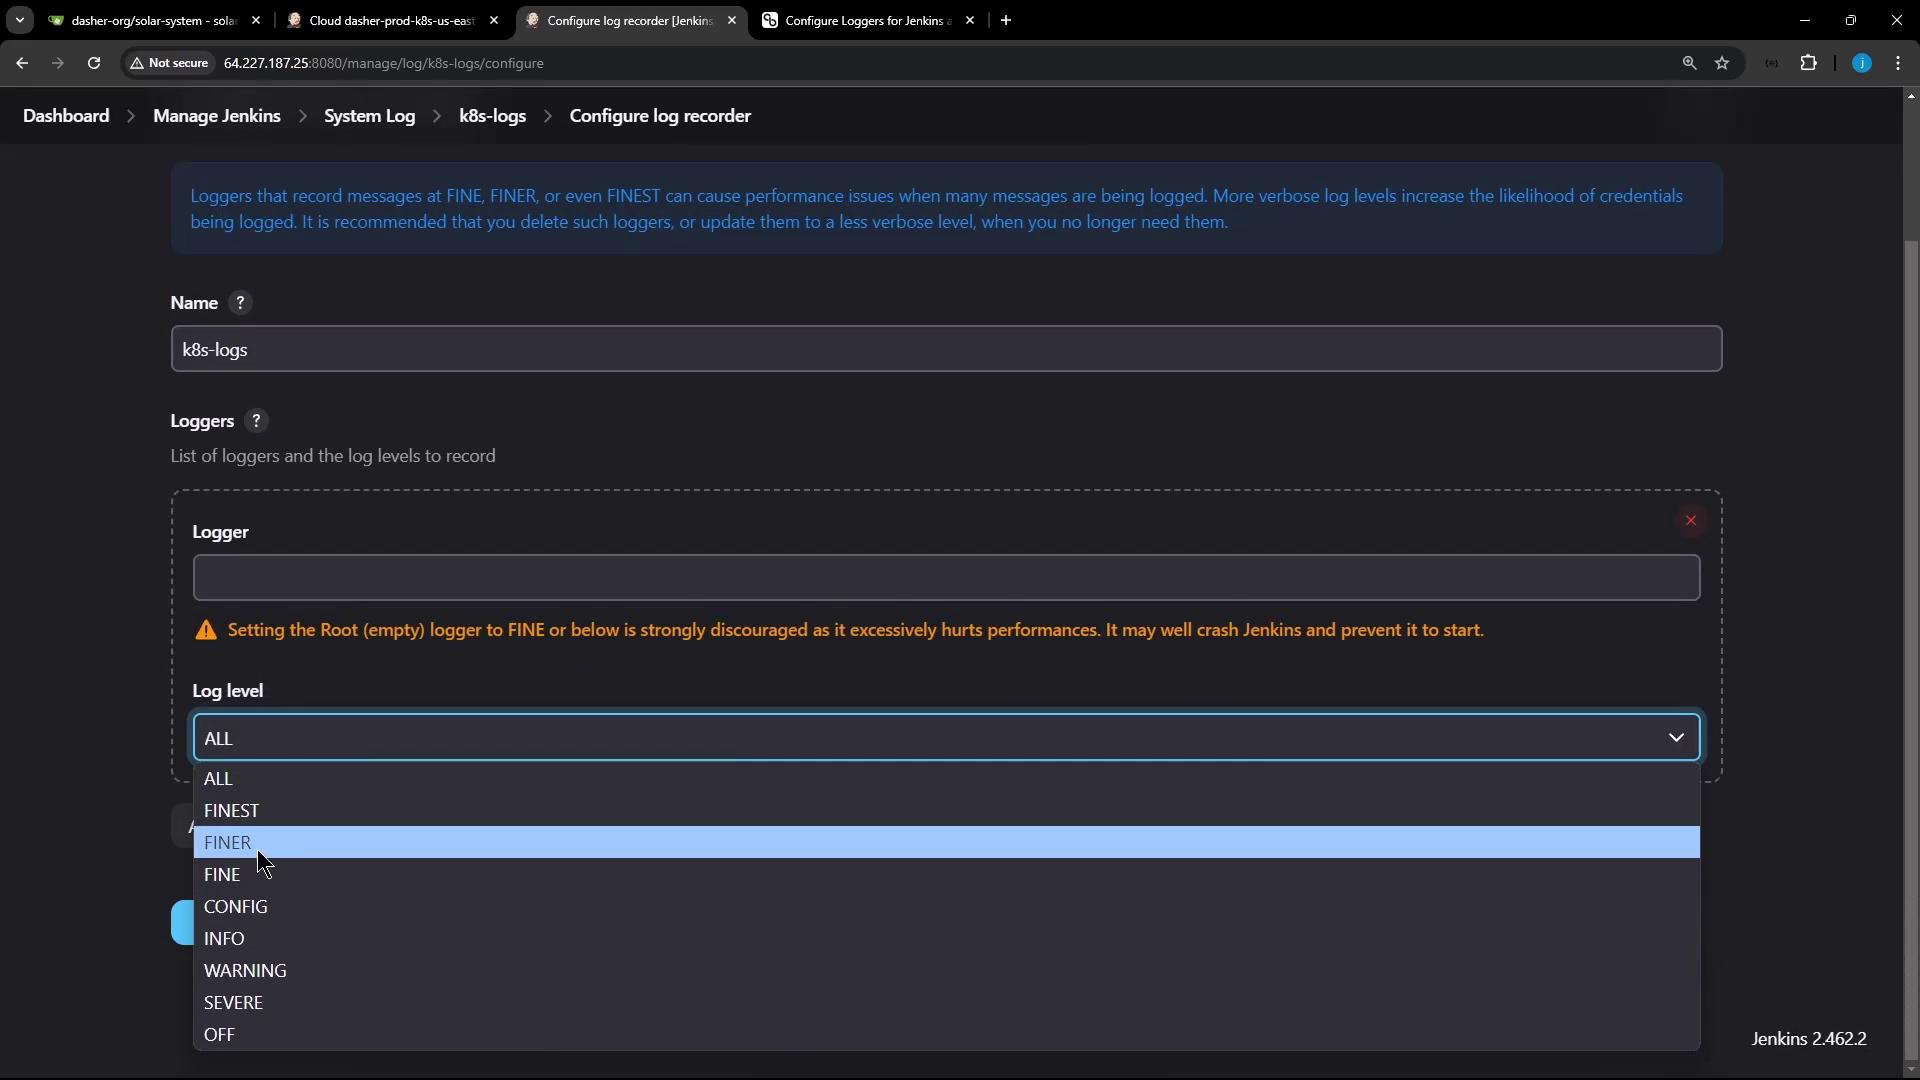
- Click Add new log recorder, name it (e.g.,
k8s-logs), and set level to All. - Search for
Kubernetesand selectio.fabric8.kubernetes.clientor the specific subpackage.
Example: Successful Connection
With correct RBAC and service account settings, the UI will show a one-line success. Jenkins will still record the detailed HTTP lifecycle if debug logging is enabled: