What Is JavaMelody?
JavaMelody provides in-depth dashboards for JavaEE applications, capturing critical performance data:
- Memory usage (heap & non-heap)
- CPU load and system load averages
- HTTP request counts, mean/max durations
- Thread states and peak thread counts
- Error rates and log analysis
JavaMelody supports HTML and PDF report generation, multi-language UI, and integrates seamlessly into any Java web application.
Integrating JavaMelody with Jenkins
Jenkins is Java-based, so you can leverage the Monitoring plugin to embed JavaMelody into your controller and agents.- Go to Manage Jenkins > Manage Plugins.
- Search for Monitoring and install the plugin.
- Restart your Jenkins controller to activate JavaMelody.
Installing monitoring plugins may introduce additional JVM overhead. Monitor resource usage on production systems before rolling out cluster-wide.

Plugin Features
| Metric Category | Details |
|---|---|
| Memory & CPU | Heap/non-heap usage, system CPU, process CPU, load averages |
| HTTP Requests | Request counts, cumulative times, mean/max durations |
| Thread Monitoring | Active vs. idle threads, creation rate, peak usage |
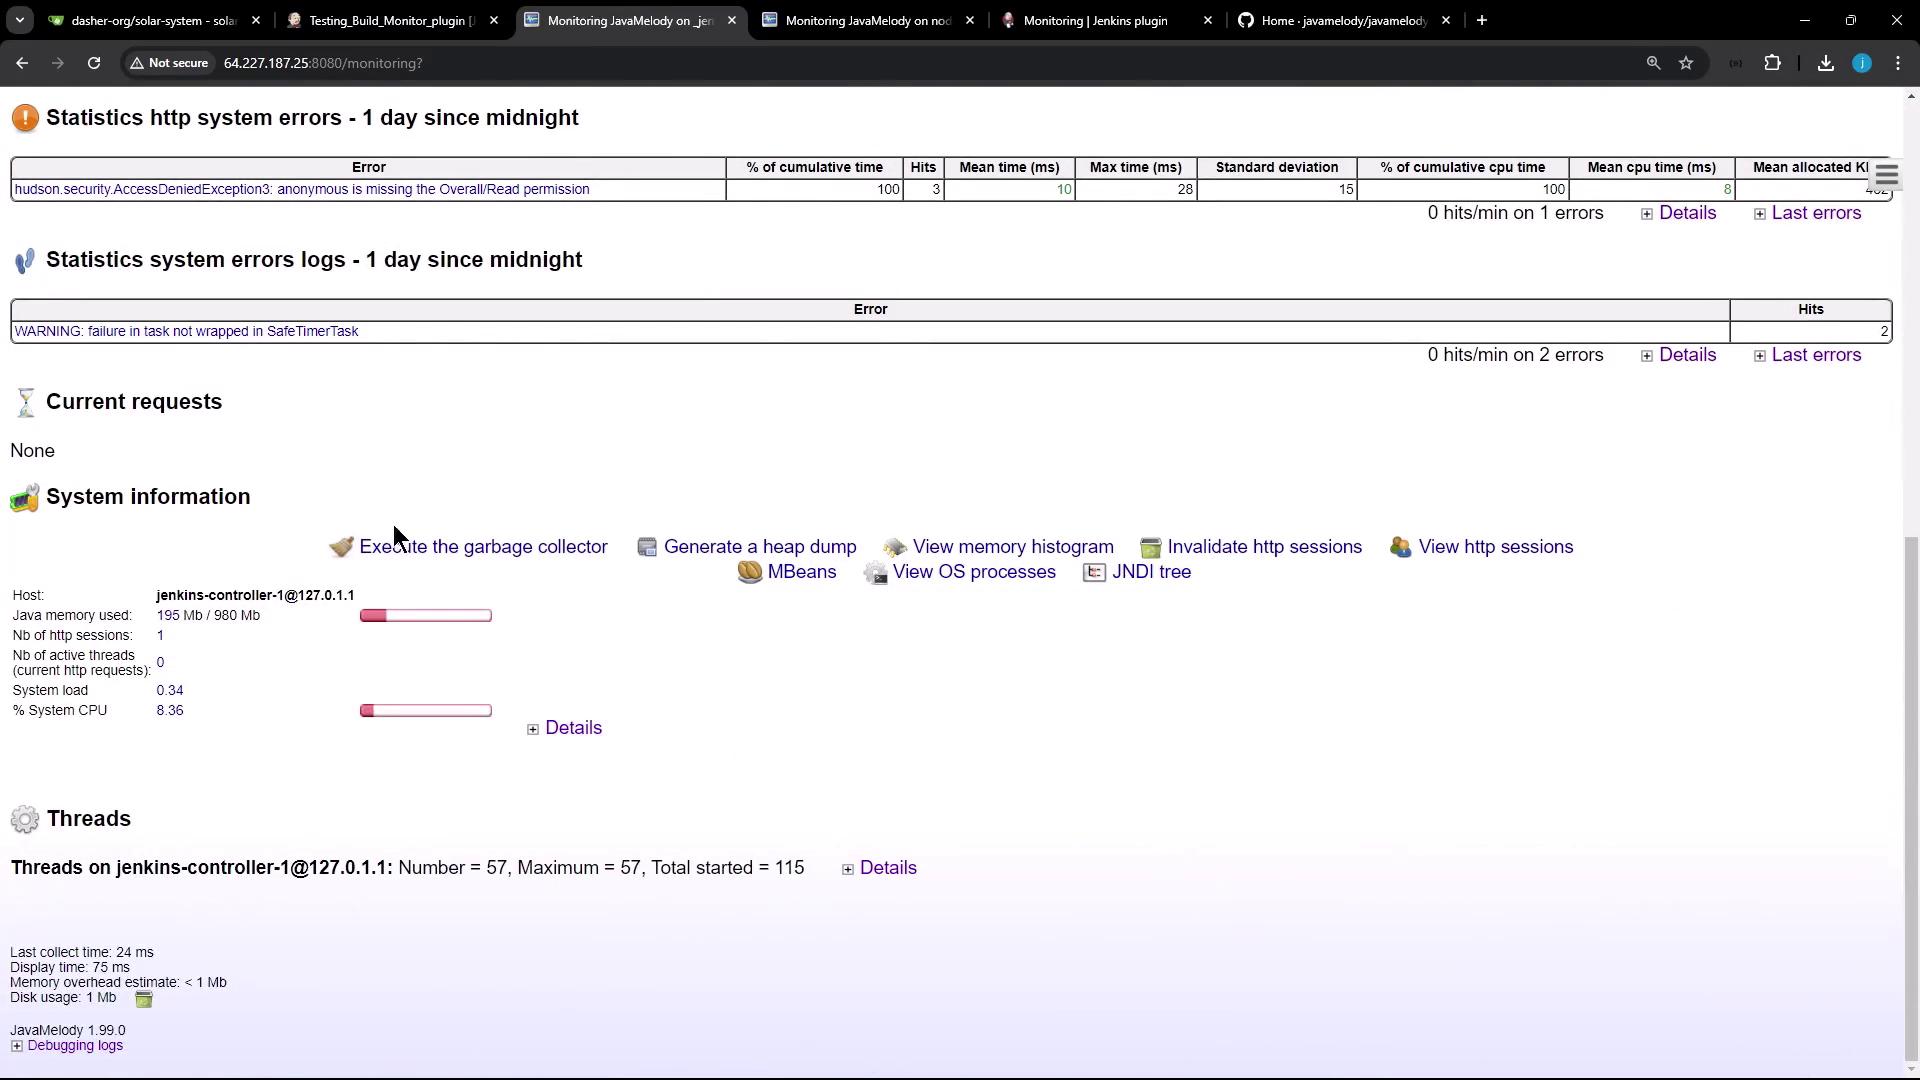
| Errors & Logs | Exception counts, log severity breakdown |
| Reporting | Export HTML or PDF reports |
| Localization | English, German, French, and more |
Accessing the Monitoring Dashboard
After restarting Jenkins, navigate to Manage Jenkins and scroll down to the Monitoring of Jenkins Instance and Monitoring of Jenkins Agents sections: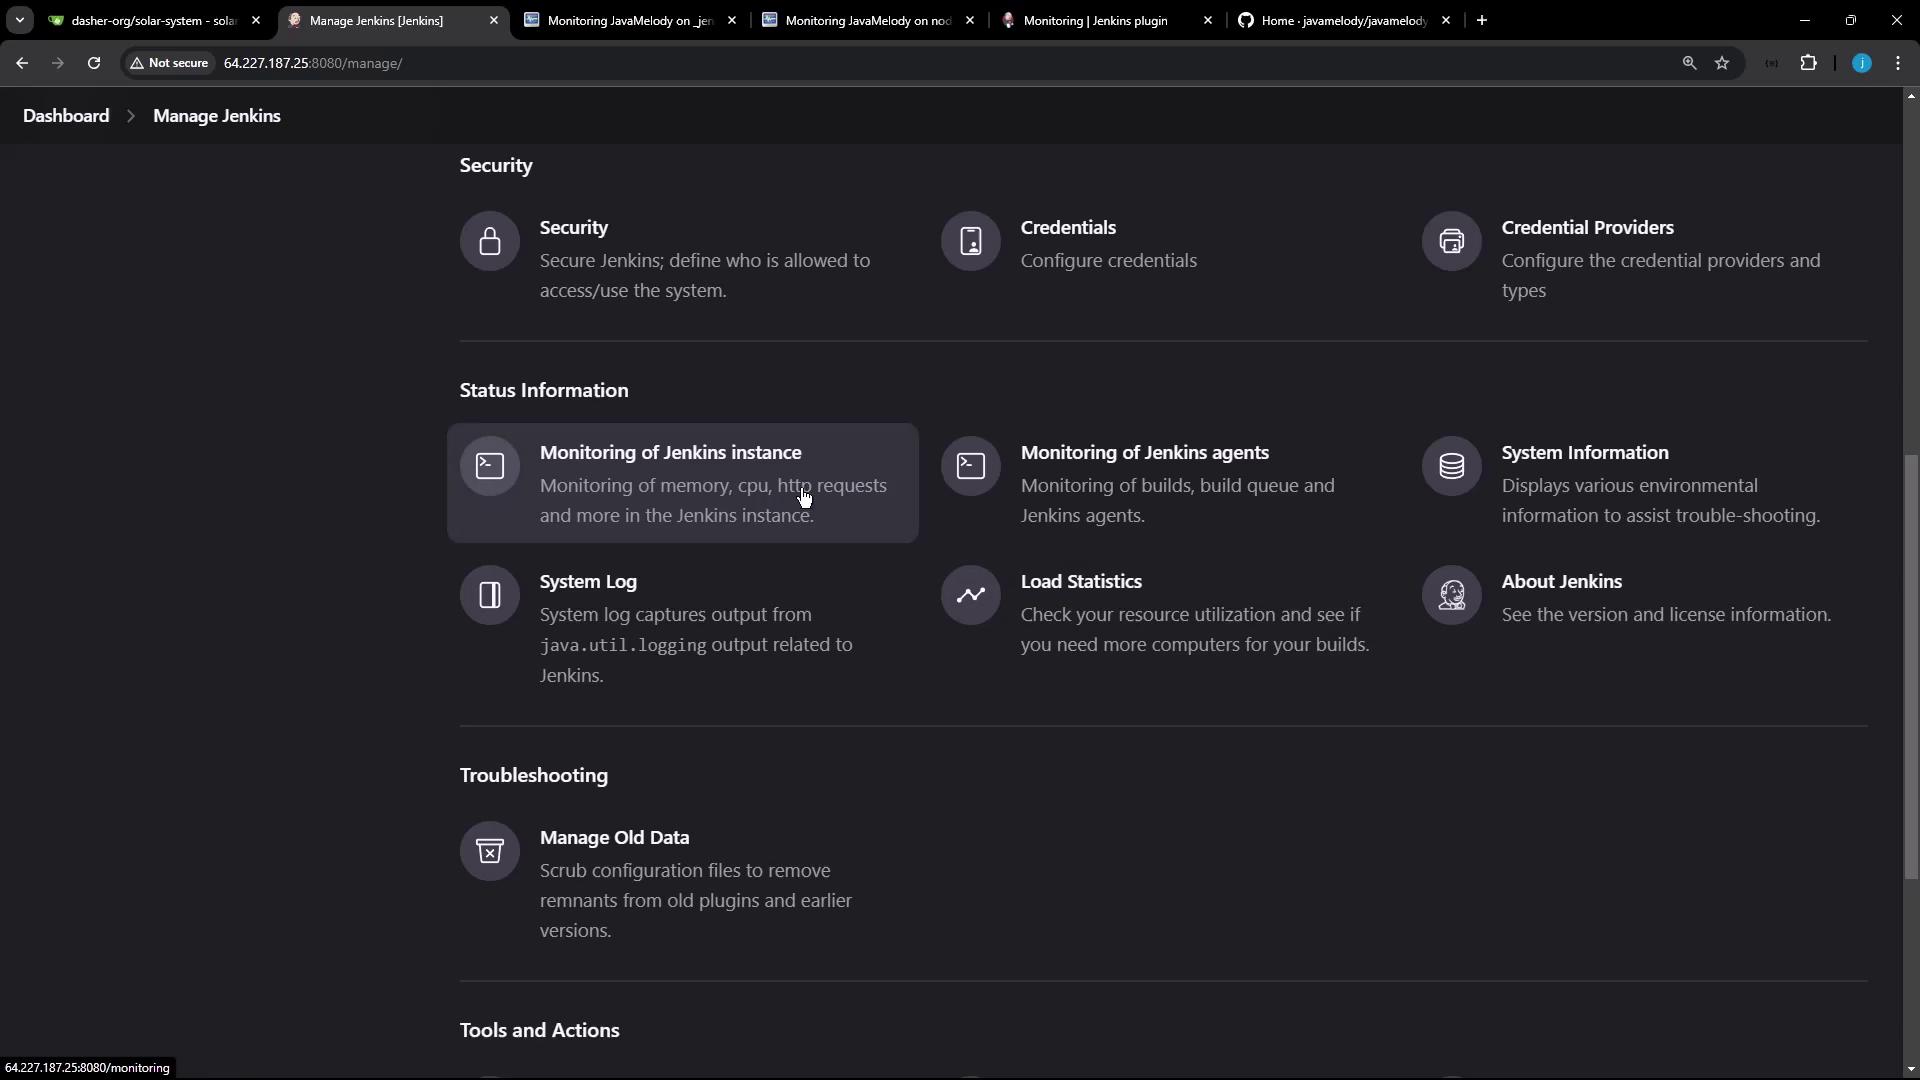
Controller (Jenkins Instance) Monitoring
Click Monitoring of Jenkins Instance to open the JavaMelody dashboard for your controller. You’ll find:- System Information
- JVM vendor/version, OS name, uptime
- Memory & CPU Charts
- Real-time graphs for heap/non-heap and CPU usage
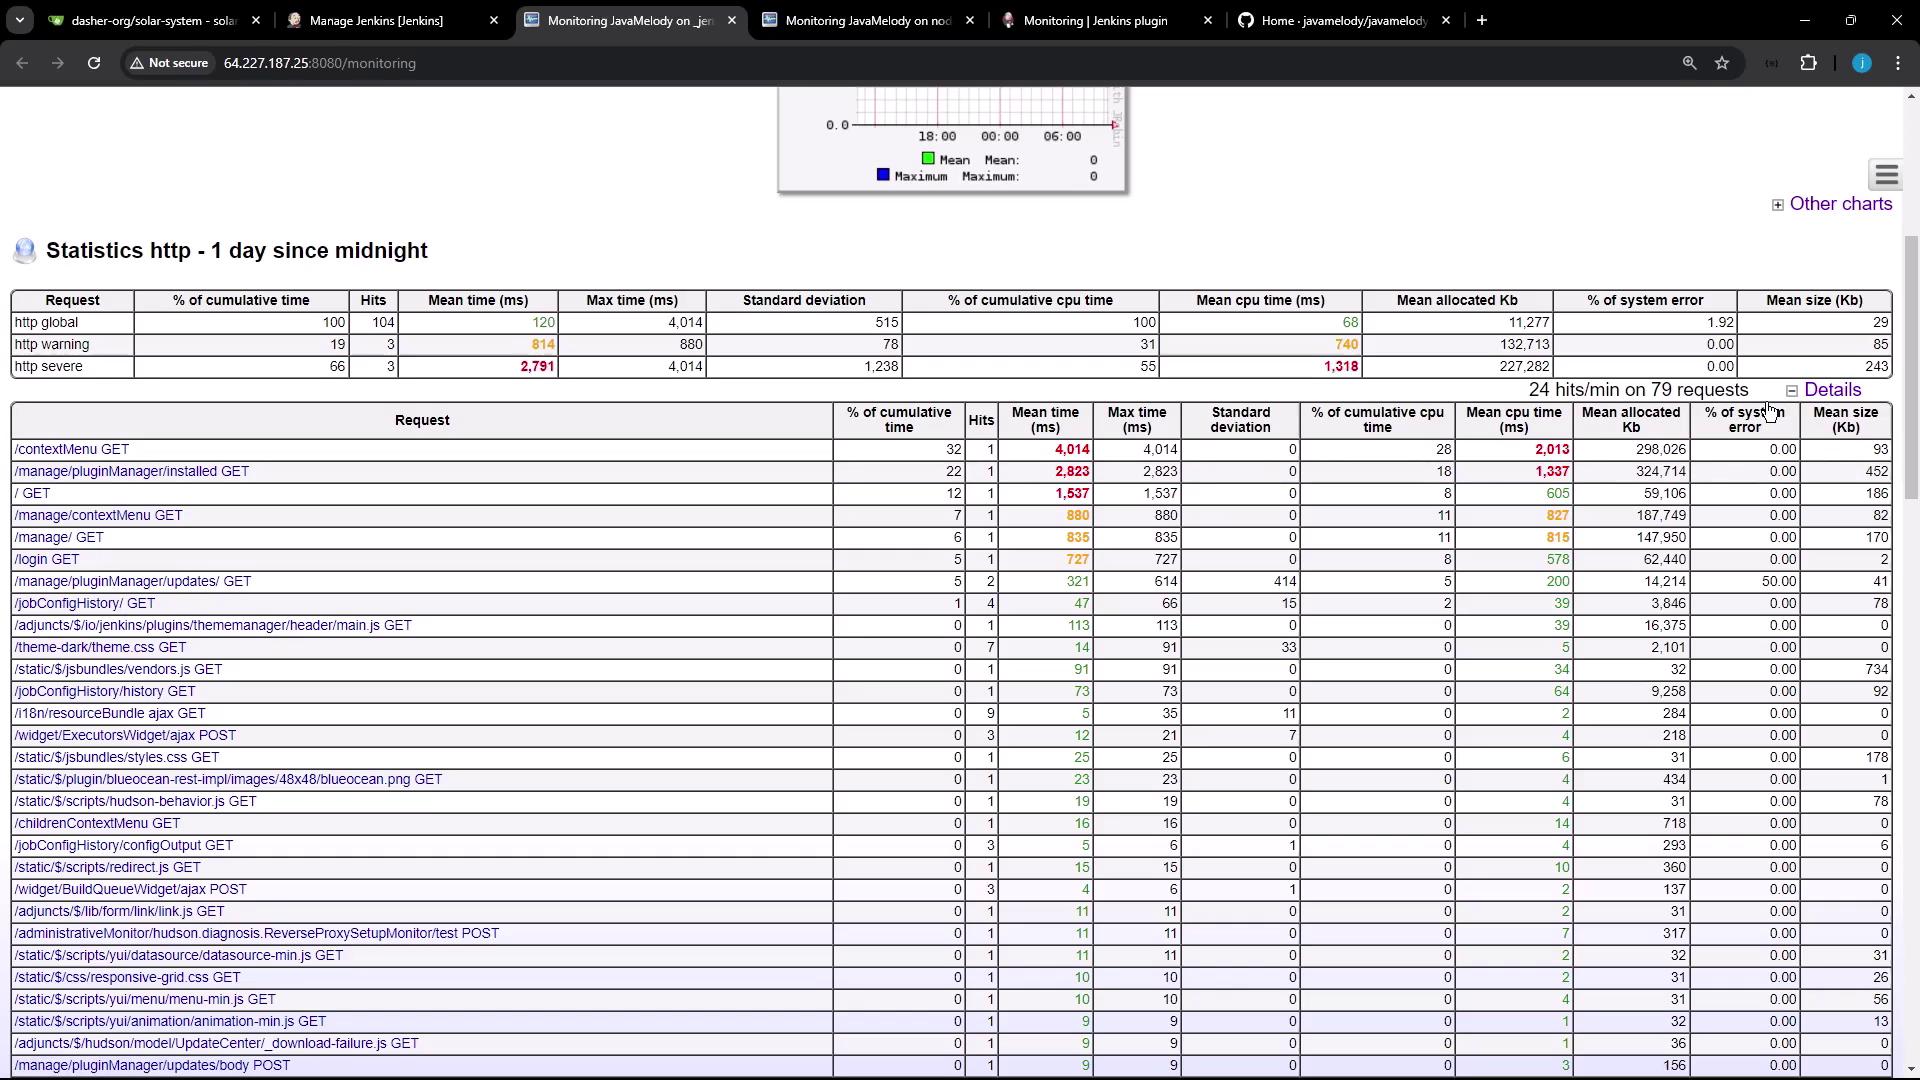
- HTTP Request Statistics
- Table of endpoints with hits, cumulative time, mean/max durations
- Thread States
- Active vs. idle threads, thread creation rate
Agent (Node) Monitoring
Under Monitoring of Jenkins Agents, select any connected node to view:- Garbage collection triggers
- Heap dump generation
- Memory histogram visualizations
- Active HTTP session details (client country, browser, user)
Observing Live Build Metrics
To see JavaMelody update in real time:- Create a Jenkins pipeline with a sleep/pause stage (e.g.,
sleep 60). - Trigger the job and keep the monitoring dashboard open.
- Refresh periodically to watch thread counts rise, HTTP sessions form, and CPU usage spike.
- Total vs. active threads
- Thread creation rate spikes during builds
- Peak usage metrics