In this tutorial, you’ll learn how to collect and visualize Jenkins metrics using the Prometheus Metrics Plugin, Prometheus, and Grafana. We’ll cover:Documentation Index
Fetch the complete documentation index at: https://notes.kodekloud.com/llms.txt
Use this file to discover all available pages before exploring further.
- Installing and configuring the Jenkins plugin
- Deploying Prometheus and Grafana via Docker Compose
- Scraping Jenkins metrics in Prometheus
- Building dashboards in Grafana
- Generating live data with a sample pipeline
1. Install and Configure the Jenkins Prometheus Metrics Plugin
Jenkins can export runtime data through the Prometheus Metrics Plugin, which adds an HTTP endpoint for scraping.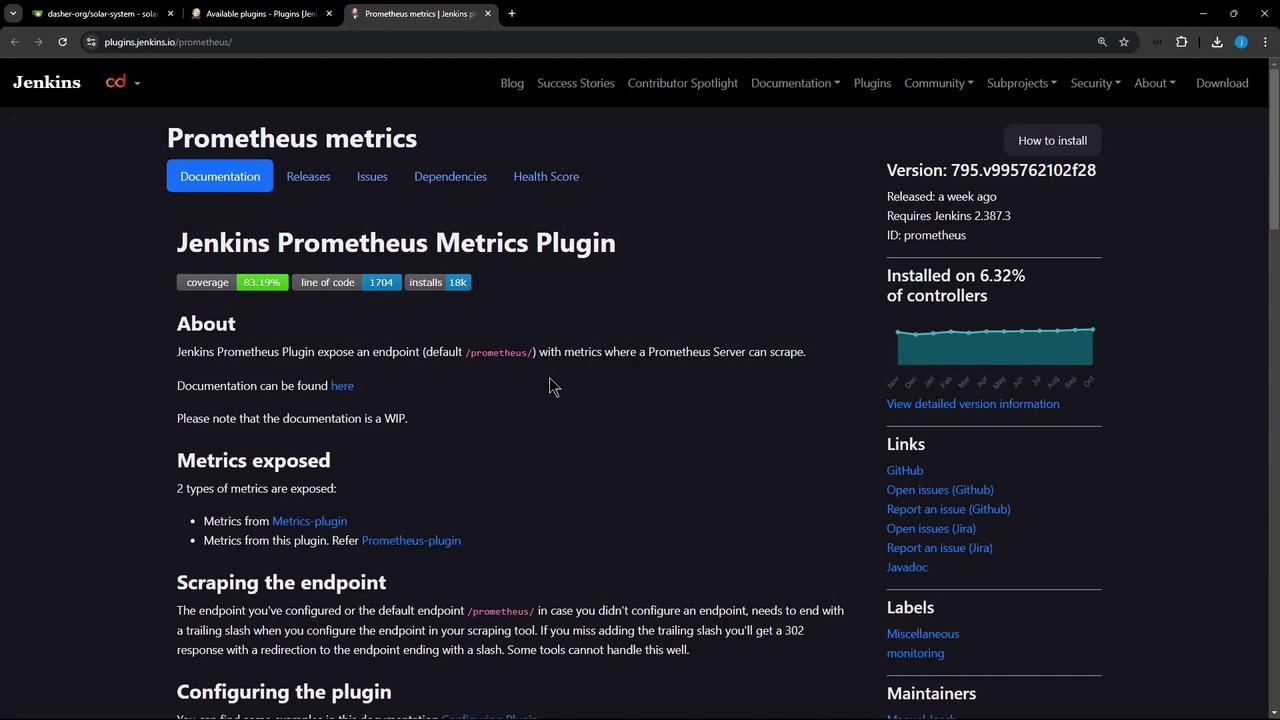
- In Jenkins, navigate to Manage Jenkins » Manage Plugins » Available, search for Prometheus, then install Prometheus Metrics Plugin.
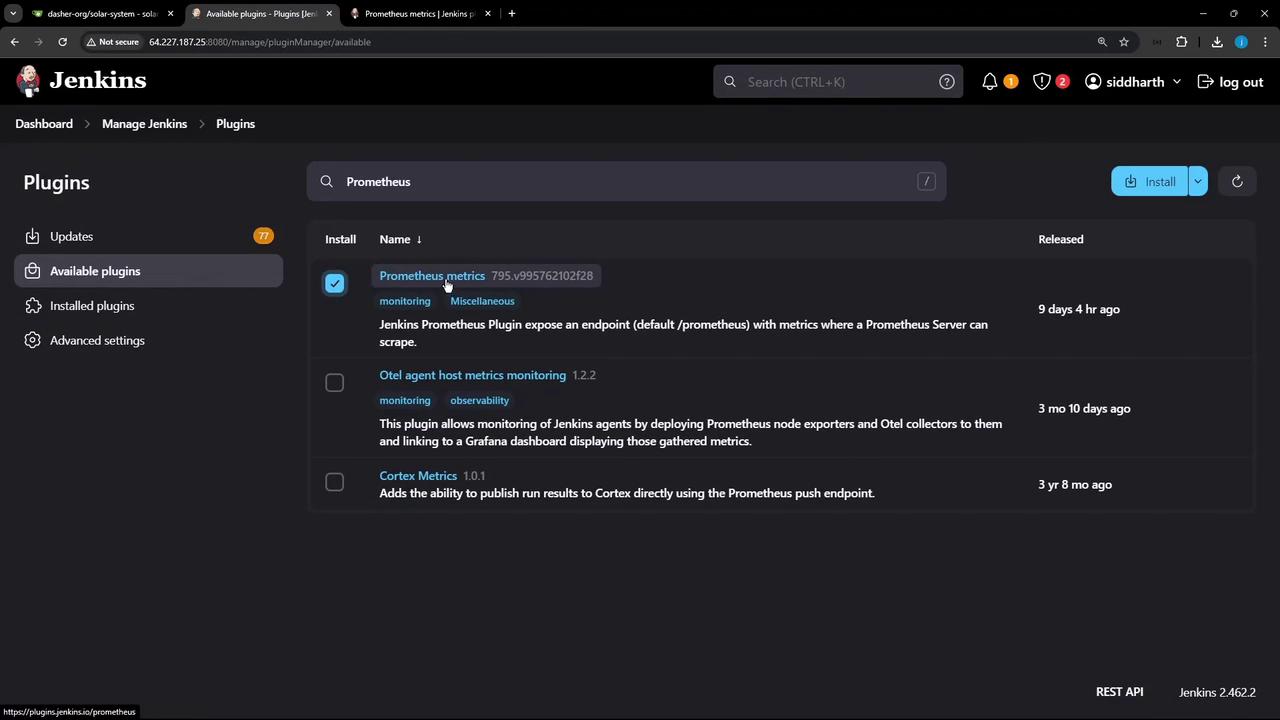
- Restart Jenkins to activate the plugin.
- Go to Manage Jenkins » Configure System » Prometheus. By default, metrics are collected every 120 seconds at the
/prometheusendpoint.
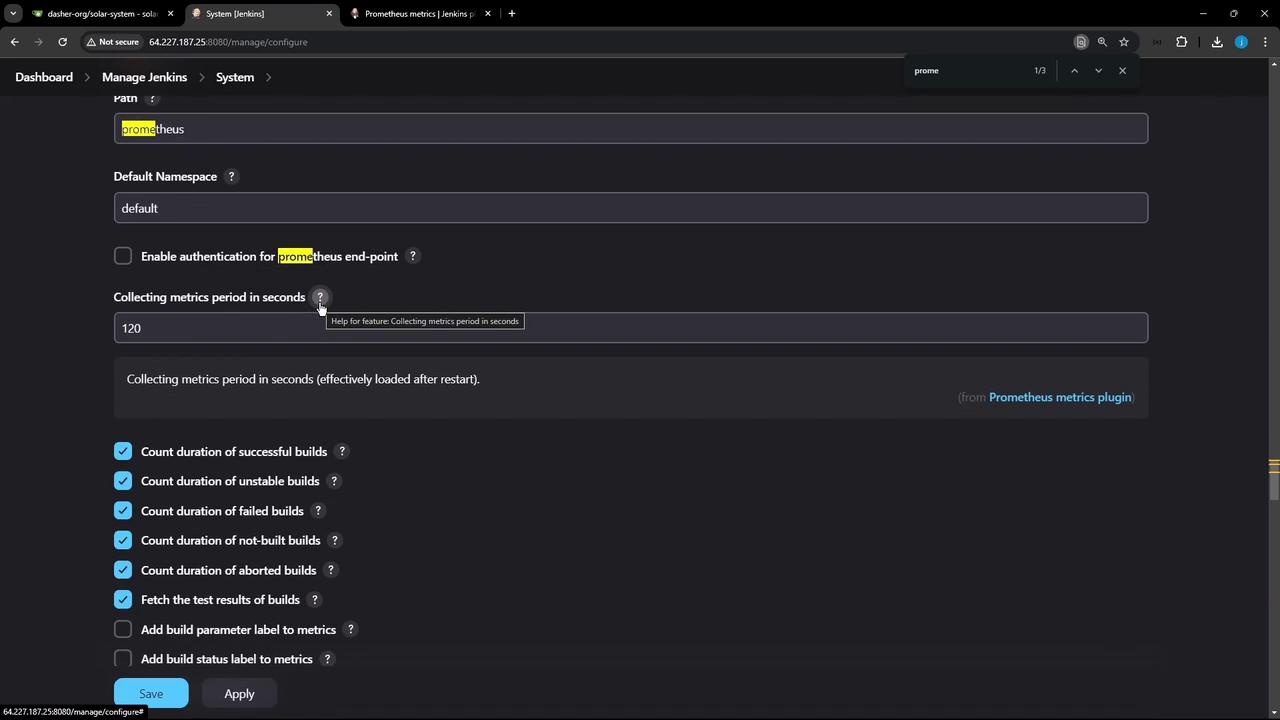
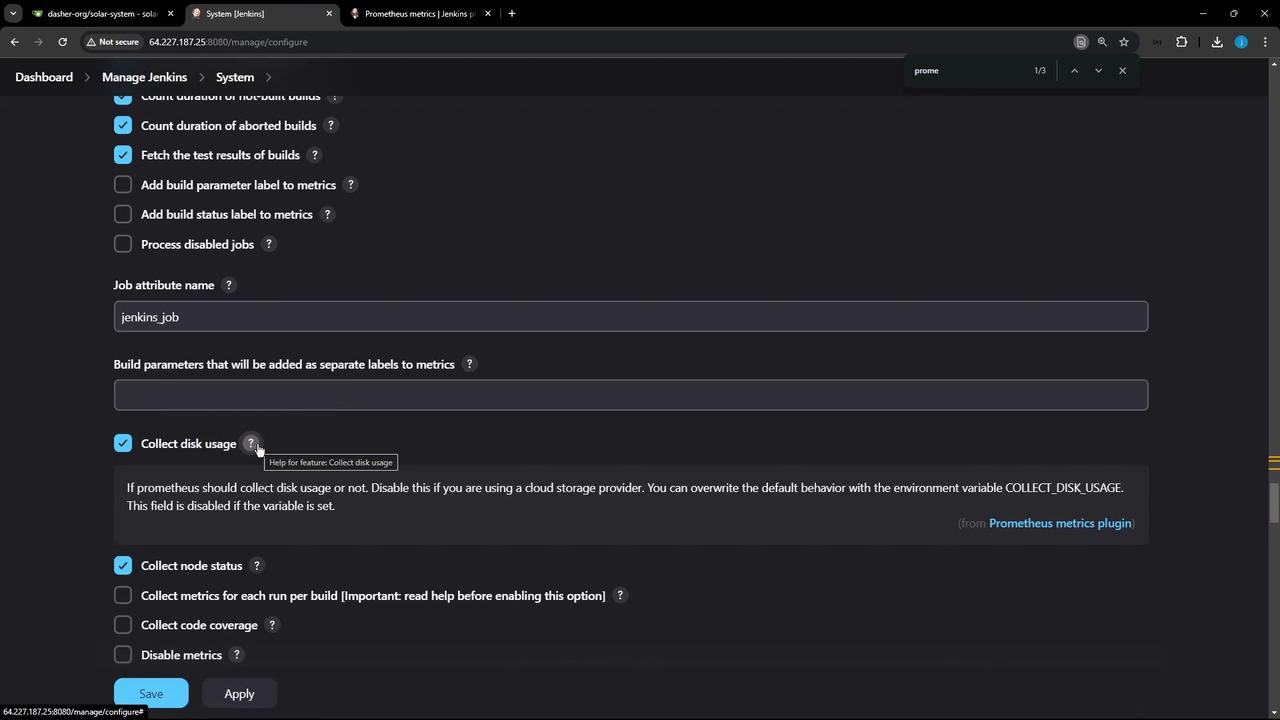
- For rapid feedback, set Metrics collection period to 10 seconds. Enable or disable metrics (disk usage, node status, etc.).
2. Deploy Prometheus and Grafana with Docker Compose
Create a project directory (e.g.,prometheus-grafana/) with:
docker-compose.ymlprometheus/prometheus.yml
docker-compose.yml:
2.1 Service Overview
| Service | Image | Ports | Data Volume |
|---|---|---|---|
| prometheus | prom/prometheus | 9090:9090 | ./prometheus:/etc/prometheus, prom_data |
| grafana | grafana/grafana | 8081:3000 | ./grafana:/etc/grafana/provisioning/datasources |
2.2 Prometheus Configuration
Inprometheus/prometheus.yml, set global options and scrape jobs:
<jenkins-host> and <jenkins-port> with your Jenkins address (e.g., jenkins-controller:8080).
If you’re not using Alertmanager, you can remove or comment out the
alerting: section above.2.3 Launch the Stack
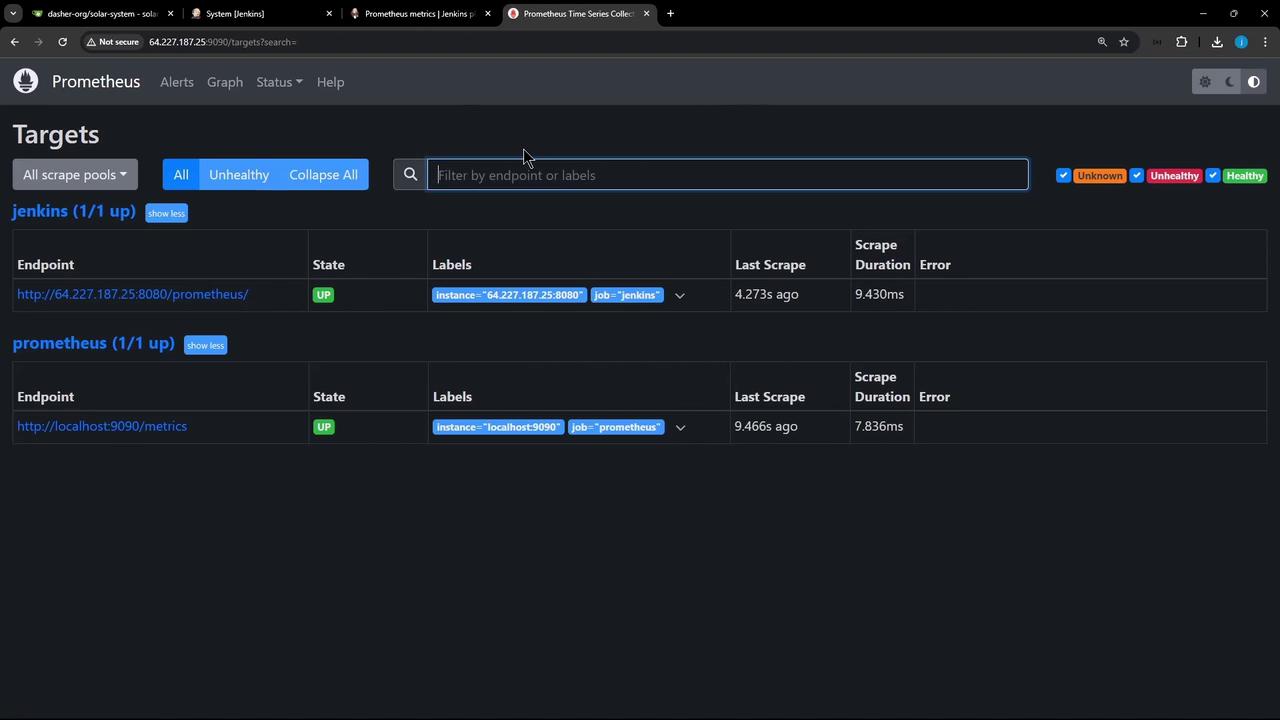
3. Verify in Prometheus
- Open
http://<vm-ip>:9090in your browser. - Go to Status » Targets. Both prometheus and jenkins targets should be UP.
3.1 Query Example: Jenkins Job Count
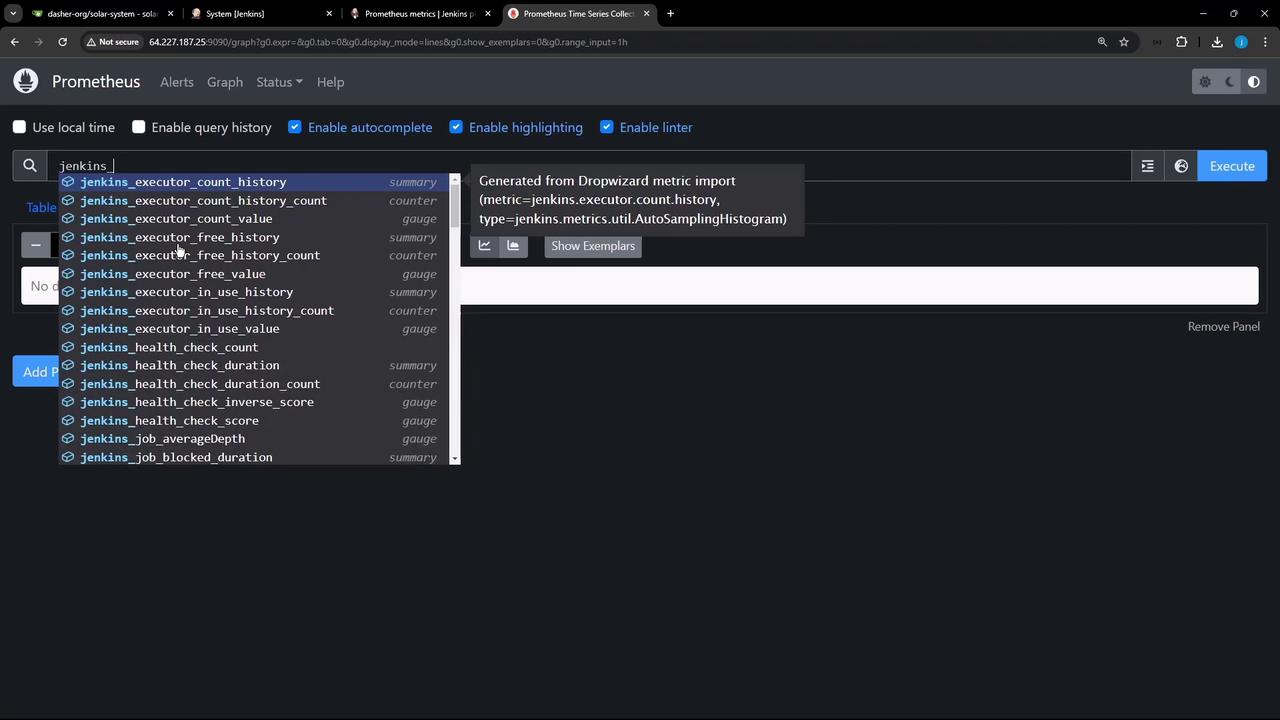
- Navigate to Graph.
-
Enter the query:
-
Click Execute. You may see output like:
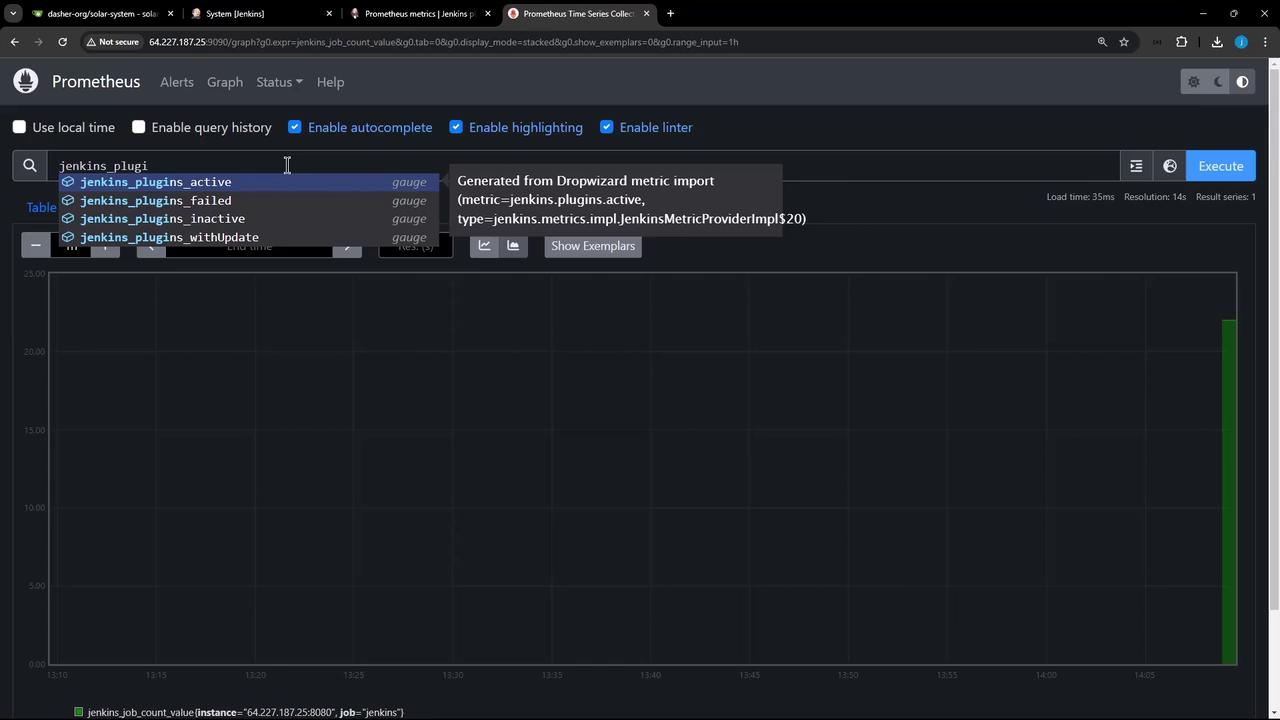
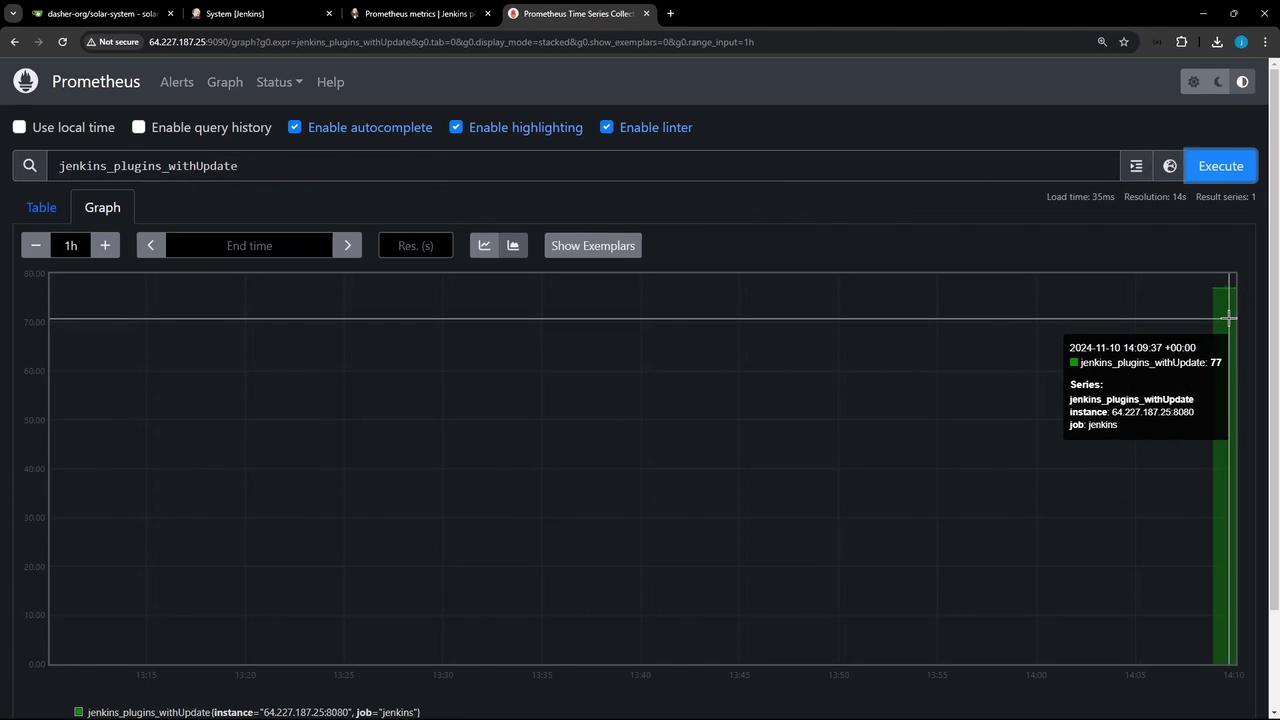
3.2 Plugin Metrics
-
Active plugins:
-
Plugins requiring updates:
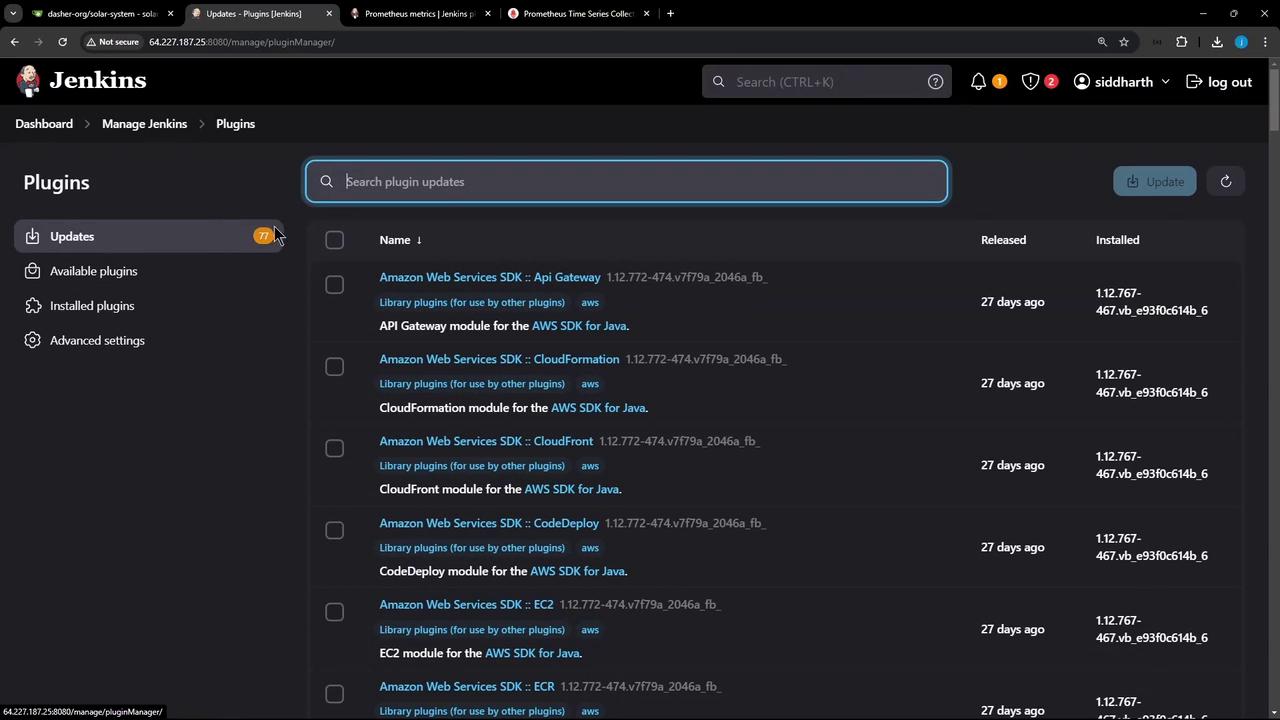
4. Visualize in Grafana
- Open Grafana at
http://<vm-ip>:8081. Log in as admin/password. - Go to Configuration » Data Sources, and add or verify Prometheus pointing to
http://prometheus:9090.
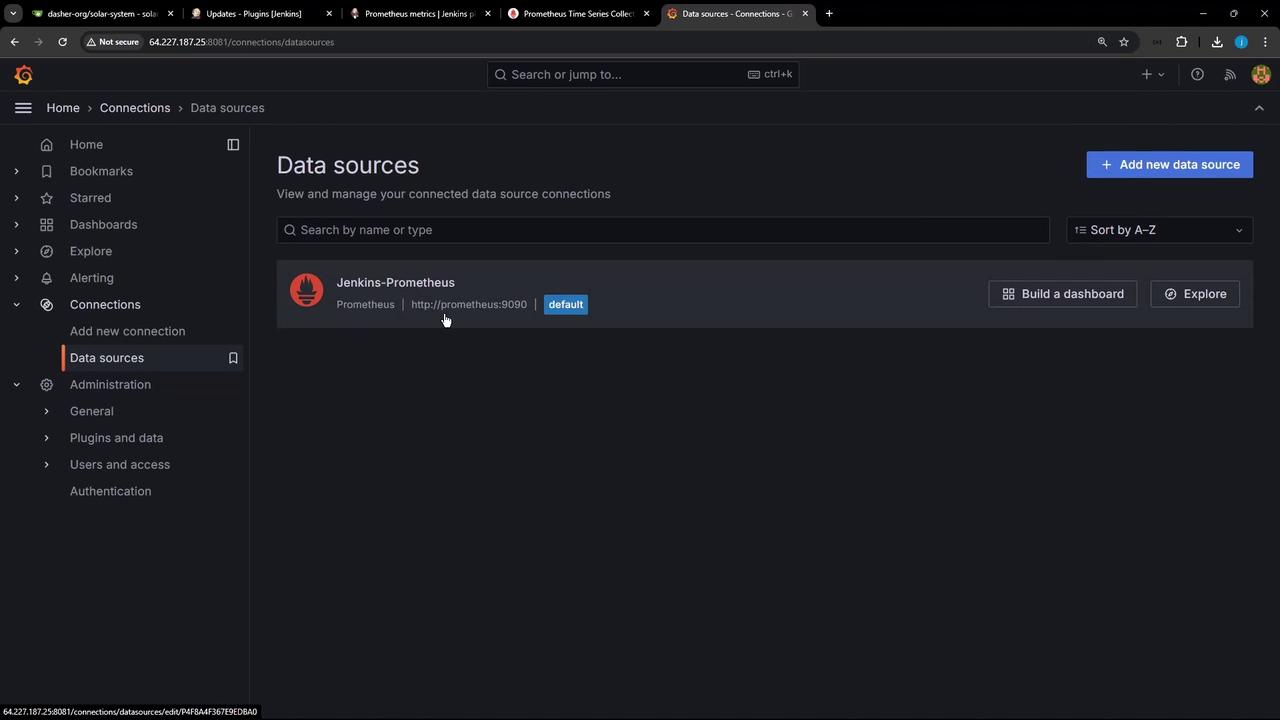
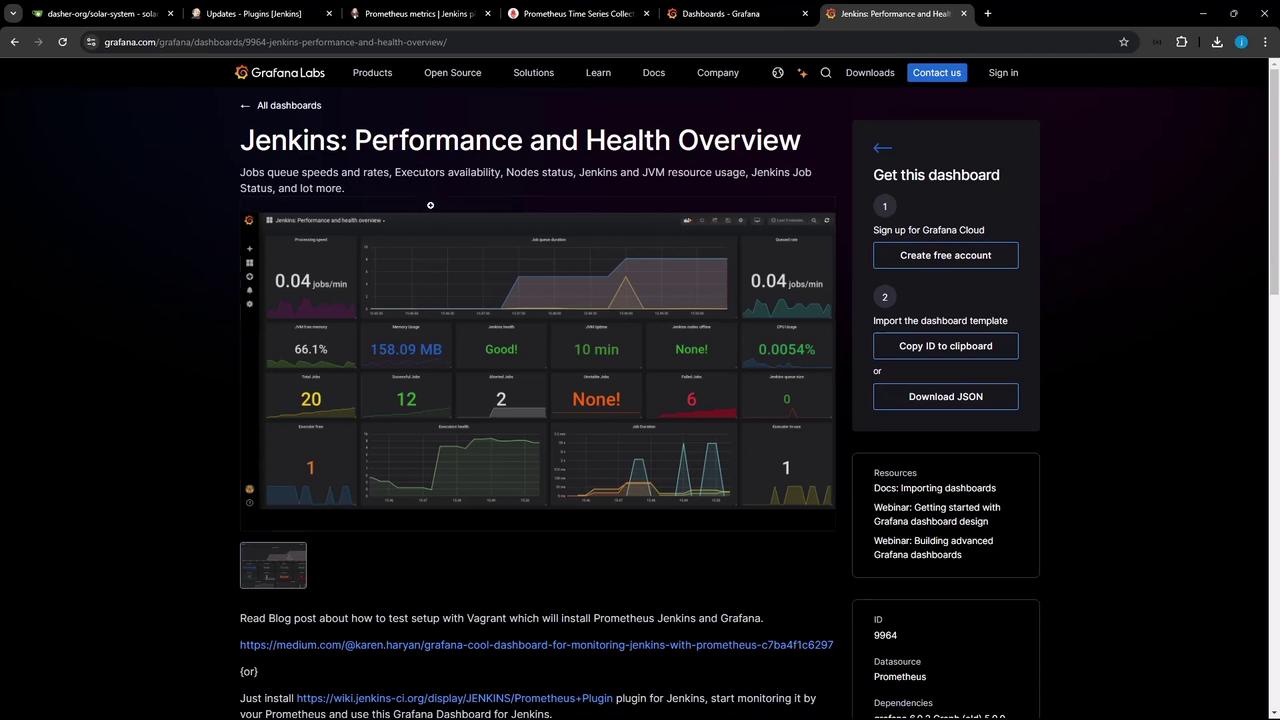
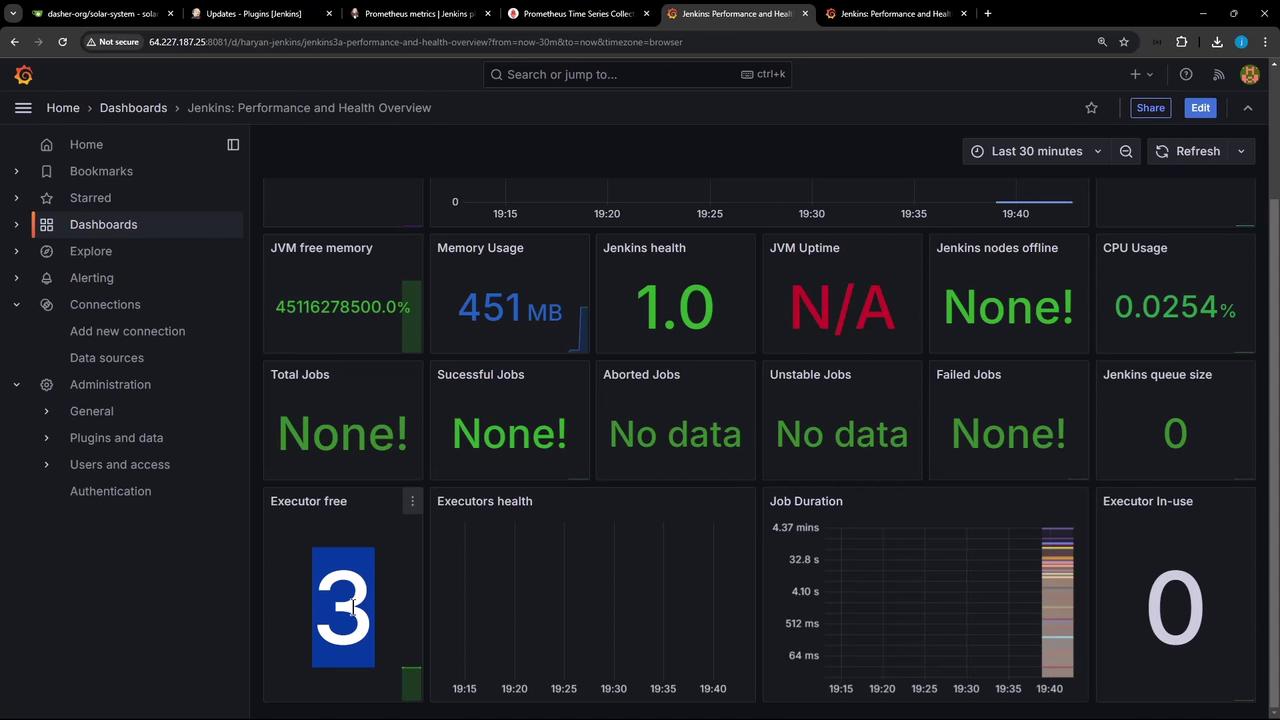
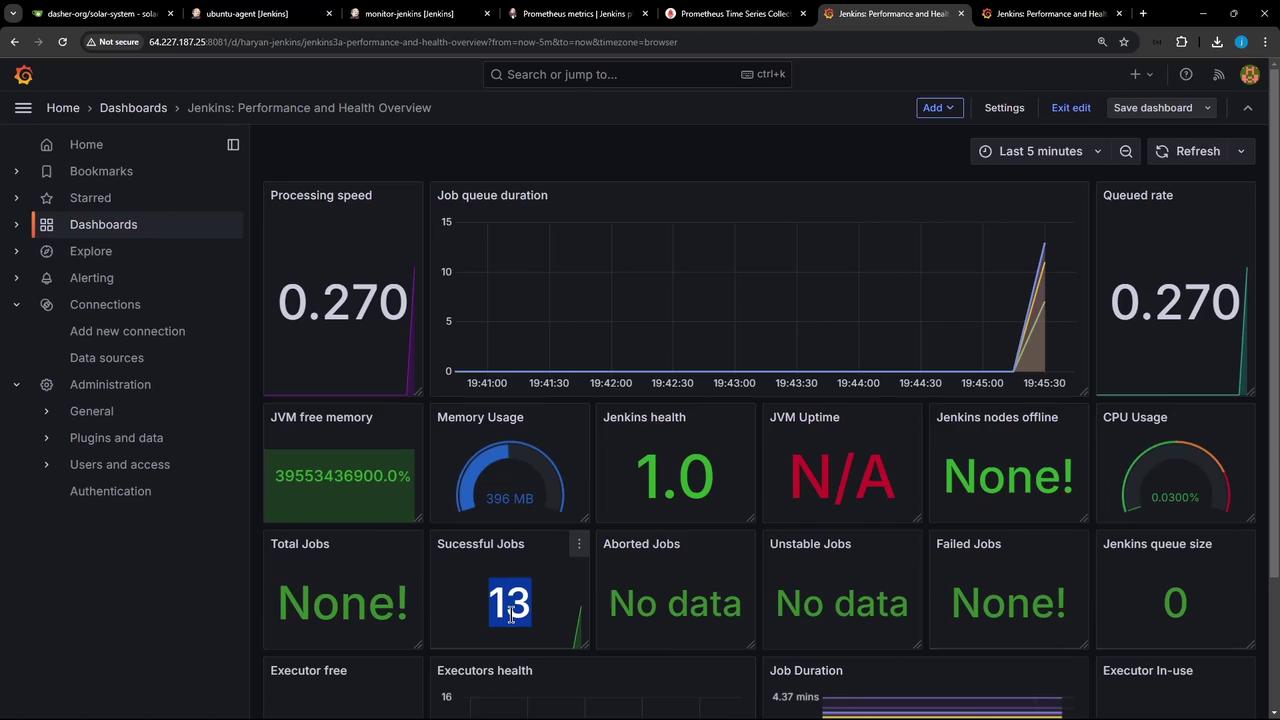
- Click Create » Import, enter Dashboard ID 9964, select your Prometheus data source, and import.
5. Generate Live Data with a Sample Pipeline
Before adding load, revisit plugin updates: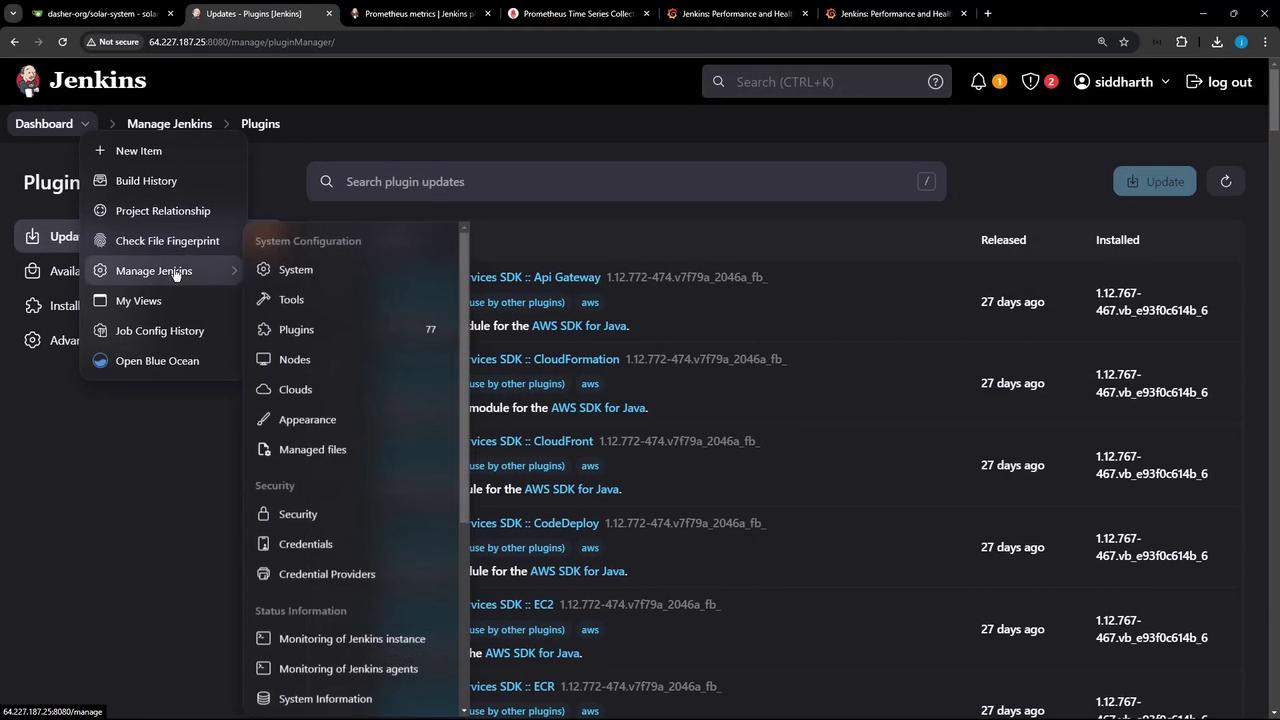
5.1 Create a New Pipeline Job
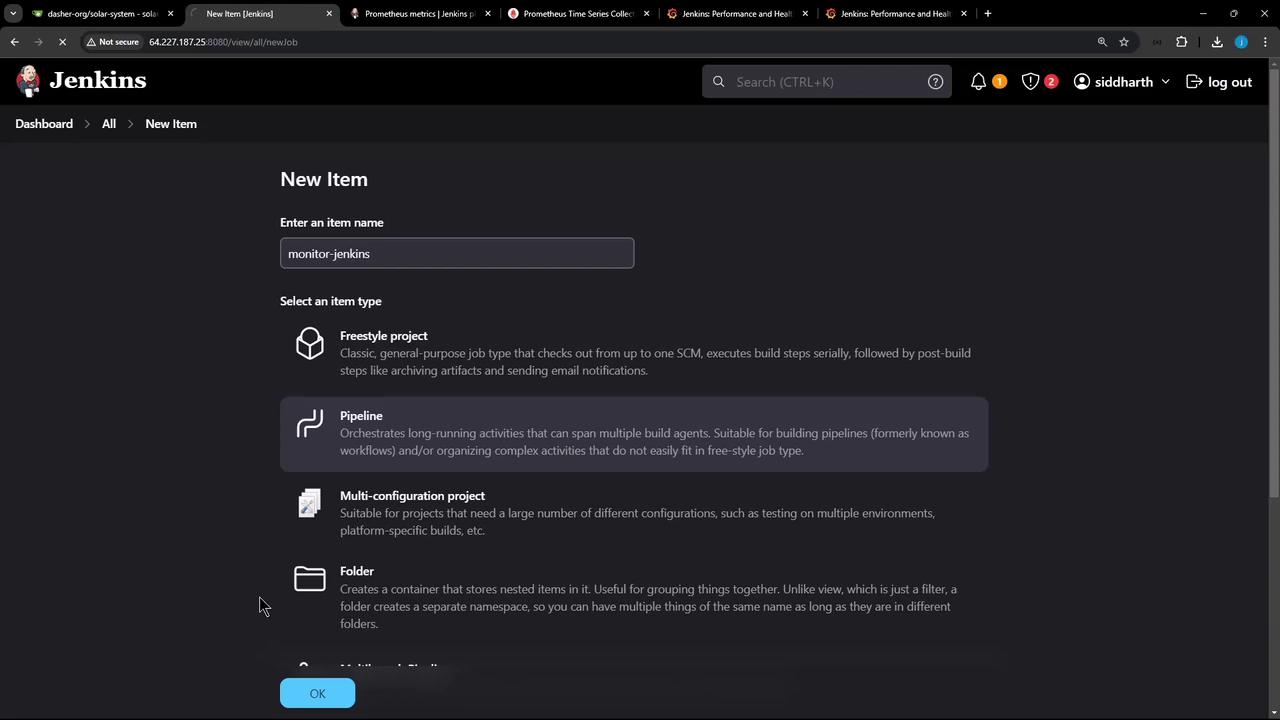
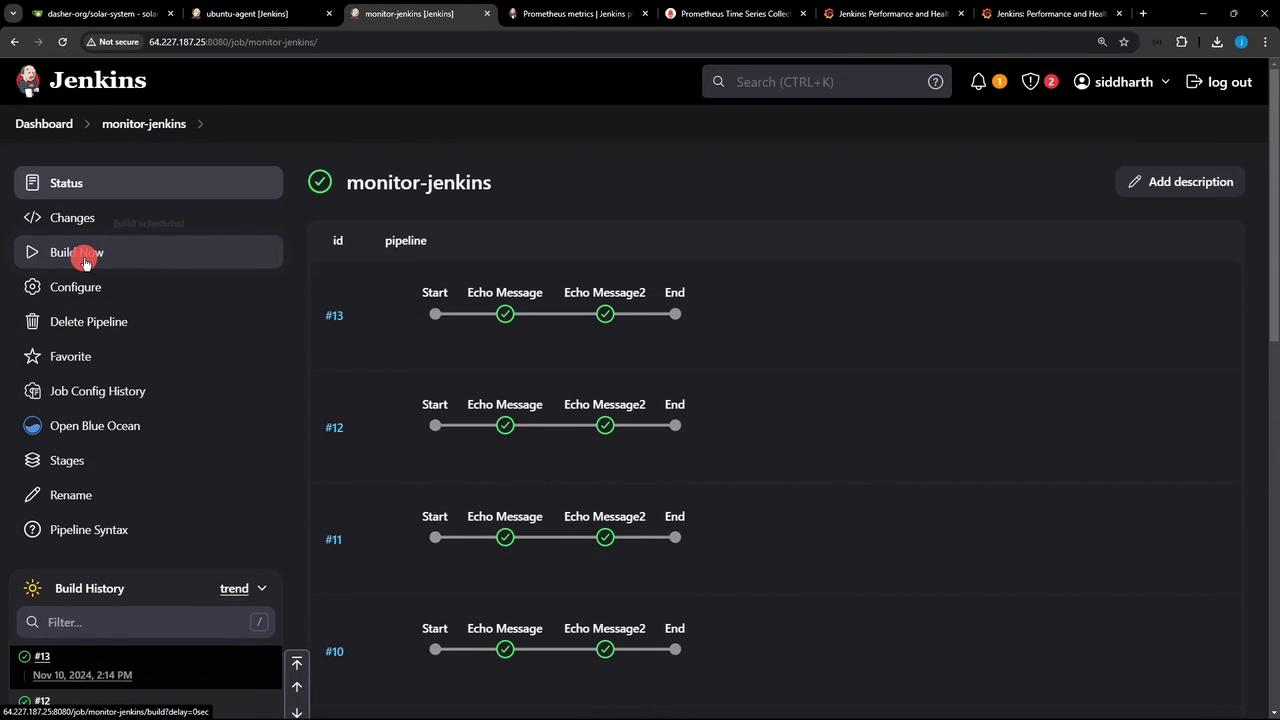
- Click New Item, name it monitor-jenkins, choose Pipeline, then click OK.
-
In Pipeline » Script, add:
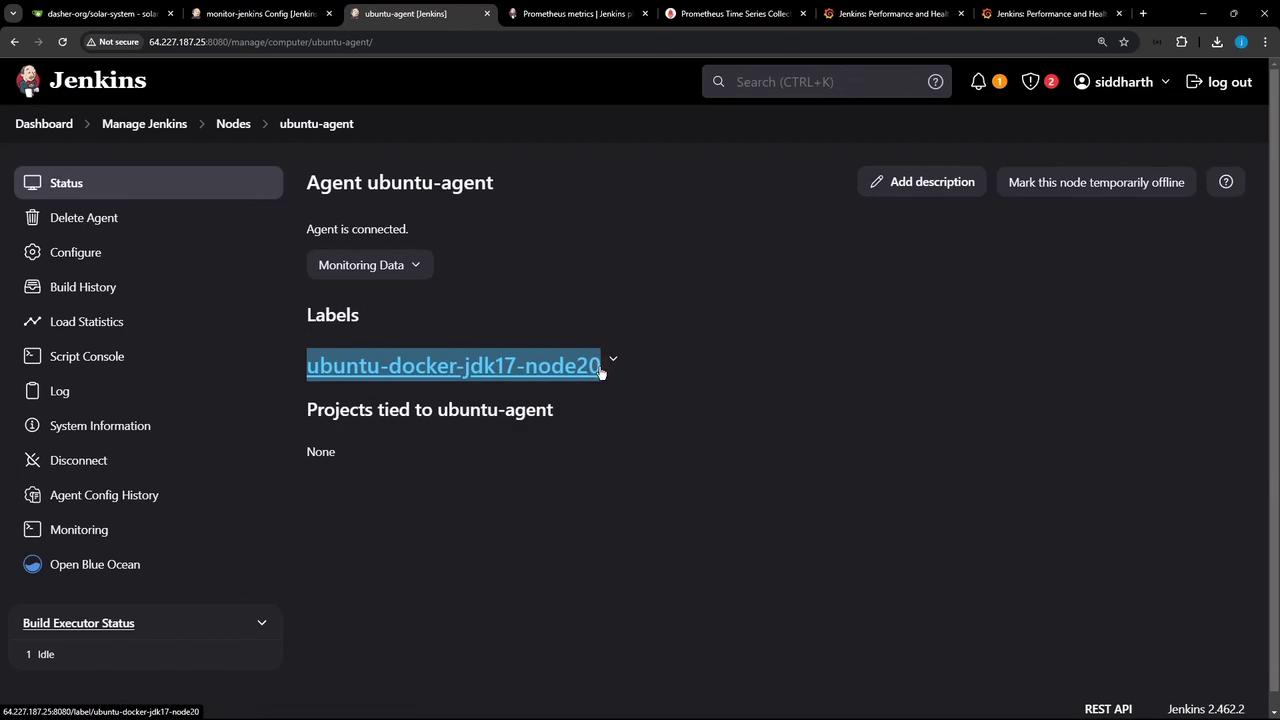
- Verify your agent label under Manage Jenkins » Manage Nodes.
- Save and click Build Now 10–20 times to generate metrics.
6. Customize Grafana Panels & Observe Metrics
You can tailor any panel—switch from time series to gauge, adjust thresholds, and more: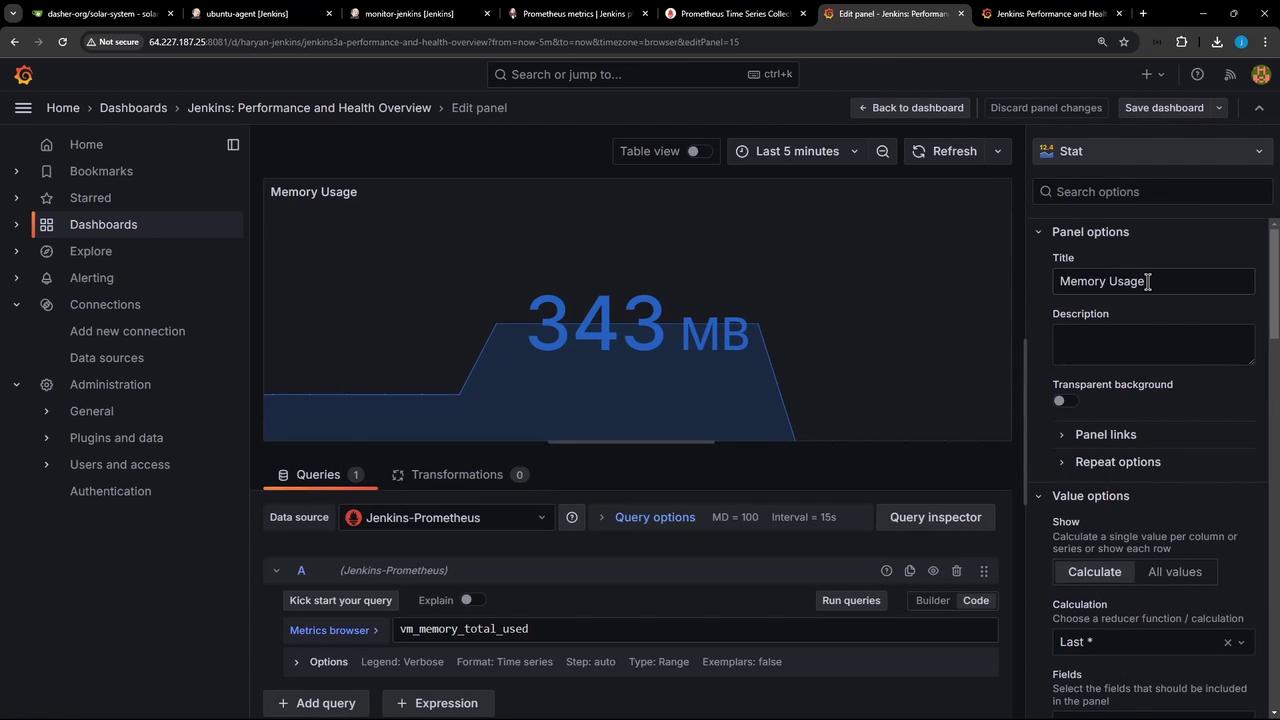
Conclusion
By following these steps—installing the Prometheus Metrics Plugin, deploying Prometheus/Grafana, scraping Jenkins metrics, and importing a dashboard—you can achieve comprehensive real-time monitoring of your Jenkins environment. Customize scrape intervals, panel types, and alert rules to suit production requirements. Happy monitoring!Links and References
- Jenkins Prometheus Metrics Plugin
- Prometheus Documentation
- Grafana Documentation
- Docker Compose Overview