This tutorial walks you through extending your Jenkins Pipeline to generate code coverage metrics, handle coverage failures gracefully with catchError, and publish an HTML coverage report. You’ll update your Jenkinsfile, use the Credentials Binding and HTML Publisher plugins, and ensure downstream stages always run.

Pipeline Stages Overview

1. Add the Code Coverage Stage

Open your Jenkinsfile and duplicate the Unit Testing stage for coverage:
Commit and push to trigger a new build.

2. Observe the Coverage Failure

If coverage falls below your global threshold (e.g., 90%), the pipeline will fail:
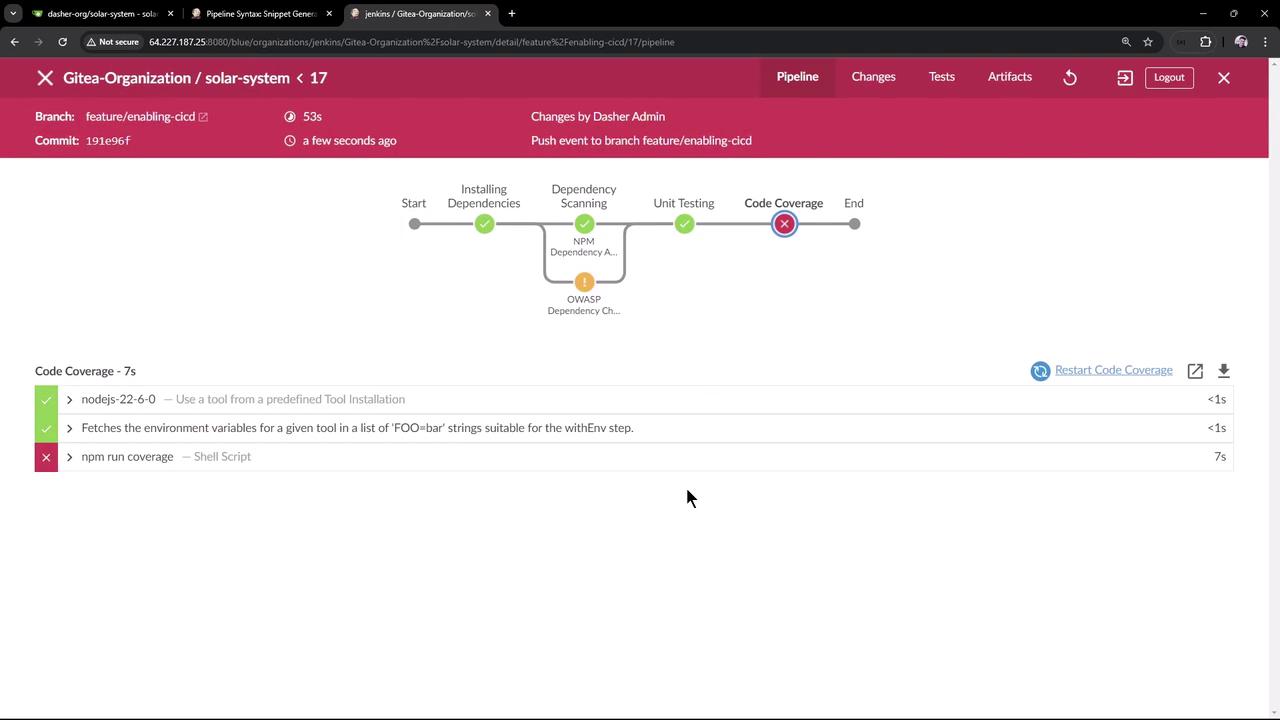
The image shows a Jenkins pipeline interface for a project named "solar-system," displaying the stages of a build process with a failure at the "Code Coverage" stage. The details below indicate a failed "npm run coverage" shell script."

3. Introduce catchError

Wrap the coverage command in catchError so the stage becomes UNSTABLE instead of FAILED, allowing later stages to run.
The catchError step lets you control both the stage and build result. For full syntax, see the Jenkins Pipeline Syntax reference.
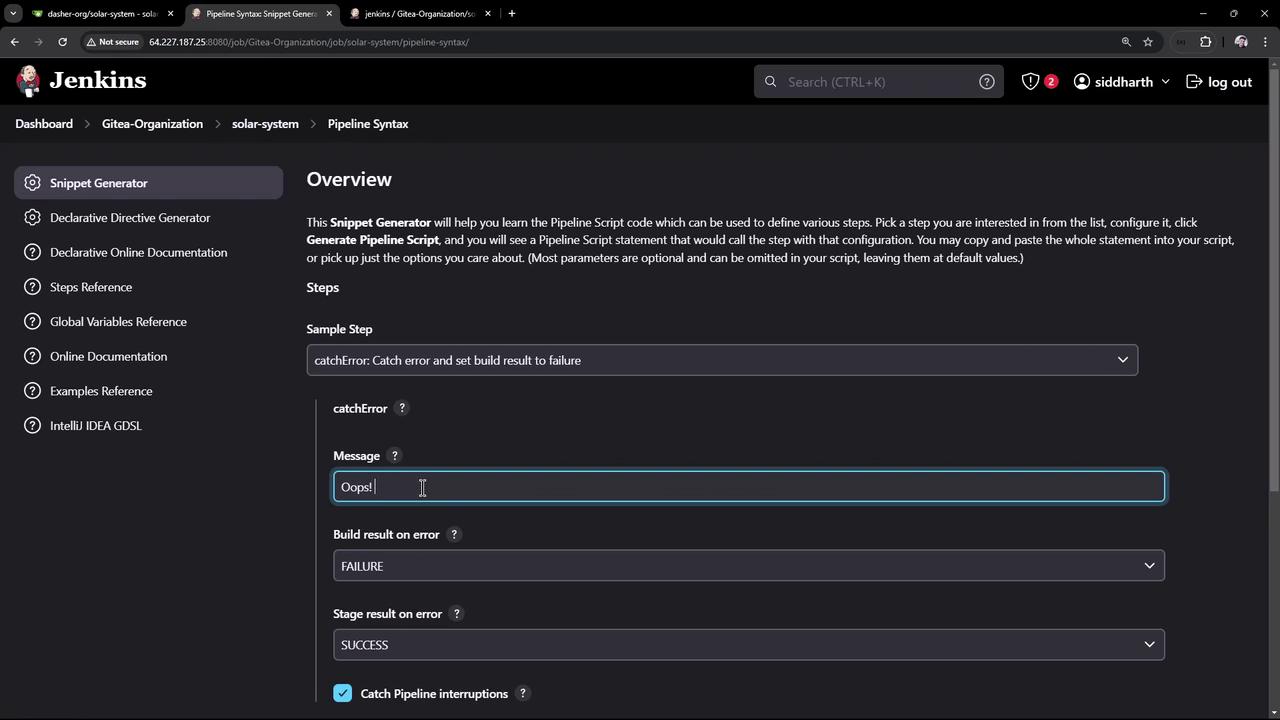
Example using the Snippet Generator or manual insertion:
The image shows a Jenkins interface with a "Snippet Generator" for creating pipeline scripts. It includes options for handling errors, with a message input field containing "Oops!" and settings for build and stage results on error.

4. Update the Jenkinsfile

Combine catchError with the HTML Publisher plugin to publish coverage reports:
Push your changes.

5. Verify the Results

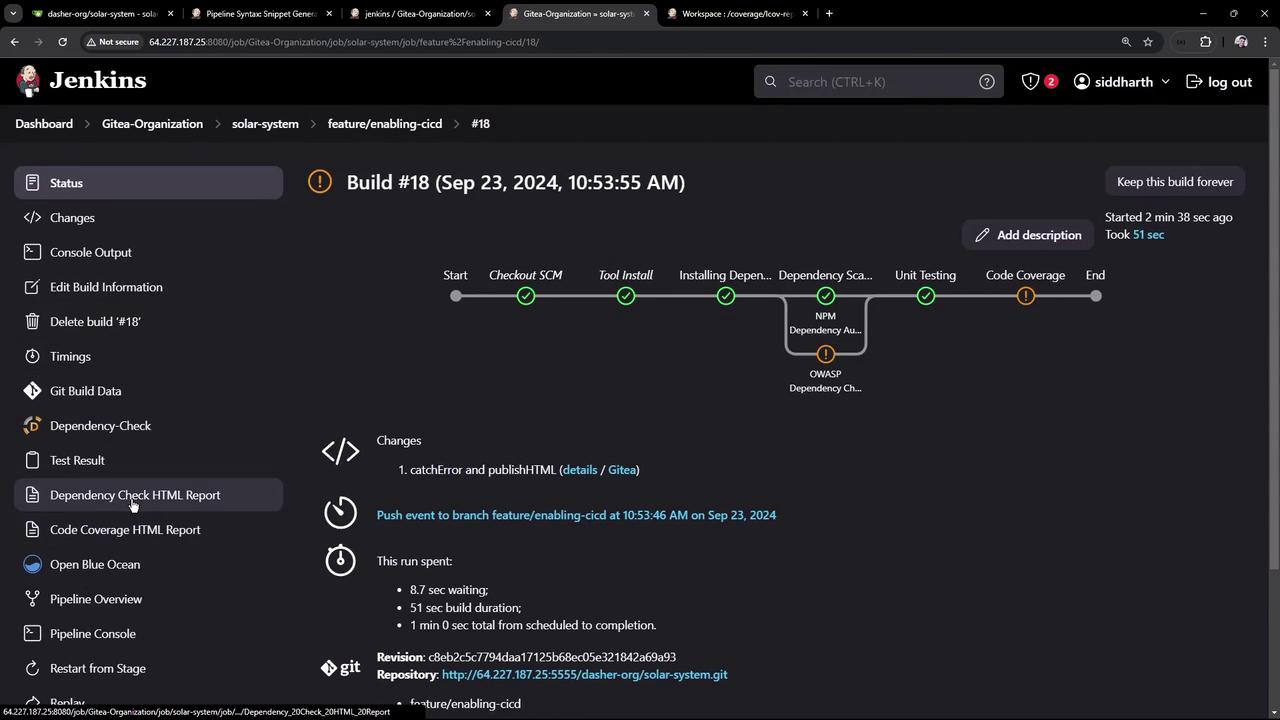
Rerun the pipeline. The Code Coverage stage will be marked UNSTABLE and subsequent stages will still execute. View the build history and status in the Jenkins dashboard:
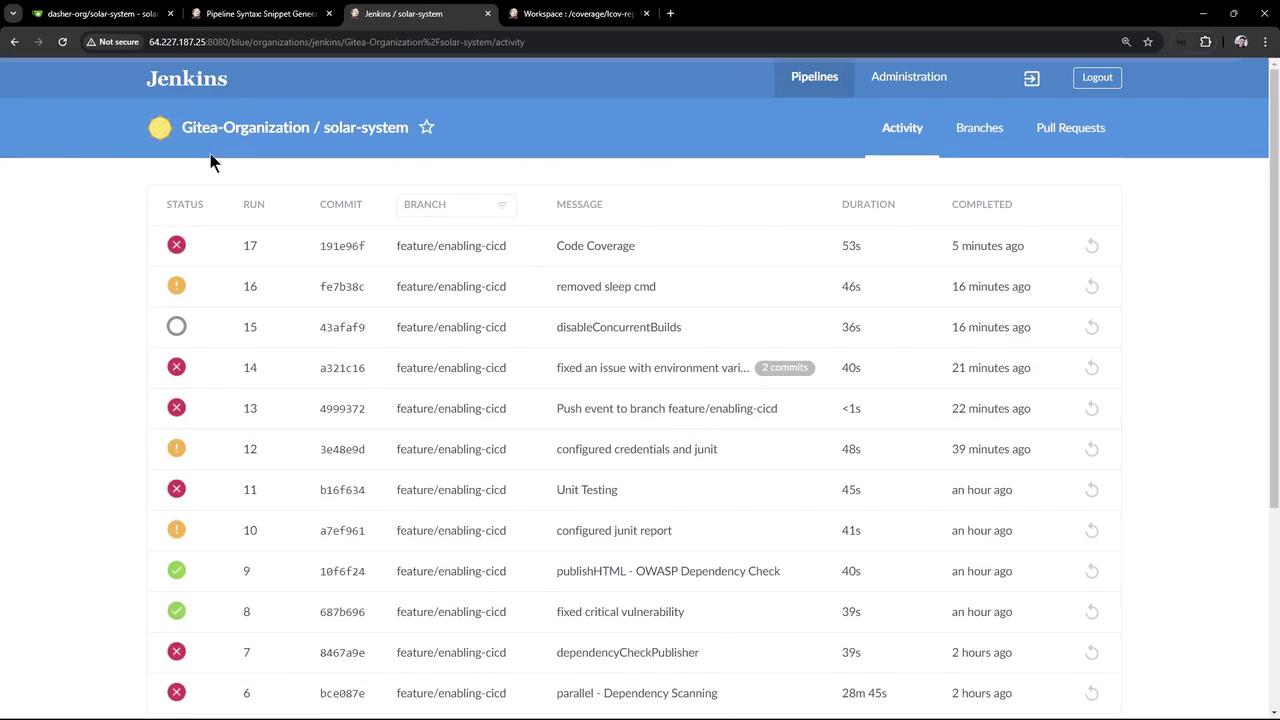
The image shows a Jenkins dashboard displaying a list of recent build activities for a project named "solar-system" under the "Gitea-Organization." It includes details such as status, run number, commit ID, branch, message, duration, and completion time.
In the Pipeline view, stages reflect their new statuses:
The image shows a Jenkins build pipeline interface, displaying the status of various stages such as SCM checkout, tool installation, dependency scanning, and unit testing, with some stages marked as successful and others with issues.

6. View the HTML Coverage Report

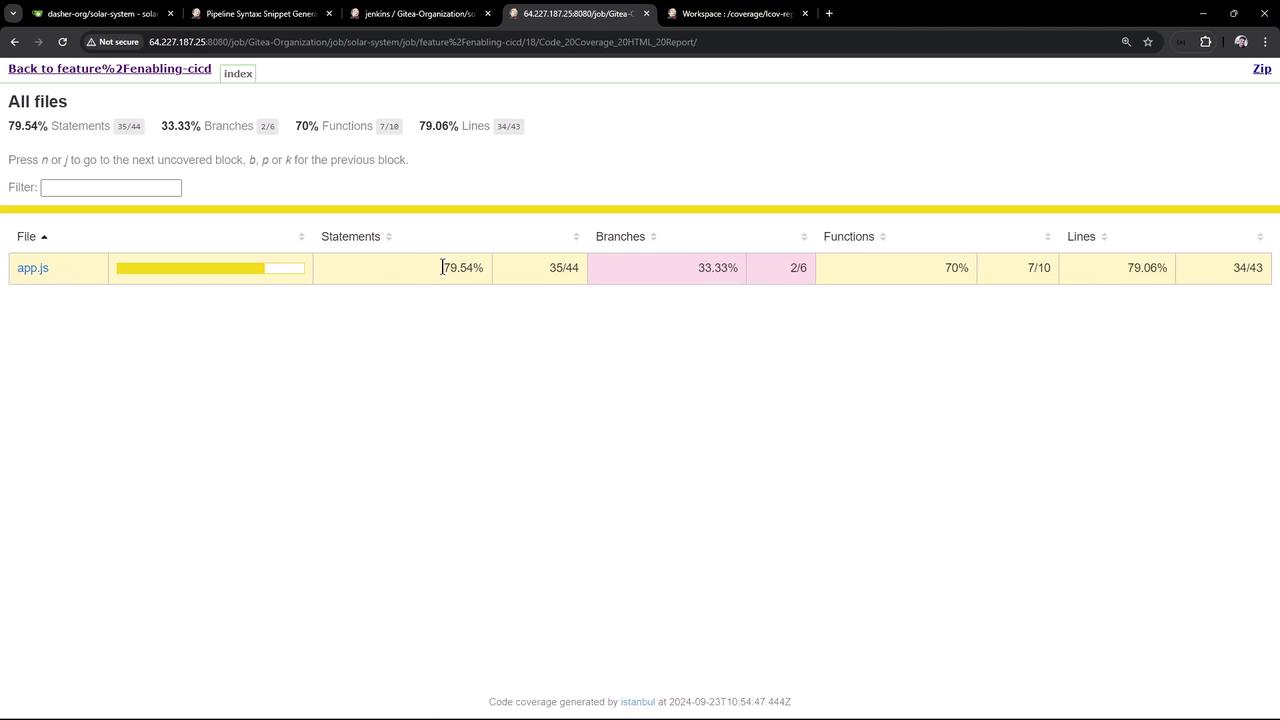
Click Code Coverage HTML Report in Jenkins to open coverage/lcov-report/index.html. You’ll see detailed metrics for each file—e.g., for app.js:
  • Statement coverage: 79.54%
  • Branch coverage: 33.33%
  • Function coverage: 70%
  • Line coverage: 79.06%
The image shows a code coverage report for a file named "app.js," indicating 79.54% statement coverage, 33.33% branch coverage, 70% function coverage, and 79.06% line coverage.
You can also view this report in Blue Ocean or any HTML-compatible Jenkins plugin.

Watch Video