

- Define TrivyScan methods in your shared library
- Configure the global pipeline library in Jenkins
- Override the default library version using a feature branch
- Invoke the
vulnerabilityandreportsConvertermethods inside a declarative pipeline - Wrap library calls in
scriptblocks to comply with pipeline syntax - View generated reports and Slack notifications
1. Define TrivyScan Methods in Your Shared Library
Createvars/TrivyScan.groovy in your shared library repository with two methods:
- vulnerability: Runs Trivy image scans with different severity thresholds
- reportsConverter: Converts JSON scan results into HTML and JUnit XML
2. Configure Jenkins Global Pipeline Library
In Jenkins, go to Manage Jenkins → Configure System → Global Pipeline Libraries and add or update your library: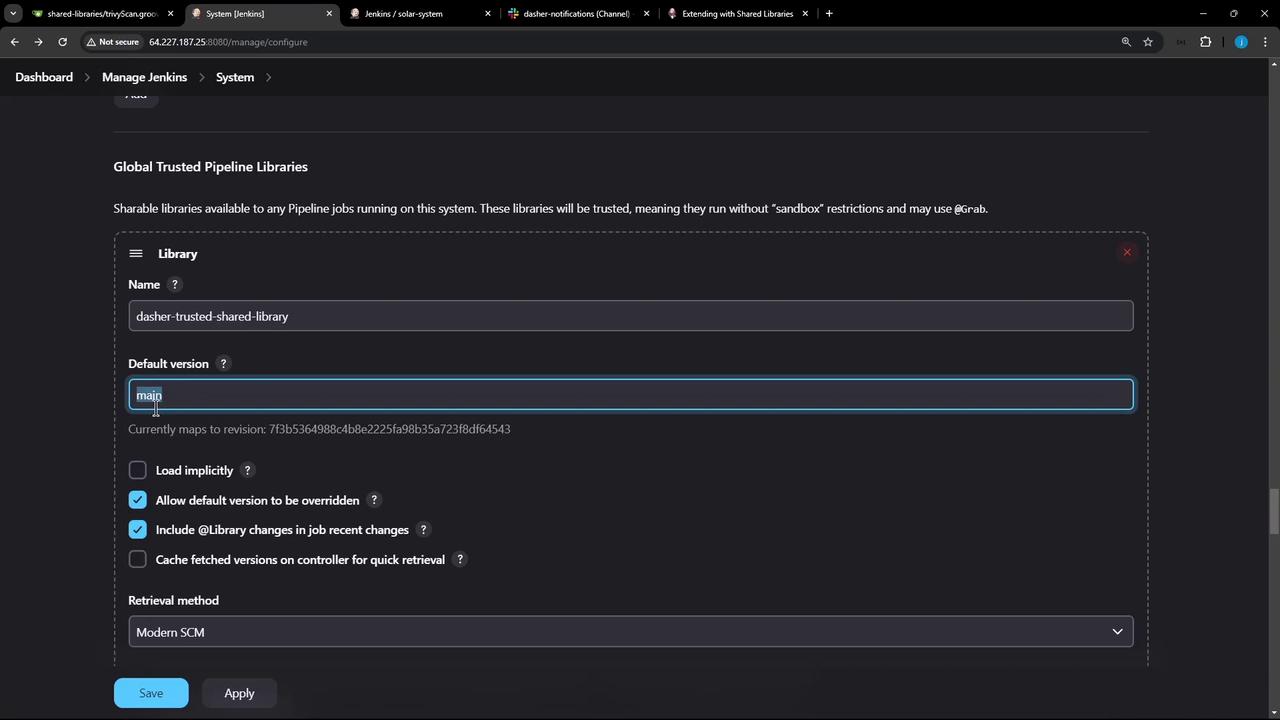
@Library annotation.
3. Load a Specific Library Version in Your Jenkinsfile
At the very top of yourJenkinsfile, reference the feature branch:
trivyScan methods available to your pipeline.
4. Invoke TrivyScan Methods in a Declarative Pipeline
Below is a sample Declarative Pipeline that:- Builds a Docker image
- Runs Trivy scans
- Converts scan results to HTML and JUnit
- Publishes the reports
In Declarative Pipelines, any method calls on shared library objects must be wrapped inside a
script {} block to avoid syntax errors.5. View Pipeline Output and Reports
Once you push your branch, Jenkins will trigger a build. In the Console Output, look fortrivy image ... commands:
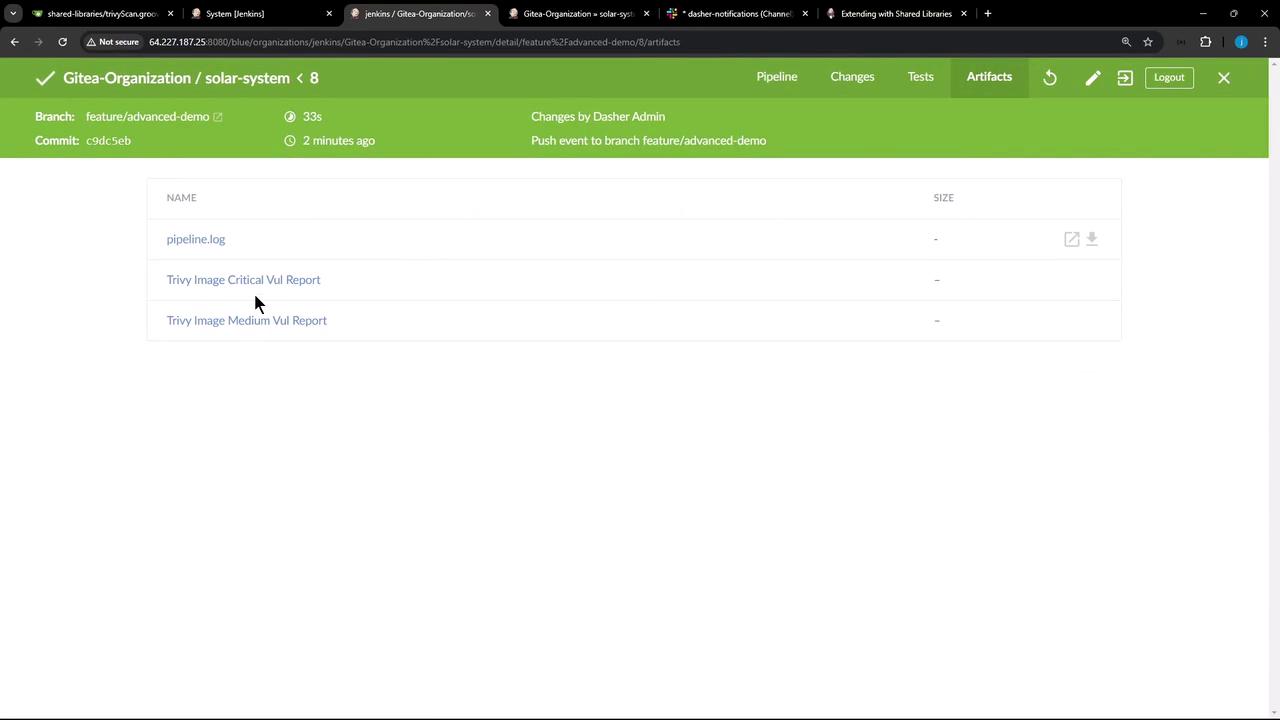
6. Verify Slack Notifications
If you also have a Slack notifications shared library on this branch, you should see build alerts in your channel: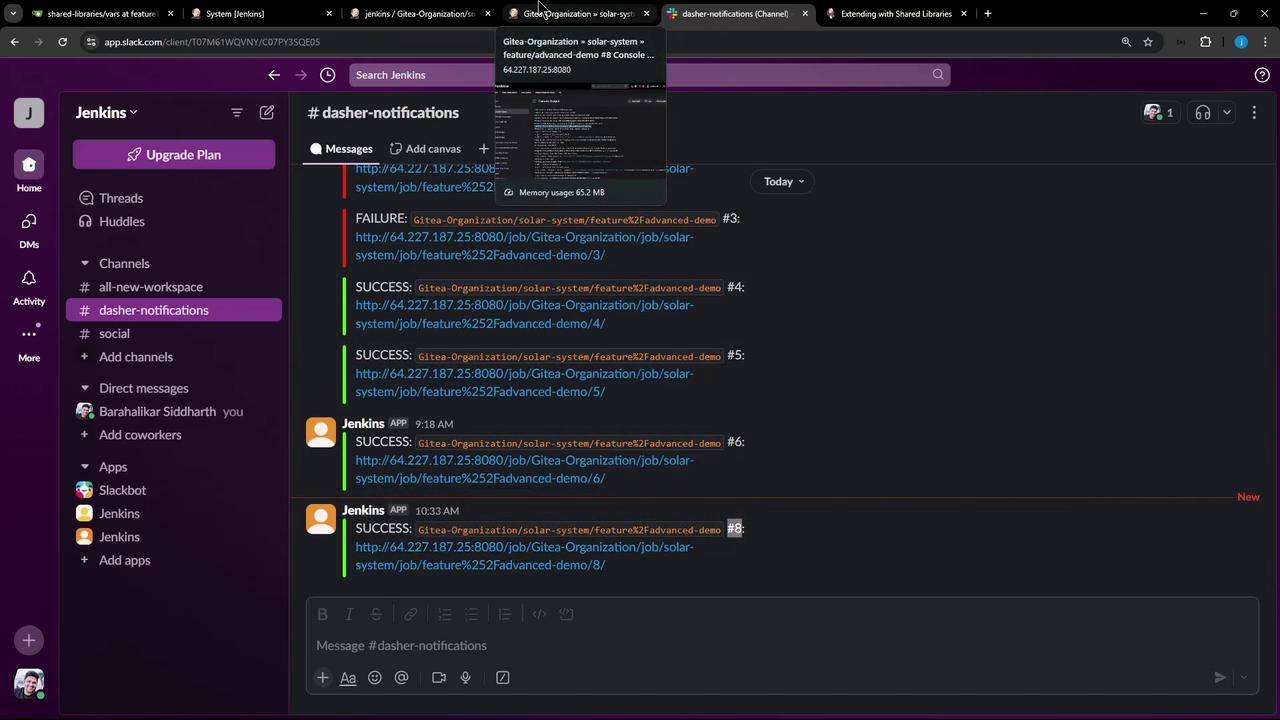
Make sure your Slack token and channel are configured securely in Jenkins credentials to prevent unauthorized access.
Links and References
- Jenkins Pipeline Shared Libraries
- Trivy: A Simple and Comprehensive Vulnerability Scanner
- publishHTML Plugin