- Setting up Elastic Cloud Observability
- Installing the Elastic Agent on your Jenkins controller
- Configuring the agent to read Jenkins audit logs
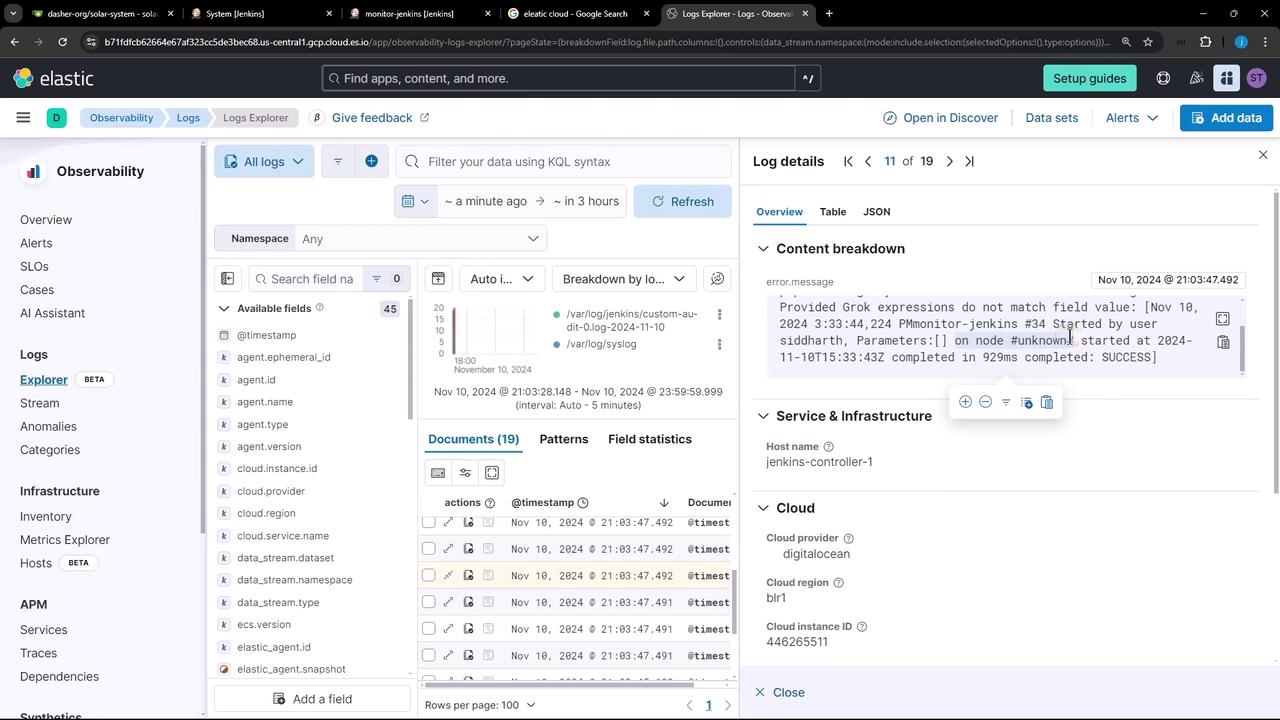
- Verifying audit entries in Kibana
1. Set Up Elastic Cloud Observability
- Sign up for an Elastic Cloud trial on elastic.co.
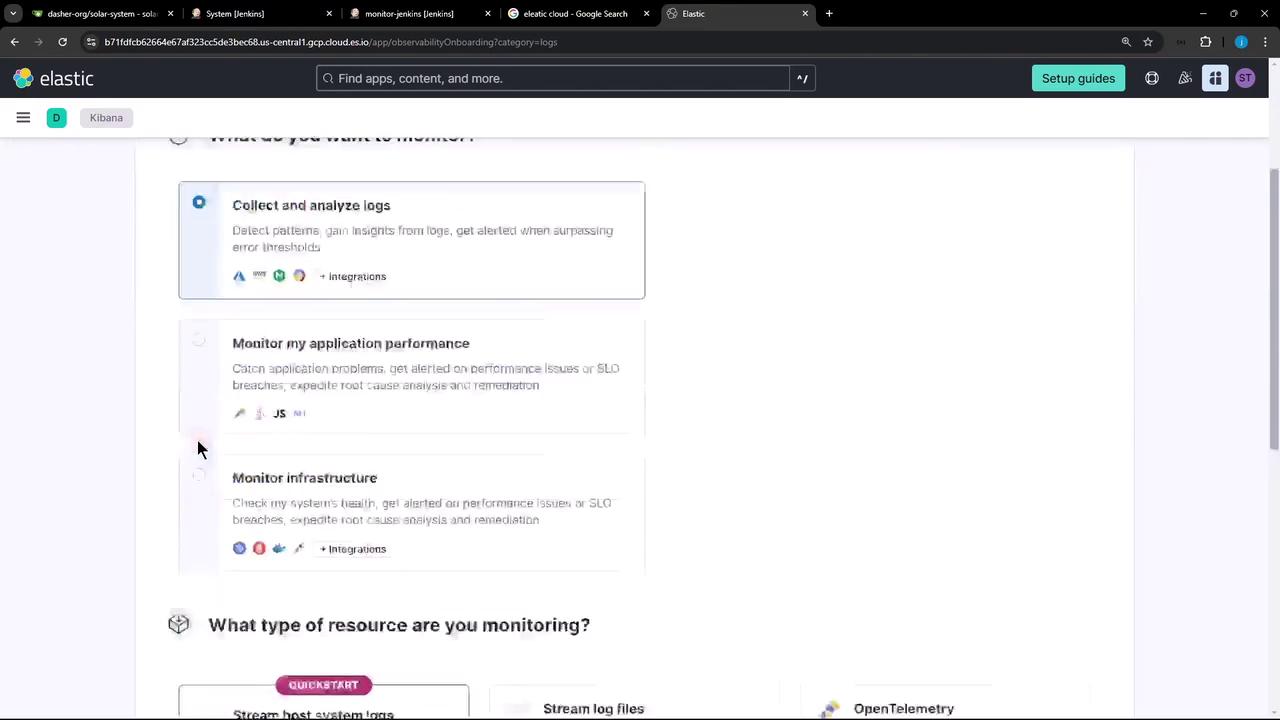
- In the Elastic Cloud console, go to Observability → Logs and click Collect and analyze logs.
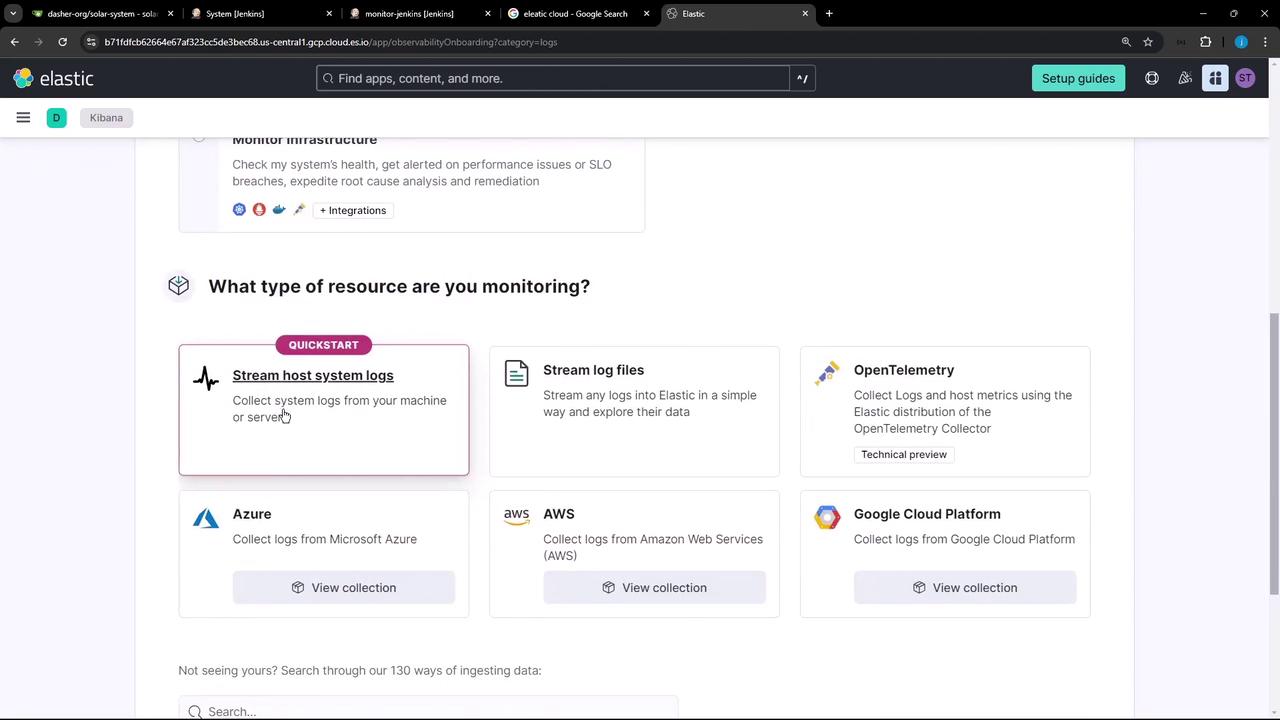
- Choose Host system logs as your resource type.
- Follow the prompts to install the Elastic Agent and generate an API key for onboarding.
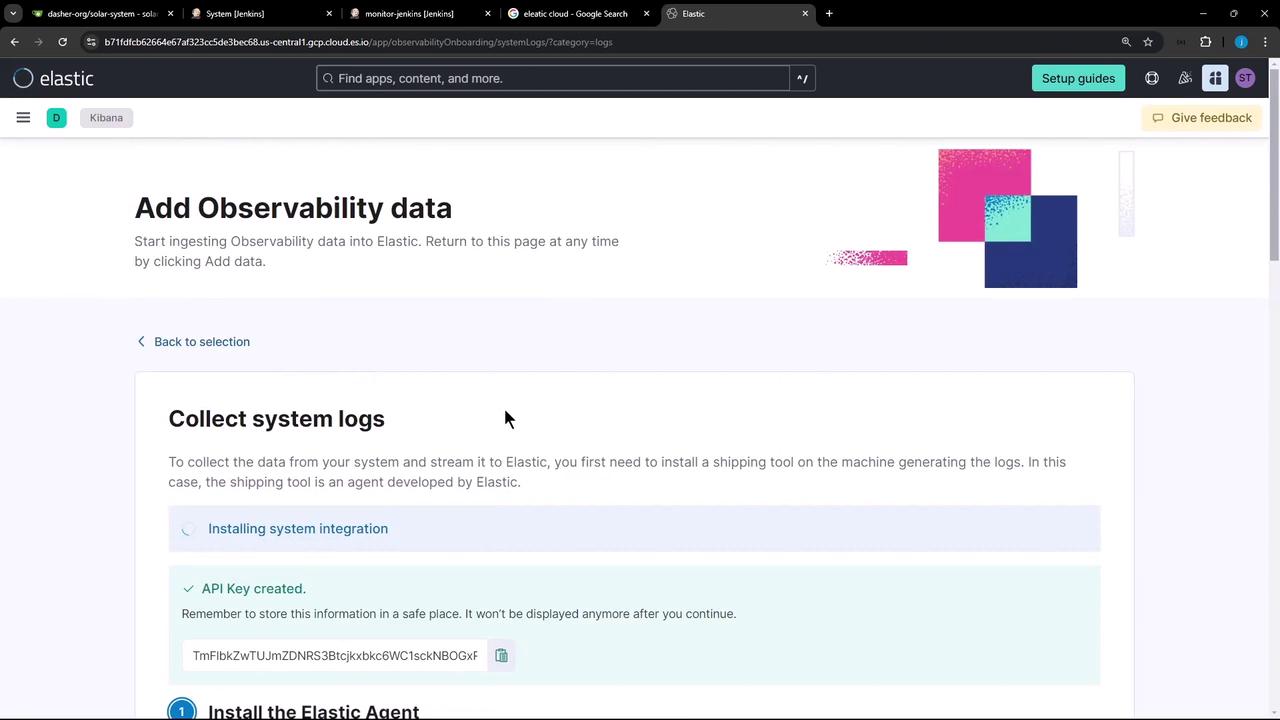
Your Elastic Cloud trial includes full access to Observability features. Save the API key securely, as you’ll need it for agent enrollment.
2. Install the Elastic Agent on the Jenkins Controller
On your Jenkins controller shell, download and run the provided installation script. Replace the placeholders with your API key and Cloud endpoint URL:- Download and unpack the Elastic Agent
- Enroll the agent using your API key and endpoint
- Place the main config at
/opt/Elastic/Agent/elastic-agent.yml
3. Configure the Agent to Stream Audit Logs
Edit the agent configuration as root:3.1 Define the Elasticsearch Output
Locate (or add) theoutputs section and update it with your Cloud URL and API key:
3.2 Add Log File Inputs
Belowoutputs:, include inputs to capture Jenkins audit files from /var/log/jenkins/custom*:
Ensure indentation and quotation marks are correct in
elastic-agent.yml. A YAML syntax error will prevent the agent from starting.3.3 Restart the Agent
Apply your changes:4. Verify Logs in Kibana
- In Kibana, open Observability → Logs.
- Refresh the interface; you should see Jenkins audit events streaming in.
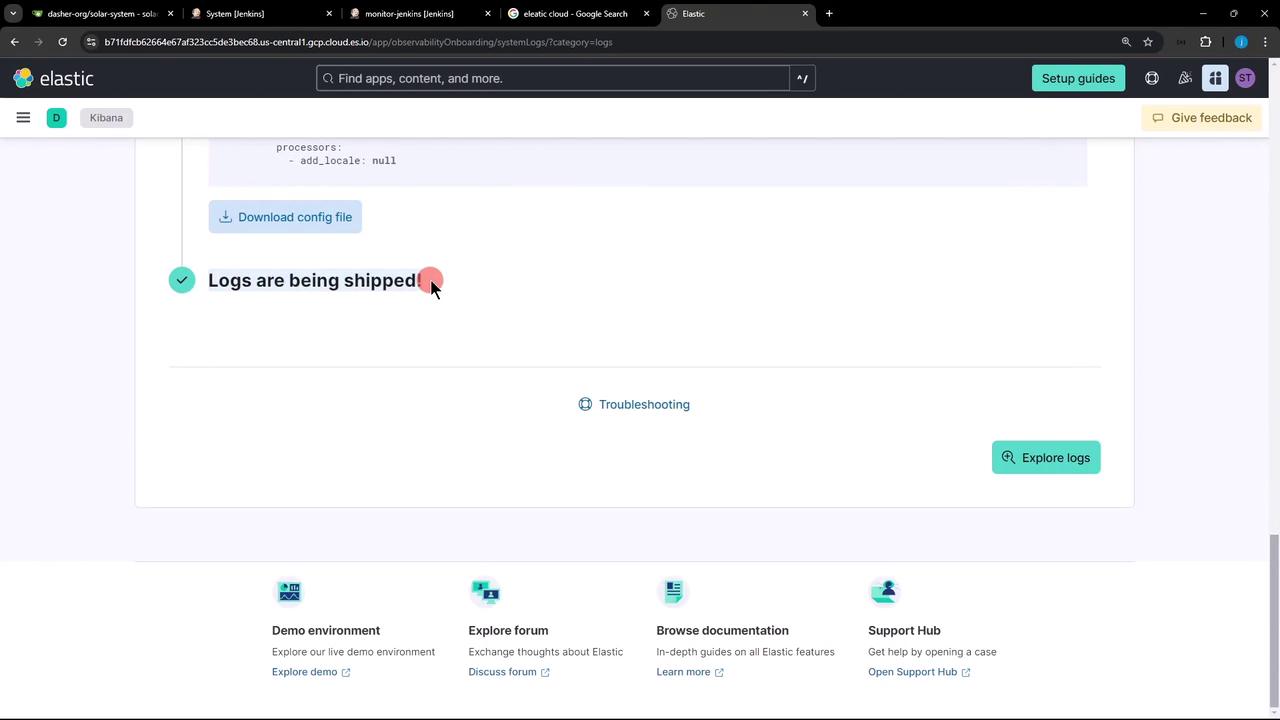
- Click Explore logs to filter, search, and analyze your audit data.