

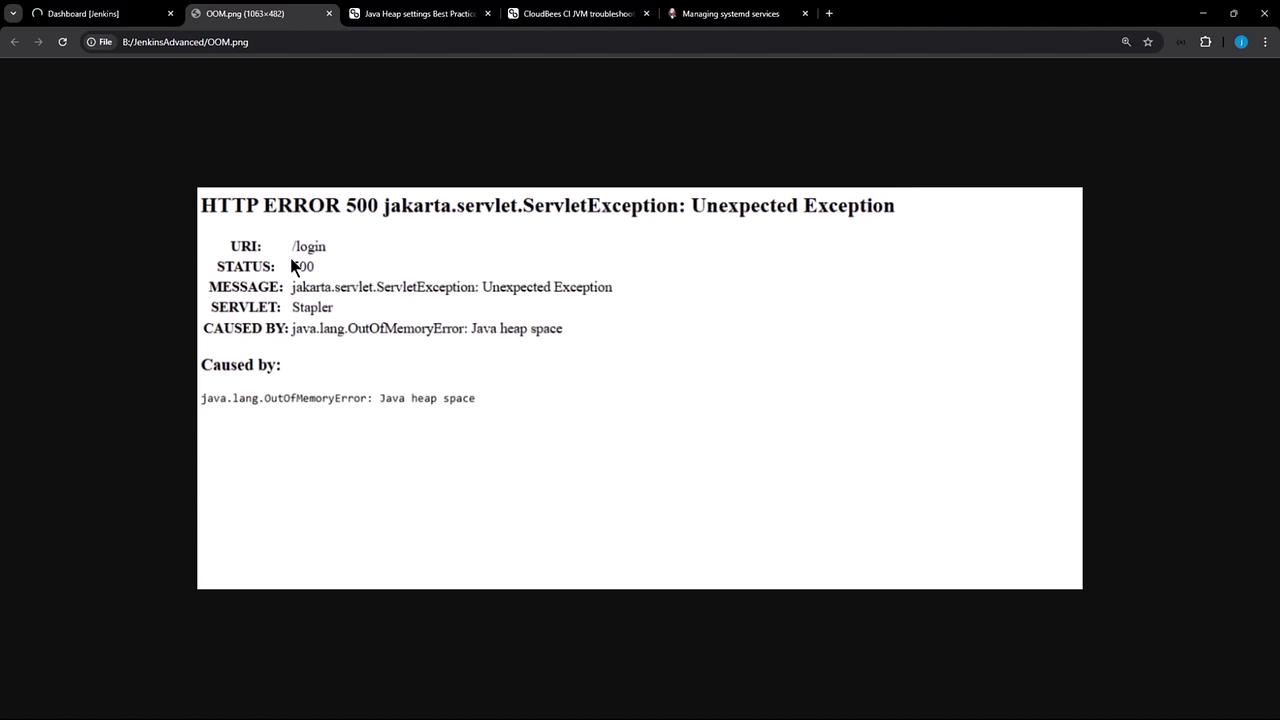
localhost:8080, you may see an HTTP 500 response indicating that the Java heap space has been exhausted:
1. Checking Current JVM Heap Settings
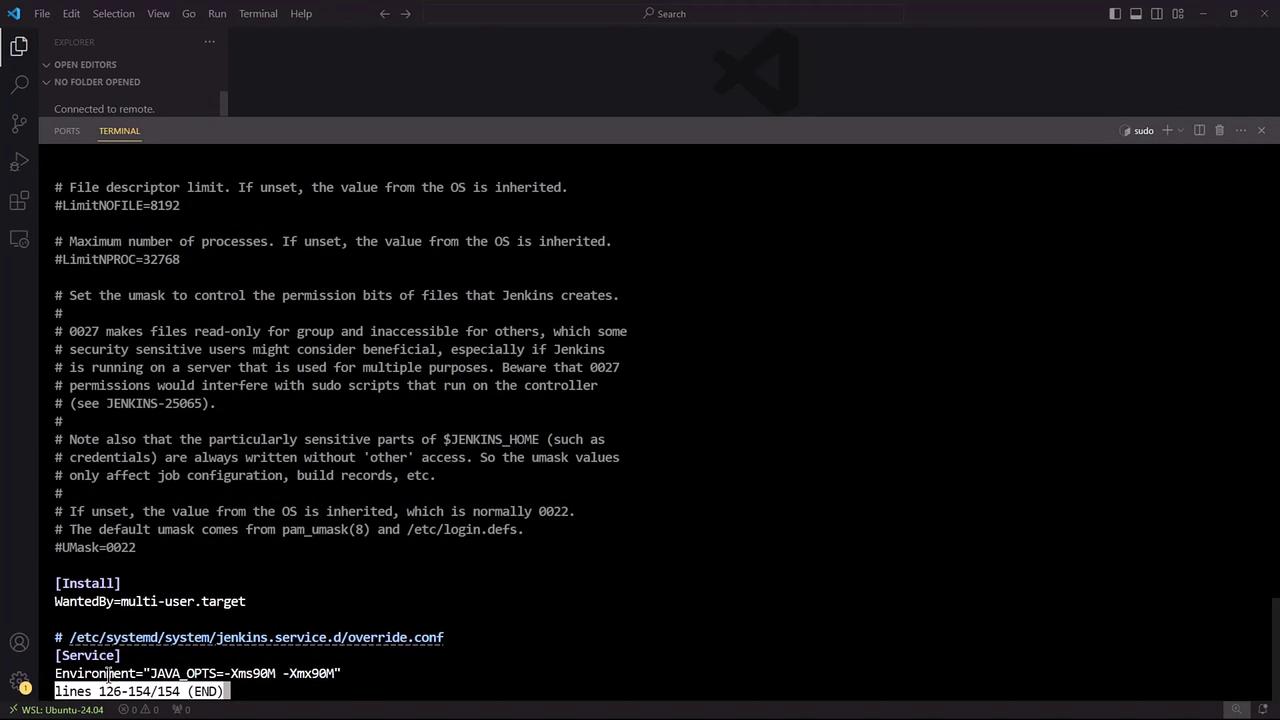
Jenkins runs as asystemd service. To view the JVM options set for Jenkins, run:
Environment="JAVA_OPTS=..." line showing -Xms and -Xmx values. For example, your service may currently be limited to 90 MB:
2. Recommended Heap Settings
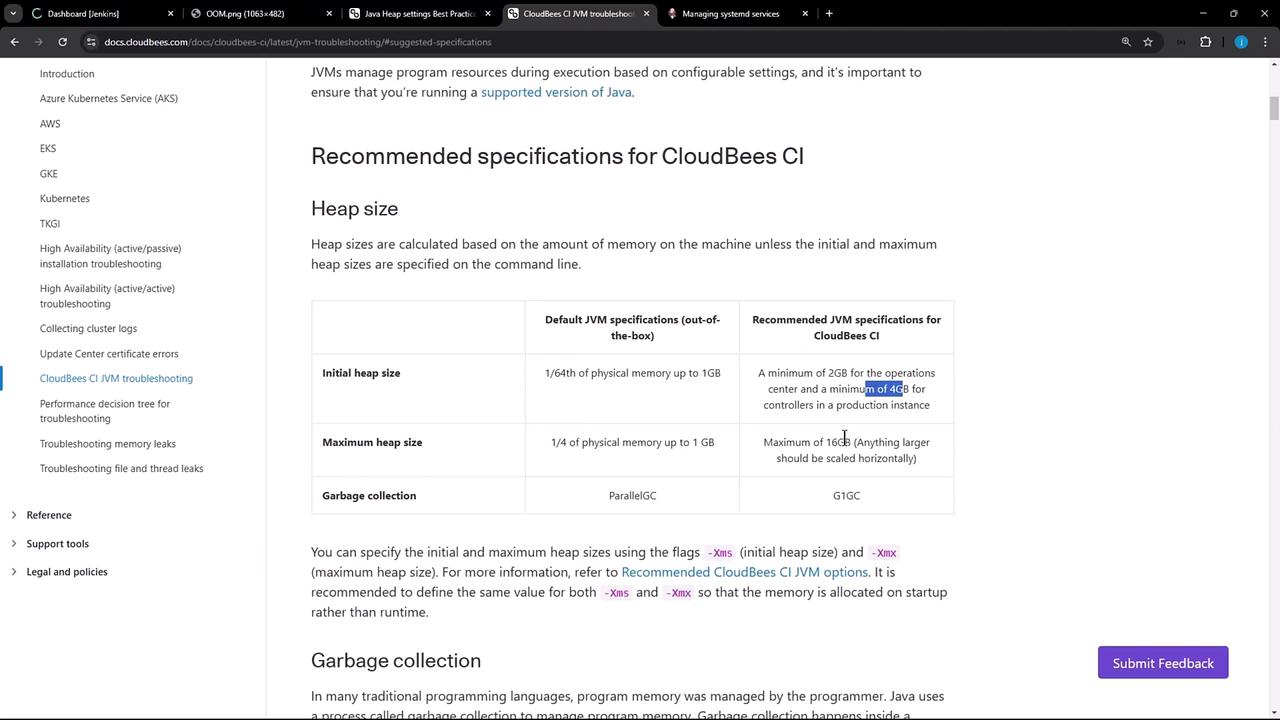
CloudBees recommends different heap configurations depending on your environment:For Kubernetes or Docker deployments, leverage
-XX:MaxRAMPercentage or orchestrator memory limits rather than hard-coded values.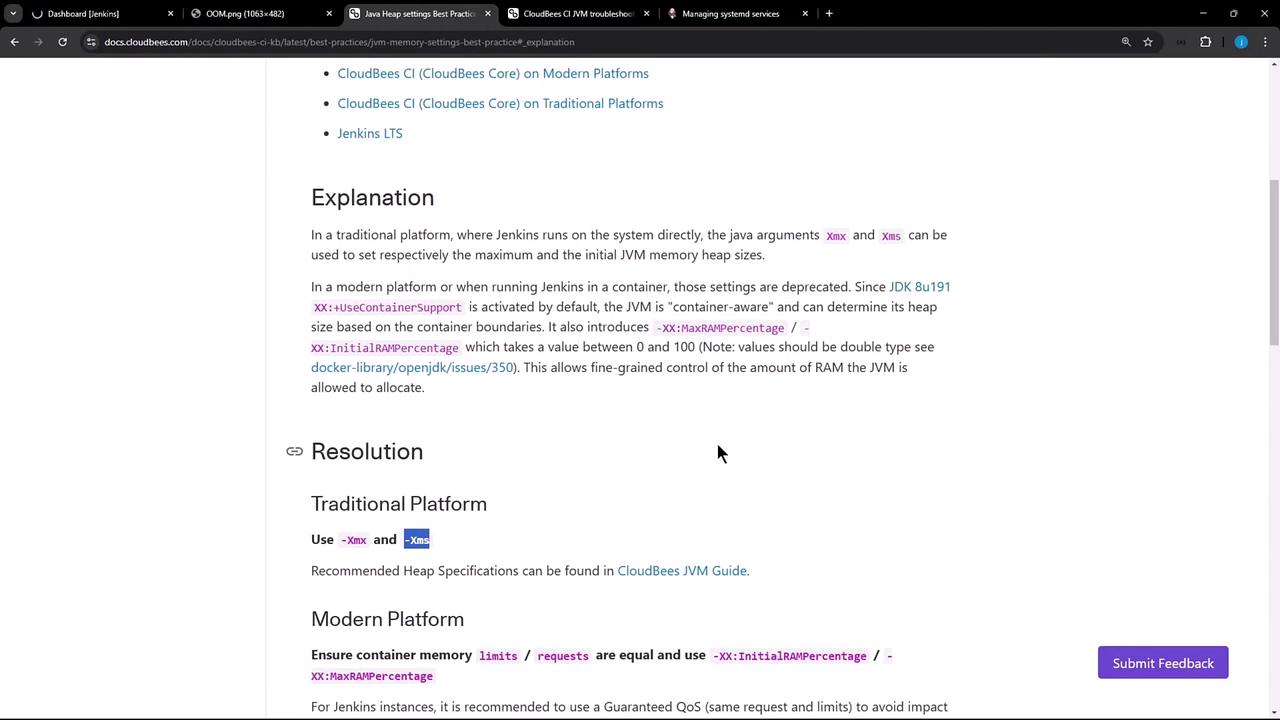
3. Creating a Systemd Drop-in to Adjust Heap
To override the default JVM options without editing the main service file, create asystemd drop-in:
/etc/systemd/system/jenkins.service.d/override.conf.
4. Verifying the Changes
Before restarting, confirm your current Jenkins process:5. Confirm in the Jenkins UI
Refresh your Jenkins dashboard. The login page should load successfully, confirming that the JVM heap has been increased.Regularly monitor heap usage, thread counts, and disk I/O as your Jenkins workloads grow. Insufficient headroom can lead to performance degradation or service outages.
References
- Jenkins Configuration as Code
- CloudBees Jenkins Platform Documentation
- Kubernetes Best Practices for JVMs