What is Cloud Monitoring?
Cloud Monitoring provides visibility into the health and performance of your infrastructure and applications. It collects metrics, surfaces them in dashboards, triggers alerts, and links to logs and traces so you can quickly find root causes when something goes wrong. Use it to:- Monitor system and application health across Google Cloud, hybrid, and multi‑cloud environments.
- Build dashboards and charts to visualize trends and anomalies.
- Configure alerting policies and notification channels to detect and respond to incidents.
- Connect metric spikes to logs and traces for fast troubleshooting.
Where telemetry comes from
Cloud Monitoring receives telemetry from several sources:- Google Cloud services (Compute Engine, GKE, Cloud SQL, VPC, etc.)
- Hybrid environments (on‑premises and AWS)
- Your applications (via client libraries and custom metrics)
- The Monitoring agent — collects system and application metrics and can be extended with plugins.
- The Ops Agent — a unified agent that collects both logs and metrics, and is the recommended choice for most workloads.
Agents: Monitoring agent vs Ops Agent
See the official Ops Agent docs for installation and configuration details:
How telemetry flows (summary)
- Infrastructure and applications generate metrics, logs, and traces.
- Agents on hosts (Monitoring agent or Ops Agent) push metrics and logs to Google Cloud. Instrumented applications or tracer libraries send traces to Cloud Trace.
- Cloud Operations ingests the data into Cloud Monitoring, Cloud Logging, and Cloud Trace.
- Dashboards, alerts, Error Reporting, and trace analysis provide visibility and debugging paths.
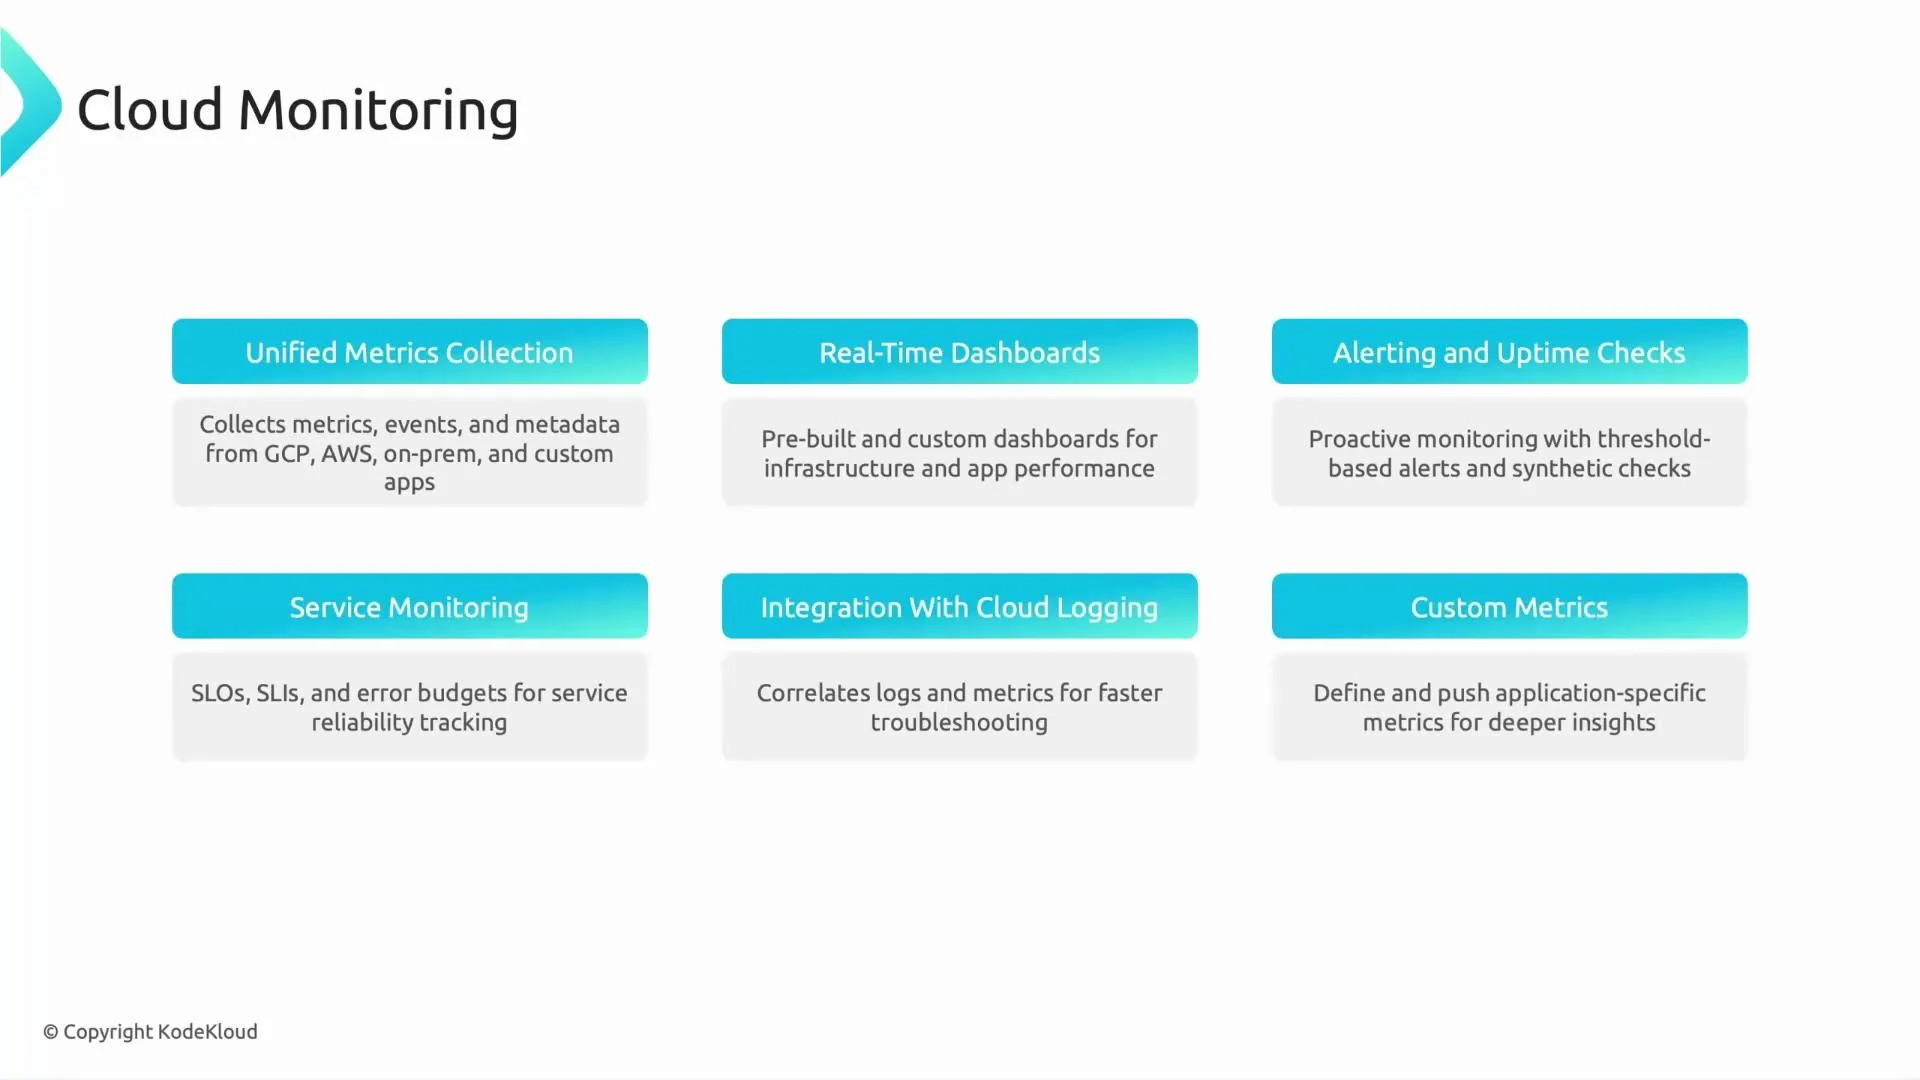
Key capabilities that make Cloud Monitoring powerful
- Unified metric collection across Google Cloud, AWS, and on‑prem systems.
- Real‑time dashboards: Use prebuilt or custom dashboards to visualize CPU, latency, error rate, throughput, and business KPIs.
- Alerting and uptime checks: Configure threshold-based alerts, notification channels, and synthetic checks to detect issues proactively.
- Service monitoring: Define SLIs (Service Level Indicators), SLOs (Service Level Objectives), and error budgets to measure and manage reliability.
- Integration with Cloud Logging and Cloud Trace: Jump from a metric spike to correlated logs and traces to speed up root-cause analysis.
- Custom metrics: Publish application-specific metrics (for example,
orders_processed_per_minuteor session durations) to monitor business-relevant signals.
Custom metrics and instrumentation
Publish custom metrics from your applications using client libraries or the Cloud Monitoring API. Custom metrics let you measure business KPIs and application-specific signals not available as system metrics. Example structure of atimeSeries payload you’d send to Cloud Monitoring (JSON example):
Exam-focused summary (what to remember)
- Cloud Monitoring is part of the Cloud Operations suite, alongside Cloud Logging, Cloud Trace, and Error Reporting.
- Metrics vs logs:
- Metrics are numeric measurements over time (e.g., CPU usage, request latency).
- Logs are event records with detailed messages (e.g., container restart, error stacktrace).
- Service monitoring concepts: SLIs (what you measure), SLOs (targets for SLIs), and error budgets (tolerated unreliability).
- Alerts and notification channels: Know how to create alerting policies, configure notification channels, and route on-call duties.
- Integration: Cloud Monitoring and Cloud Logging complement each other — you can navigate from metric anomalies to correlated logs and traces for debugging.
Tip: For most modern workloads, prefer the Ops Agent because it unifies logs and metrics collection, simplifies management, and is the recommended agent for Cloud Monitoring and Cloud Logging.
Links and references
- Cloud Operations (Monitoring, Logging, Trace, Error Reporting)
- Ops Agent documentation
- OpenTelemetry
- Cloud Trace documentation
- Cloud Monitoring client libraries