

- Amazon CloudWatch — metrics, logs, dashboards, and alarms
- AWS X-Ray — distributed application tracing
- AWS Config — resource configuration tracking and inventory
- AWS CloudTrail — API activity logging and auditing
CloudWatch
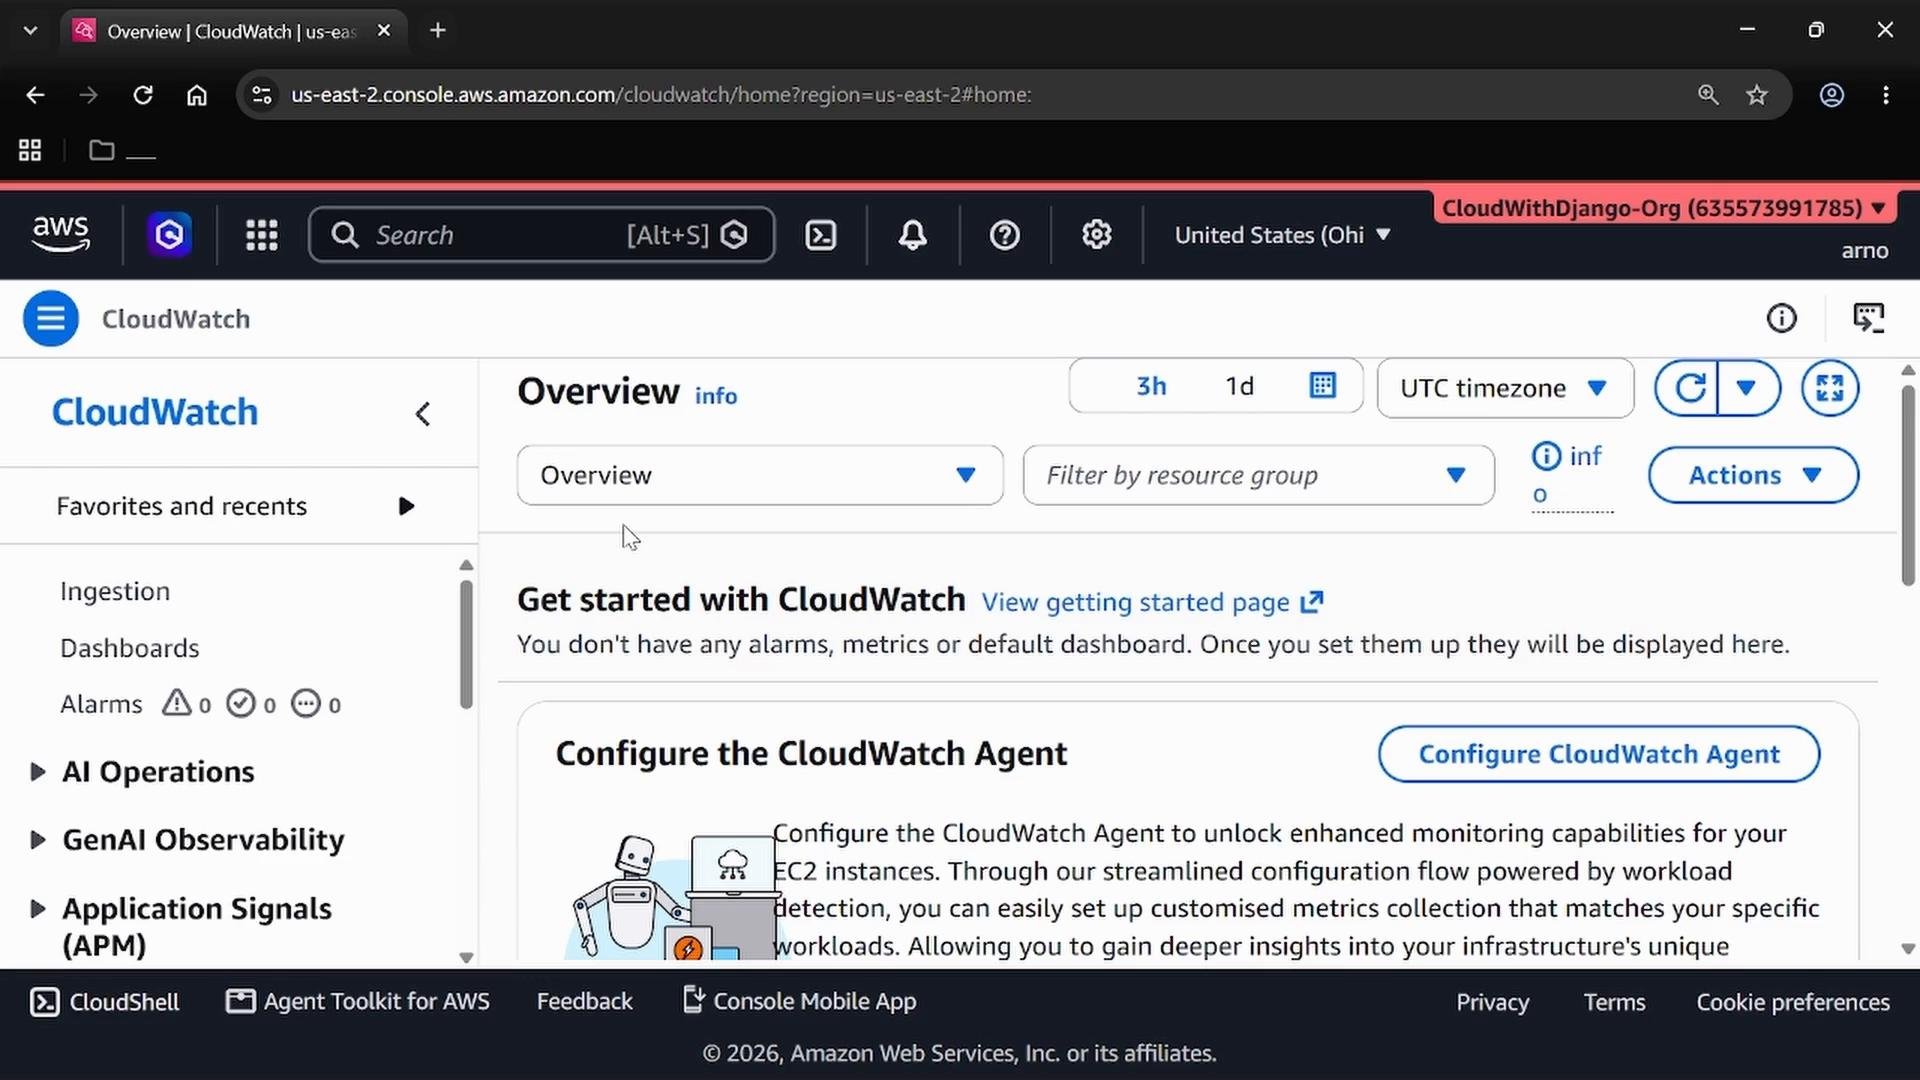
Amazon CloudWatch is the primary monitoring and observability service in AWS. It collects metrics and logs from AWS services and applications, provides visualization (dashboards), and supports alarms and automated responses. Key capabilities:- Metrics — numerical time-series (e.g.,
CPUUtilization,NetworkIn,StatusCheckFailed) for services and custom metrics from your apps. - Logs — ingest application, OS, and service logs via CloudWatch Logs. Query them interactively with CloudWatch Logs Insights.
- Dashboards — combine chart widgets, single-value (number) widgets, and text to build operational views.
- Alarms — trigger notifications (SNS), Auto Scaling, or Lambda functions based on thresholds and anomaly detection.
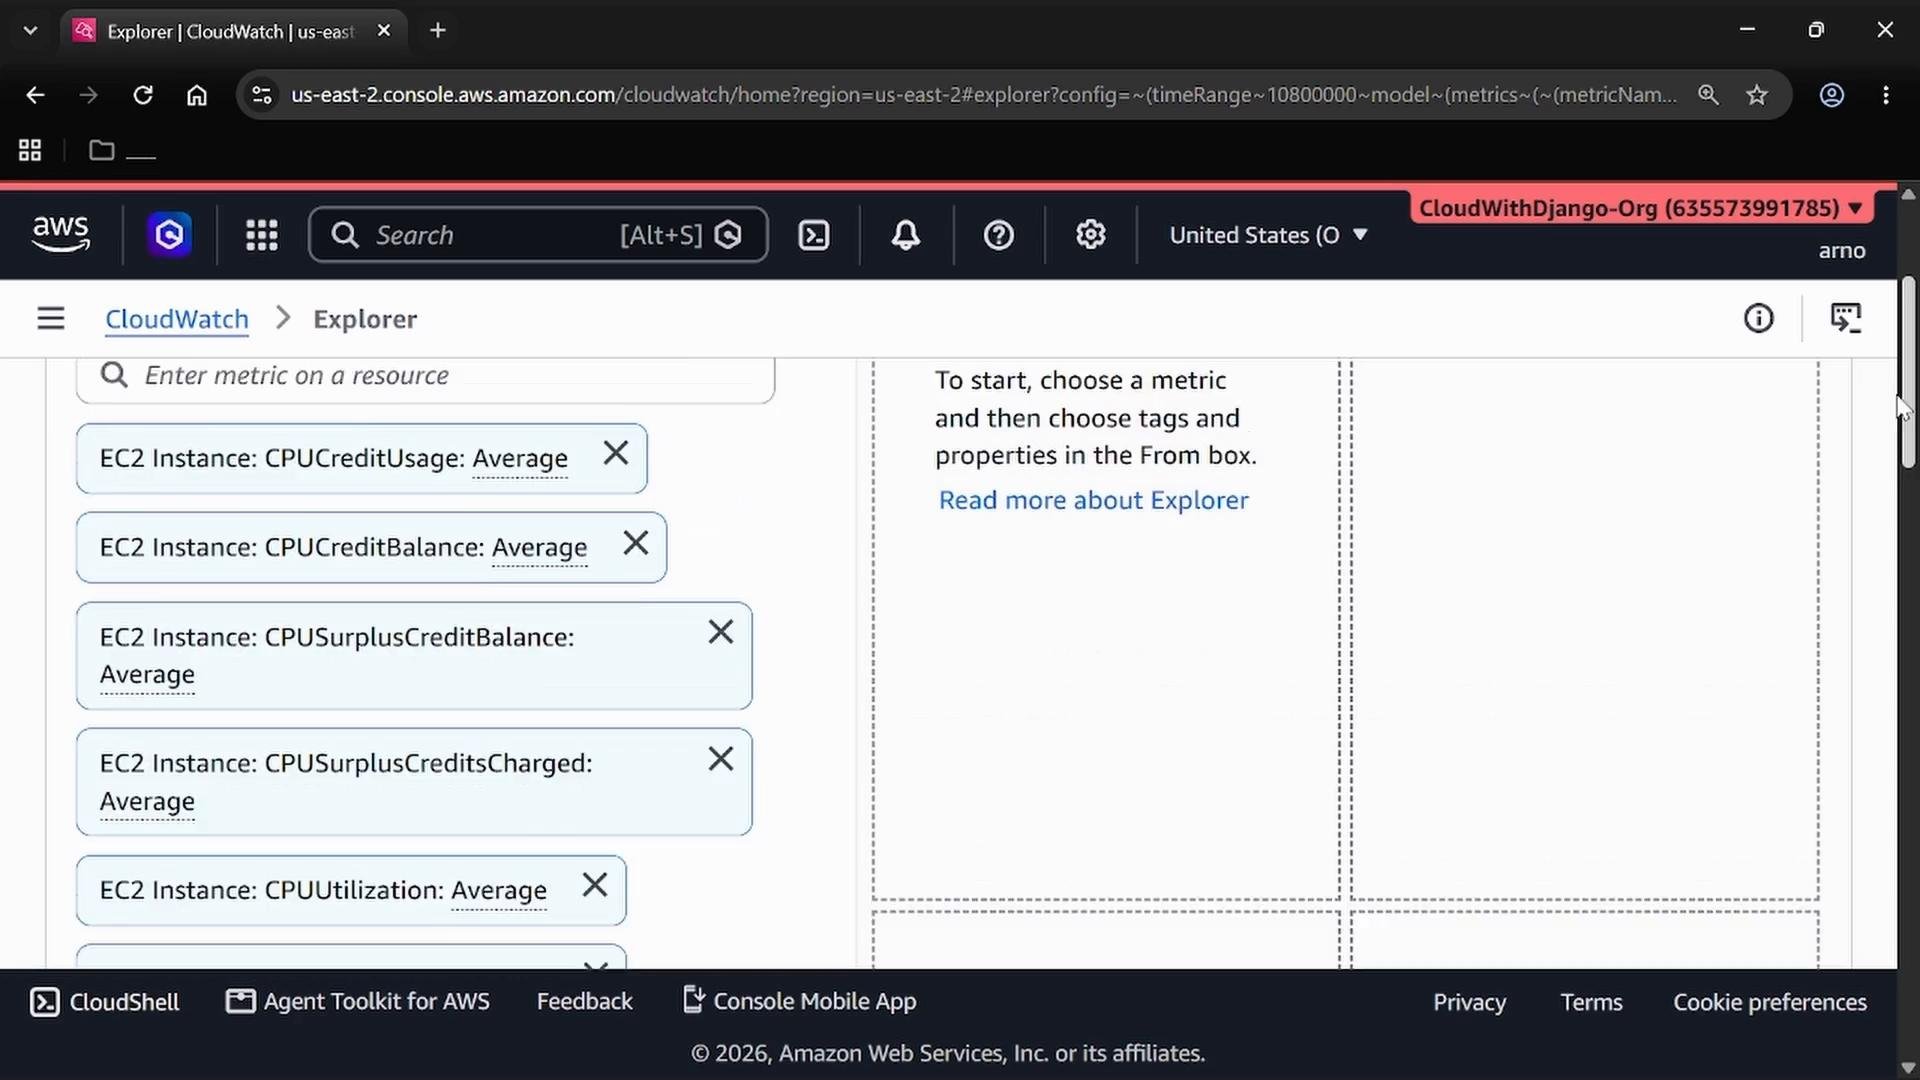
- Use the Metrics Explorer to browse by namespace, service, and resource.
- For EC2, common metrics include
CPUUtilization,CPUCreditBalance,NetworkIn, andNetworkOut. - Add metrics to dashboards to get at-a-glance health indicators for instances, databases, or entire stacks.
- CloudWatch Logs collects log streams from ECS, Lambda, EC2 (via CloudWatch Agent), and other sources.
- Logs Insights provides an ad-hoc SQL-like query language for fast analysis.
- Push application metrics (e.g., request rates, business KPIs) with
PutMetricDataor by using the CloudWatch Agent for system-level metrics (memory, disk). - Use dashboards and anomaly detection to quickly spot outliers.
X-Ray
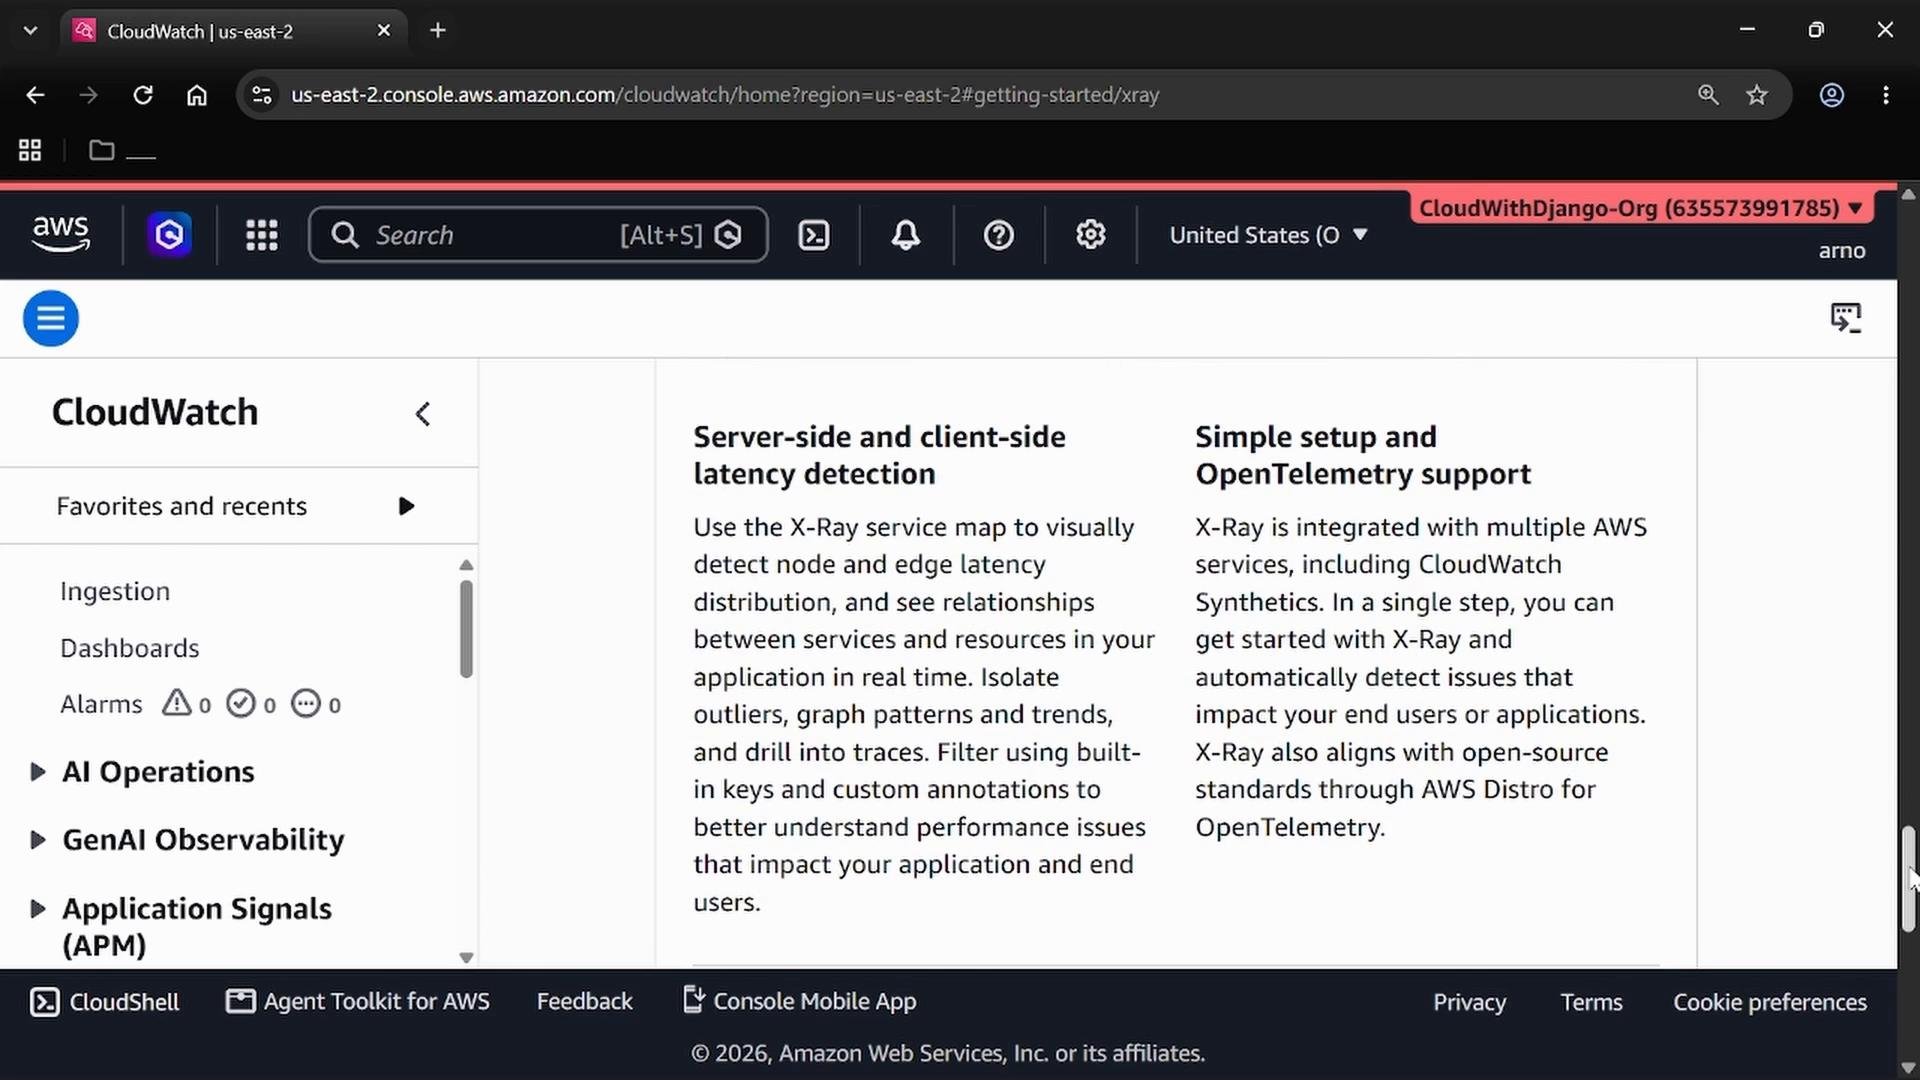
AWS X-Ray provides distributed tracing for applications. It tracks requests as they flow through services, revealing latency hotspots and error sources. Core concepts:- Traces — capture the path of a request through your system, composed of segments and subsegments.
- Segments/subsegments — represent work done by services, frameworks, or downstream calls; they contain timing, annotations, and error data.
- Service map — a visual graph that shows service interactions and highlights nodes or edges with high latency or errors.
- Instrumentation — integrate X-Ray with supported AWS services, SDKs, or use OpenTelemetry for custom instrumentation.
- Identify latency between services in microservices architectures.
- Trace a single request end-to-end to find where exceptions or retries occur.
- Augment CloudWatch metrics and logs with per-request context for faster root cause analysis.
AWS Config
AWS Config maintains resource configuration snapshots and records configuration changes over time—useful for auditing, compliance, and troubleshooting configuration drift. Capabilities:- Resource inventory — a searchable catalog of recorded resources and their configuration states.
- Configuration history — view how a resource’s configuration changed across time.
- Rules & Compliance — author rules (managed or custom) to evaluate resources against governance policies and get compliance reports.
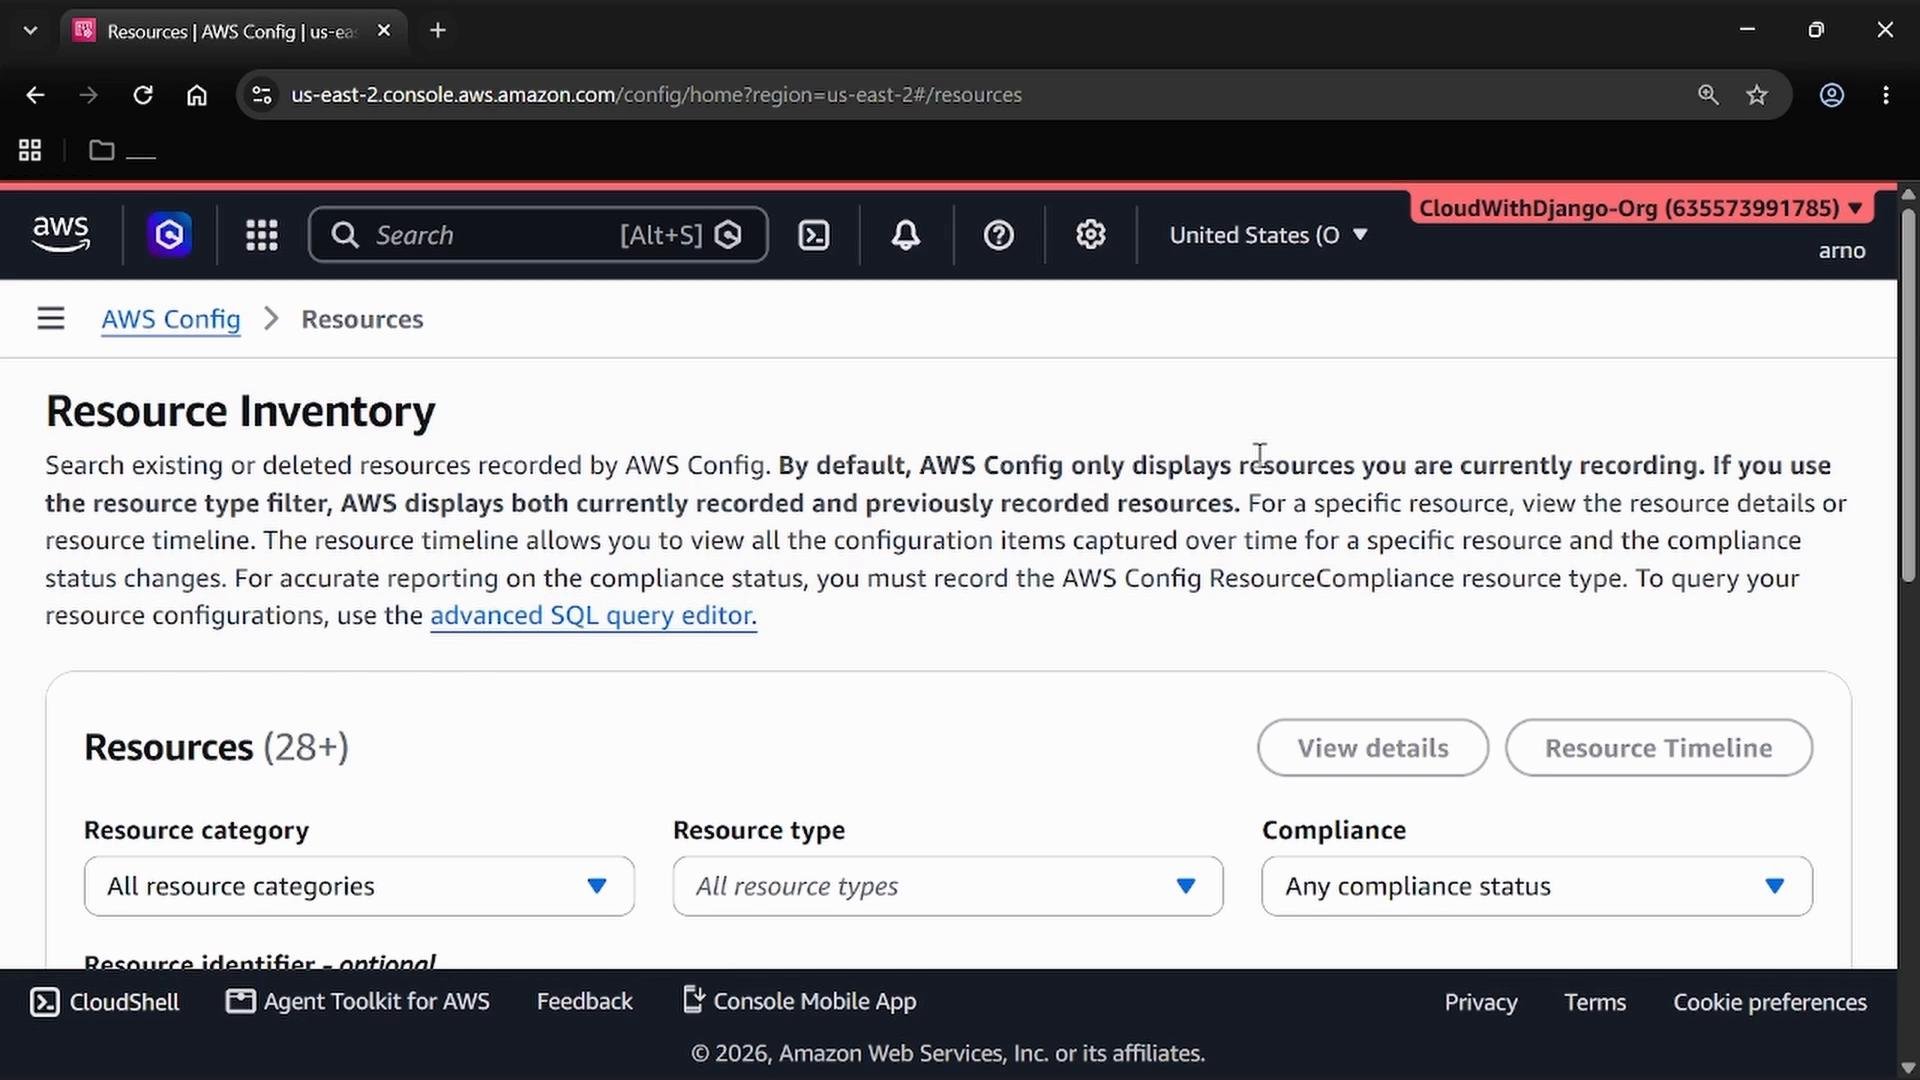
- Enable the Config recorder and deliver snapshots to an S3 bucket for long-term retention.
- Use Config Rules to detect drift (e.g., open security groups, unencrypted volumes) and generate reports.
- Combine Config history with CloudTrail events to see both “what changed” and “who changed it.”
CloudTrail
AWS CloudTrail records account-level and (optionally) data plane API activity. It answers “who did what, when, and from where” for API calls across your account and organization. Primary features:- Event history — searchable recent API actions (time, API call, user identity, source IP, and resources).
- Trails — configure multi-region, organization-wide trails to deliver events to S3, CloudWatch Logs, or to integrate with security tooling.
- Use cases — security auditing, operational troubleshooting, forensic analysis, and compliance evidence.
For production workloads, enable a multi-region trail and deliver CloudTrail logs to a dedicated S3 bucket with strict IAM policies and lifecycle rules. This prevents accidental deletion and ensures logs are retained for audits and incident response.
- CloudWatch: operational metrics, dashboards, and alarms for real-time health and automated responses.
- X-Ray: per-request traces and service maps to troubleshoot performance and latency at the application level.
- AWS Config: configuration snapshots and compliance checks to detect drift and prove governance.
- CloudTrail: immutable audit trail of API activity for security and forensics.
References and next steps
- Amazon CloudWatch docs: https://docs.aws.amazon.com/cloudwatch/
- AWS X-Ray docs: https://docs.aws.amazon.com/xray/
- AWS Config docs: https://docs.aws.amazon.com/config/
- AWS CloudTrail docs: https://docs.aws.amazon.com/cloudtrail/
These four services complement each other: use CloudWatch for operational metrics and alerts, X-Ray for request-level tracing, AWS Config for configuration and compliance history, and CloudTrail for auditing API activity. Together they provide a comprehensive observability and governance foundation on AWS.